

Abstract
Microglia play an essential role in many brain diseases. Microglia are activated by local tissue damage or inflammation, but systemic inflammation can also activate microglia. An important clinical question is whether the effects of systemic inflammation on microglia mediates the deleterious effects of systemic inflammation in diseases such as Alzheimer's dementia, multiple sclerosis, and stroke. Positron Emission Tomography (PET) imaging with ligands that bind to Translocator Protein (TSPO) can be used to detect activated microglia. The aim of this study was to evaluate whether the effect of systemic inflammation on microglia could be measured with PET imaging in nonhuman primates, using the TSPO ligand [11C]PBR28.
Methods
Six female baboons (Papio anubis) were scanned before and at 1 h and/or 4h and/or 22h after intravenous administration of E. coli lipopolysaccharide (LPS; 0.1 mg/kg), which induces systemic inflammation. Regional time-activity data from regions of interest (ROIs) were fitted to the two-tissue compartmental model, using the metabolite-corrected arterial plasma curve as input function. Total volume of distribution (VT) of [11C]PBR28 was used as a measure of total ligand binding. The primary outcome was change in VT from baseline. Serum levels of tumor necrosis factor alpha (TNFα), interleukin-1 beta (IL-1β), interleukin-6 (IL-6), and interleukin-8 (IL-8) were used to assess correlations between systemic inflammation and microglial activation. In one baboon, immunohistochemistry was used to identify cells expressing TSPO.
Results
LPS administration increased [11C]PBR28 binding (F(3,6)=5.1, p=.043) with a 29±16 % increase at 1h (n = 4) and a 62±34% increase at 4h (n = 3) post-LPS. There was a positive correlation between serum IL-1β and IL-6 levels and the increase in [11C]PBR28 binding. TSPO immunoreactivity occurred almost exclusively in microglia and rarely in astrocytes.
Conclusion
In the nonhuman-primate brain, LPS-induced systemic inflammation produces a robust increase in the level of TSPO that is readily detected with [11C]PBR28 PET. The effect of LPS on [11C]PBR28 binding is likely mediated by inflammatory cytokines. Activation of microglia may be a mechanism through which systemic inflammatory processes influence the course of diseases such as Alzheimer's, multiple sclerosis, and possibly depression.
Keywords: inflammation, lipopolysaccharide, microglia, translocator protein, PET, nonhuman primate
1. Introduction
Microglia, the brain's innate immune cells, are involved in a variety of physiologic and pathologic processes (Tambuyzer et al. 2009). Under physiologic conditions, microglia are tightly regulated by interactions with neurons (Ponomarev et al. 2011). When provided with signals indicating tissue damage or inflammation, microglia become activated; this is a key event in the pathophysiology of brain ischemia, trauma, and infection, and in neurodegenerative and autoimmune diseases (Chan et al. 2007; Tambuyzer et al. 2009; Chen et al. 2010). Although activated microglia serve important repair functions, they may substantially worsen brain diseases through the release of molecules that can cause neuronal dysfunction and damage, e.g. inflammatory cytokines and reactive oxygen species (Block et al. 2007; McNally et al. 2008; van Gool et al. 2010). Microglia primarily receive signals from local sources in the brain; however, systemic signals also affect microglial function. The effect of systemic inflammation on microglia is part of the bi-directional signaling that occurs between the immune system and the brain (DellaGioia and Hannestad 2010) and a potential mechanism through which systemic inflammation affects the course of brain diseases (Teeling and Perry 2009). For instance, in individuals with mild cognitive impairment, sepsis, which causes severe systemic inflammation, often results in acute and long-term cognitive impairment (Davies et al. 2006; Girard et al. 2010; Iwashyna et al. 2010); this may be mediated by activation of microglia (Lemstra et al. 2007). Milder forms of systemic inflammation (e.g. urinary tract infections) can also cause brain dysfunction (delirium) in susceptible individuals such as those with mild cognitive impairment, and it is believed that repeated systemic inflammation worsens the course of Alzheimer's disease (Cunningham 2011).
Similarly, when systemic inflammation occurs concurrently with a cerebrovascular accident, the ischemic lesion is larger (Denes et al. 2010). In multiple sclerosis, systemic inflammation is associated with faster progression, and this has been hypothesized to involve activation of microglia (Teeling and Perry 2009). In summary, systemic inflammation has a well-established impact on the course and severity of a variety of brain diseases, and this impact may be mediated by the activation of microglia. Although the effects of systemic inflammation on a diseased brain are much more pronounced than the effects on a healthy brain (Teeling and Perry 2009; Cunningham 2011), even in healthy subjects systemic inflammation affects behavior (Hannestad et al. 2011) and brain metabolism (Hannestad et al. 2012). One common symptom caused by systemic inflammation is fatigue. Therefore, systemic inflammation may be the reason fatigue commonly occurs in diseases that do not usually affect the brain directly, such as rheumatic diseases, infections, and cancer (Bower 2007). Lastly, in many patients with depression, there is a state of mild systemic inflammation (Dowlati et al. 2010), which may contribute to depressive symptoms through effects on microglia (McNally et al. 2008).
Because microglia may mediate the effects of systemic inflammation on the brain, we used PET imaging of the Translocator Protein (TSPO) (Venneti et al. 2006) to test the hypothesis that lipopolysaccharide (LPS)-induced systemic inflammation would cause microglial activation in non-human primates, as is well-established in rodents (Qin et al. 2008; Semmler et al. 2008). The expression of TSPO is very low in healthy brain tissue, but it increases in diseases associated with microglial activation, including stroke, trauma, infection, and autoimmune and neurodegenerative disorders (Cosenza-Nashat et al. 2009; Batarseh and Papadopoulos 2010). The TSPO ligand [11C]PBR28 was chosen because of its high specific binding in non-human primates (Imaizumi et al. 2008). Because TSPO expression is diffuse, and because we expected the effect of LPS to occur in all regions, no brain region devoid of TSPO could be used as a reference region. Therefore, the arterial input function was reuired for proper quantification. The need for the arterial input function was the main reason for conducting this study in baboons and not in rats. In addition, the baboon's response to LPS is physiologically and immunologically very similar to humans (Redl and Bahrami 2005), therefore the results would be more readily translatable. Our primary hypothesis was that LPS administration would produce microglial activation and therefore significantly increased [11C]PBR28 binding compared to baseline. Serum levels of tumor necrosis factor alpha (TNFα), interleukin-1 beta (IL-1β), IL-6, and IL-8 were measured to assess correlations between systemic inflammation and microglial activation. In one animal, immunohistochemistry was used to confirm that TSPO expression occurs primarily in microglia after LPS administration.
2. Material and methods
2.1 Animals
Research was conducted in compliance with Animal Welfare Act regulations and other Federal statutes relating to animal experiments, it adhered to the principles set forth in the Guide for Care and Use of Laboratory Animals (National Research Council, 1996), and was approved by the Yale University Institutional Animal Care and Use Committee (protocol #2009-11330). The baboon (Papio anubis) was chosen for this PET imaging study because the lack of a reference region requires arterial input function for proper quantification. Six female baboons (weight 14.5 ± 5.1 kg) were ovariohysterectomized at least 3 months prior to the study as estrogen can affect TSPO expression (Batarseh and Papadopoulos 2010). Prior to each study, animals were fasted overnight and were then initially anesthetized with ketamine (10 mg/kg i.m.), intubated, and maintained under ∼2% isoflurane anesthesia for the duration of each experiment (during each PET scan and during the peak effects of LPS). The peripheral antimuscarinic agent glycopyrrolate (5-10 μg/kg) was used to reduce secretions. An arterial line was inserted into the femoral artery for measurement of the radiotracer input function, and an intravenous catheter was inserted in the posterior tibial vein for administration of fluids, [11C]PBR28, and LPS. Heart rhythm, respiratory frequency, oxygen saturation, and end-tidal pCO2 were continuously monitored. Blood pressure was recorded at least every 15 min. Body temperature was monitored with a rectal probe. Each animal had one baseline PET scan (n = 6). LPS was administered immediately after the end of the baseline scan, and the animals were scanned again 1h (n = 4) and/or 4h (n = 3) and/or 22h (n = 2) after LPS administration. Animals were under anesthesia from the baseline scan until the completion of the 1h or 4h scan. Animals that had a scan the following day were recovered and then anesthetized again the next day. After the last scan on each day, isoflurane was stopped, and the animals were recovered under veterinary care. One animal that had a PET scan at baseline and 4h post-LPS was killed immediately after the 4h scan (6h post-LPS) using 0.25 ml/kg Euthasol® (sodium pentobarbital 390 mg/ml and sodium phenytoin 50 mg/ml). The brain was processed for immunohistochemistry.
2.2 LPS administration and inflammatory cytokine levels
LPS (0.1 mg/kg, E. coli serotype O111:B4, Sigma, St. Louis, MO) was dissolved in saline and administered as an IV bolus immediately after the baseline PET scan. This dose of LPS was chosen to produce a state of moderate systemic inflammation (Haudek et al. 2003). Blood samples were obtained from the arterial line before the baseline scan (−2h), at the end of the baseline scan (0h), and 1h, 1.5h, 2h, 3h, 3.5h, 4.5h, 5.5h and ∼22h after LPS administration. Serum was stored at −70°C until assayed. The Quantikine® quantitative sandwich enzyme immunoassay for human IL-6 (R&D Systems, Inc., Minneapolis, MN) was used because it cross-reacts with baboon IL-6 (Welty-Wolf et al. 2000). In addition, electrochemiluminescence multi-array technology (Meso Scale Discovery, Gaithersburg, MD) was used to measure serum levels of TNFα, IL-1β, IL-6, and IL-8. Cytokine-specific capture assay are coated in arrays in each well of a 96-well carbon electrode plate surface. Serum (25 ml) was added to the wells in duplicate and incubated for 2 hours at room temperature. After several washing steps SULFO-TAG℗ labeled secondary antibodies were added. A read buffer was then added to provide an appropriate chemical environment for electrochemiluminescence. The plates were read on the Sector Imager, which applies a voltage to the plate electrodes causing the bound labels to emit light. The intensity of emitted light is proportional to the amount of cytokine present in the sample.
2.3 Magnetic resonance imaging
An MR brain image for each baboon was acquired on a 3T scanner to assist with anatomical localization of regions of interest (ROIs). A T1-weighted coronal MR imaging sequence was used: echo time = 3.34 ms, repetition time = 2530 ms, 176 slices, slice thickness = 0.54 mm, flip angle = 7 degrees, image matrix = 256×256, pixel size=0.5×0.5, field of view = 140 mm, 3D turbo flash.
2.4 Radiotracer synthesis
The TSPO ligand [11C]PBR28 was chosen because the 20-min half-life of 11C permits multiple measurements of binding within a short time period and because this ligand has more than 90% specific binding in the brain of another nonhuman primate, the Rhesus macaque (Imaizumi et al. 2008). The precursor and the reference standard for [11C]PBR28 was provided by the NIMH Chemical Synthesis and Drug Supply Program. [11C]PBR28 was labeled by alkylation of the desmethyl precursor, N-(2-hydroxybenzyl)-N-(4-phenoxypyridin-3-yl)acetamide, with [11C]methyl iodide generated from cyclotron-produced produced [11C]CO2 (PETrace cyclotron, GE, Milwaukee, WI). Synthesis of [11C]PBR28 was carried out either with a TRACERLab™ FxC automated synthesis module (GE Medical Systems), or with AutoLoop™ (Bioscan Inc., Washington, D.C.). The crude reaction mixture was purified by a semi-preparative High Performance Liquid Chromatography (HPLC) column (Onyx Monolithic C18, 100 mm × 10.0 mm, Phenomenex) eluted with mobile phase at 3 mL/min, and monitored for radioactivity and UV absorbance at 254 nm. Total synthesis time was ∼60 min from end of bombardment. Specific activity, chemical purity, and radiochemical purity of [11C]PBR28 were determined by radio-HPLC with a UV detector (Shimadzu LC-20AT Prominence System, SPD-M20A Diode Array detector or with a SPD-20A UV/Vis detector) coupled with a gamma detector (Bioscan), using a Gemini C-18 analytical column eluted with MeCN/0.1 M ammonium formate (44%/56% v/v) at 2 ml/min. The specific activity for [11C]PBR28 was determined by counting an aliquot in a dose calibrator and determining the mass by HPLC against a calibration curve of the cold standard. Identity was confirmed by co-injection with the standard. The average radiochemical yield was 20.8% ± 6.4% at the end of synthesis (based on trapped [11C]methyl iodide) with a specific activity of 688 ± 225 MBq/nmol (18.6 ± 6.1 mCi/nmol). The chemical and radiochemical purity of [11C]PBR28 were both > 98%.
2.5 PET imaging
The anesthetized baboon's head was positioned using a custom-designed stereotaxic head holder and imaged with the ECAT EXACT HR+ PET scanner (Siemens, Knoxville, TN). A transmission scan was obtained for attenuation correction. An average radioactive dose of 176.0 ± 4.7 MBq of [11C]PBR28 was administered as a 3-min bolus using an infusion pump. The mass dose of unlabeled PBR28 was 0.019 ± 0.013 μg/kg. A two-hour emission scan was acquired after each injection. Dynamic images (33 frames over 120 minutes) were reconstructed with corrections for attenuation, normalization, random events, scatter, and deadtime with the attenuation-weighted ordered-subset-expectation-maximization algorithm (Reader et al. 1998). Manual blood samples were drawn at 0.75, 1.5, 2.25, 3, 3.75, 4.5, 5.25, 6, 8, 19, 15, 20, 25, 30, 40, 50, 60, 75, 90, 105 and 120 min after [11C]PBR28 injection to measure the time-course of total radioactivity and the parent fraction in plasma, i.e., the fraction of plasma radioactivity attributable to [11C]PBR28, as determined by HPLC.
2.6 PET image analysis
PET-to-MRI registrations were performed using the automated image registration algorithm (Woods et al. 1993) as an initialization step, followed by two iterative registrations based on normalized mutual information (NMI). The individual MRI was warped to a baboon MRI template using a linear NMI plus nonlinear registration. The template MRI was created by averaging 5 individual baboon MR images that were spatially normalized using a NMI linear plus nonlinear registration. Transformation matrices from the individual registrations (template-to-MRI and MRI-to-PET) were inverted to produce PET data in template-space. To generate each regional time-activity curve (TAC; results expressed as KBq/ml), the mean radioactivity in the ROI was calculated for each frame as a function of time. The following ROIs were delineated on the baboon template image: frontal, cingulate, insular, and occipital cortex, caudate, putamen, nucleus accumbens, and brainstem. A voxel-weighted average of those ROIs was used as a measure of whole-brain binding. TACs were fitted to the two-tissue compartmental model, using the metabolite-corrected arterial plasma curve as the input function. Volume of distribution (VT) was calculated from the estimated model parameters for each ROI. We chose VT as the primary outcome measure because it is insensitive to any blood flow changes or any changes in blood-brain barrier permeability caused by LPS. Total plasma radioactivity, un-metabolized fraction, and the metabolite-corrected input function are shown in Supplementary Fig. 1. Whole-brain TACs are shown in Supplementary Fig. 2.
2.7 Immunohistochemistry
One baboon was killed immediately following the 4h post-LPS scan (6h after LPS administration). The brain was halved along the corpus callosum and fixed in 4% buffered formaldehyde. Subsequently, the brain was dissected, and parts of the frontal and temporal cortex, striatum, brain stem, and cerebellum were embedded in paraffin. Sections (10 μm) were processed for immunohistochemistry. The following commercial antibodies were used in adjacent sections: glial fibrillary acidic protein (GFAP; Thermo Fisher Scientific, Waltham, MA, USA) for astrocytes; protein gene product 9.5 (PGP 9.5; Millipore/Chemicon, Billerica, MA, USA) for neurons; cluster of differentiation 68 (CD68; Thermo Fisher Scientific) for microglia and macrophages (Ulvestad et al. 1994; Slepko and Levi 1996); and CD163 (Cell Marque, Rocklin, CA, USA) for perivascular macrophages (Fabriek et al. 2005). A rabbit polyclonal antibody against TSPO and pre-immune serum from the same rabbit, used as a negative control, were provided by Janet Morgan, Ph.D. (Roswell Park Cancer Institute). Secondary antibodies were either sheep anti-mouse or sheep anti-rabbit. The immunoreaction was visualized with 3,3′-diaminobenzidine as a chromogen. Slides were counterstained with hematoxylin and viewed and photographed with a Zeiss microscope.
2.8 Statistical analysis
The primary hypothesis was that LPS administration would be associated with an increase in whole-brain [11C]PRB28 binding (VT) from baseline (0h) to 1h and 4h, and a return to baseline at 22h. Binding of [11C]PBR28 was assessed using a linear mixed model with time (0h, 1h, 4h, 22h) included as a within-subjects factor. The best-fitting variance-covariance structure was determined by the Bayesian information criterion. Significant time effects were subsequently analyzed with Tukey's multiple comparison procedure to determine post-hoc pairwise differences adjusted for Type I error. Changes in cytokine levels were assessed using a similar mixed model, with time (−2h, 0h, 1h, 1.5h, 2h, 3h, 3.5h, 4.5h, 5.5h, and 22h) included as a within-subjects factor. Correlations between changes in [11C]PBR28 binding (VT) and cytokine levels were assessed with both Spearman's (non-parametric) and Pearson's (parametric) correlations. All data are reported as mean ± standard deviation (S.D.).
3. Results
3.1 Physiologic and immune parameters
The change over time in heart rate, blood pressure, rectal temperature, and cytokine levels are illustrated in Fig 1. After LPS administration, heart rate increased (Fig. 1A), while systolic and diastolic blood pressures increased for a short time, then decreased (Fig. 1B). Rectal temperature did not increase until 4h after LPS administration (Fig. 1C). Serum levels of inflammatory cytokines increased after LPS administration (Fig. 1D and Supplementary Fig. 3). There was a strong correlation between IL-6 levels measured with ELISA and with electrochemiluminescence (r = 0.88, p < .00001). At 22h, only IL-6 was measured; IL-6 levels at 22h were still elevated compared to baseline, especially in one baboon, which had an IL-6 level of 1.3 ng/ml and was noted to be lethargic the day after LPS administration. Individual IL-6 data as measured with ELISA are listed in Supplementary Table 1.
Fig. 1.
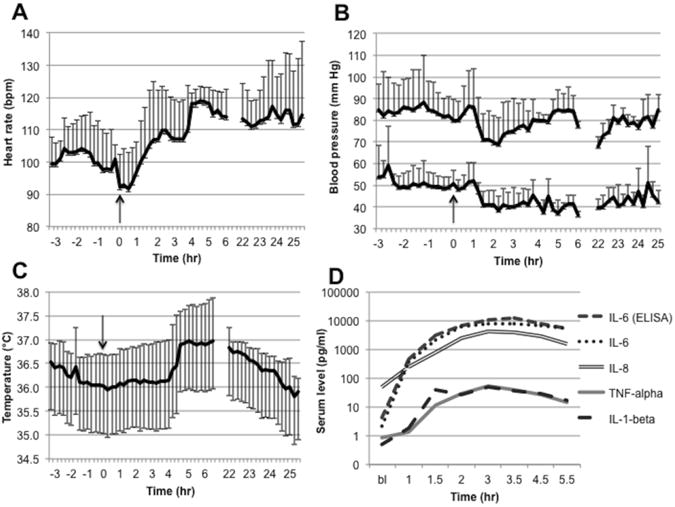
The physiologic and immune response to LPS administration. LPS was administered at 0h (arrows), and each data point pre- and post-LPS administration represents data (mean and standard deviation) from all baboons measured at a given time: n = 6 for the pre-LPS through 3h period, n = 3 for the 4h through 6h period, and n = 2 for the 22h through 25h period. (A) Heart rate increased after LPS administration and stayed elevated until the following day. (B) Systolic and diastolic blood pressure increased slightly after LPS administration and subsequently decreased. Systolic blood pressure normalized after approximately 4 hours, while diastolic blood pressure remained lower until the following day. (C) Rectal temperature increased approximately 4 hours after LPS administration and remained elevated until the following day. (D) Levels of inflammatory cytokines (TNFα, IL-1β, IL-6, and IL-8) increased after LPS administration. IL-6 levels were measured with both electrochemiluminenscence and immunsorbent assays (see Methods for details). Abbreviations: ELISA, enzyme-linked immunosorbent assay; IL, interleukin; LPS, lipopolysaccharide; TNF, tumor necrosis factor.
3.2 Whole-Brain and Region-of-Interest Analysis
Consistent with our a priori hypothesis, there was a significant effect of time on [11C]PBR binding (F (3,6) = 5.1, p = .043) due to an increase in whole-brain [11C]PBR28 binding (VT) from 0h to 1h and 4h post-LPS (Fig. 2). Tukey's test revealed a significant difference between 0h and 4h (corrected p = .039), while the other comparisons did not reach significance after correction: 0h vs. 1h (p = .24), 0h vs. 22h (p = .11), and 1h vs. 4h (p = .17). The lack of a statistically significant difference between 0h and 1h in the mixed model was probably because the baboons that were scanned at 4h had higher baseline binding than those that were scanned at 1h (Fig. 3). When comparing each group of scans (1h and 4h) to their corresponding baseline, there was a 28.8 ± 15.7 % increase in binding at 1h (range 11.5%-47.4%) and a 61.8 ± 34.4 % increase in binding at 4h (range 35.6%-100.7%). The day after LPS administration (n = 2), binding in one baboon returned to baseline after a 34.7% increase at 1h, whereas binding in the other baboon imaged at 22h showed an unexpected 42.7% reduction in binding below baseline. Region-of-interest analysis showed an increase in [11C]PBR28 binding in all nine ROIs at 1h and 4h (Fig. 4 and Supplementary Table 2), with no differential pattern across regions. Post-hoc statistical tests for each region are provided in Supplementary Table 3. Specific activity was 304±170 MBq/nmol at the time of injection. There was no correlation between specific activity at the time of injection and baseline VT (y = −0.0382x + 34.13, r2 = 0.271, p = .29). LPS administration had no effect on K1 (the rate of influx of radiotracer from blood into the brain). K1 values (mean ± standard deviation) were: 0.41±0.12 mL/min/g (range 0.23-0.56) at baseline; 0.39±0.10 mL/min/g (range 0.30-0.57) at 1h, 0.6±0.10 mL/min/g (range 0.50-0.70) at 4h, and 0.27±0.03 (range 0.25-0.29) mL/min/g at 22h. There were no statistically significant differences between K1 at baseline and K1 at any post-LPS timepoint (all p > .2).
Fig. 2.

Change in [11C]PBR28 binding (VT) after LPS administration in the one baboon that had a PET scan at baseline and 1h and 4h post-LPS (the other baboons had either a 1h or a 4h scan). (A) MRI from this baboon. (B) [11C]PBR28 binding at baseline. (C) [11C]PBR28 binding 1h post-LPS. (D) [11C]PBR28 binding 4h post-LPS. Abbreviations: LPS, lipopolysaccharide; MRI, magnetic resonance imaging; VT, total volume of distribution.
Fig. 3.
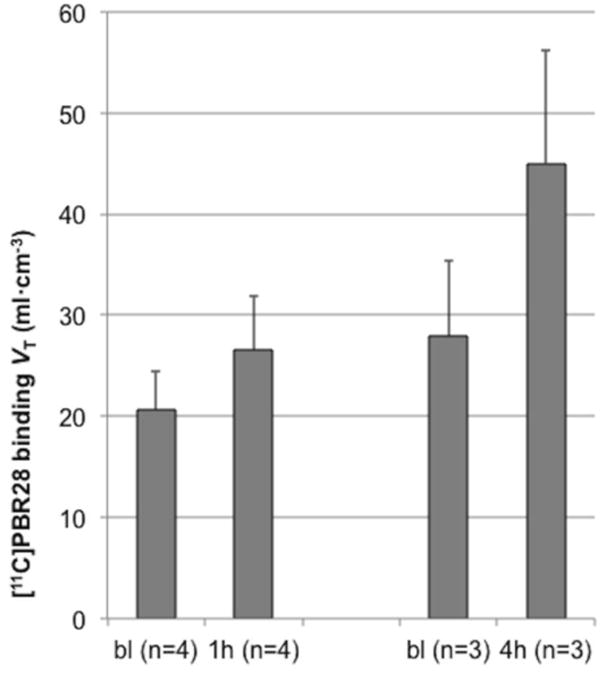
Mean change in [11C]PBR28 binding (VT) after LPS administration. In this figure the mean of each set of scans (1h and 4h post-LPS) is compared to their respective baseline means. One hour post-LPS (n = 4), [11C]PBR28 binding increased 28.8±15.7% (range 11.5%-47.4%). Four hours post-LPS (n = 3), [11C]PBR28 binding increased 61.8±34.4% (range 35.6%-100.7%). Error bars denote standard deviation. Abbreviations: bl, baseline; VT, total volume of distribution.
Fig. 4.
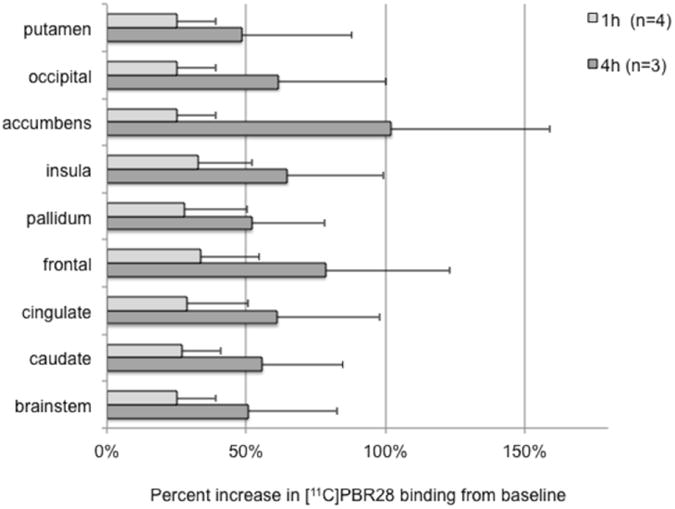
Percent increase in binding from baseline in each region of interest (ROI). The light gray bars show mean (n = 4) percent increase from 0h to 1h in each ROI, while the dark gray bars show mean (n = 3) percent increase from 0h to 4h. Error bars denote standard deviation.
3.3 Correlational analysis
There was a positive correlation between IL-1β levels at 2h and the peak increase in [11C]PBR28 binding from baseline (Pearson's: r = .875, p = .023). There was a positive correlation between IL-6 levels at 3h and the increase in [11C]PBR28 binding from baseline to 4h (r = .998, p =.044). There was a trend positive correlation between TNFα levels at 3h and the increase in [11C]PBR28 binding from baseline to 4h (r = .985, p =.11). There were no significant correlations between IL-8 levels and changes in binding.
3.4 Effects of LPS on [11C]PBR28 metabolism
[11C]PBR28 was rapidly metabolized: for the baseline scans (n = 6) the unchanged fraction (“parent fraction”) was 60±5%, 19±5% and 7±1% at 8, 30 and 90 min after tracer injection, respectively (see Supplementary Table 4 for all timepoints). Metabolism and clearance of PBR28 were affected by LPS administration: Whole-blood and plasma TACs increased after LPS administration, and the parent fraction was lower after LPS administration than during the baseline scans. For example, 30 minutes after tracer injection, the parent fraction was 19±5% at baseline and 11±5% (n = 4) 90 minutes after LPS administration (See Supplementary Table 4 for all parent fraction data). These effects of LPS on the availability of the [11C]PBR28 are corrected for in the compartmental analysis, therefore, the binding (VT) measurements reported here reflect only brain changes and are independent of these peripheral effects.
3.5 Immunohistochemistry
In one baboon euthanized 6h after LPS administration, cells that were immunoreactive (IR) for the antibody against TSPO were almost exclusively small, rod-like cells with short or no visible processes (Figs. 5A-B, Supplementary Fig. 4A-F). These cells were very similar in morphology, size, and distribution to CD68 IR cells (Fig. 5D and 5E), suggesting that they were microglia. Conversely, GFAP IR cells (astrocytes) were larger, much more abundant, and had more numerous and longer processes (Fig. 5C and 5F). CD68 IR cells were found both inside the brain parenchyma and around blood vessels (Supplementary Fig. 5A), while CD163 IR cells were limited to intra- and perivascular areas (Supplementary Fig. 5B). CD163 IR cells were round with cytoplasmic granules, that is, different in morphology from the cells inside the brain parenchyma that expressed CD68 and TSPO. In rare instances, TSPO IR cells were seen in perivascular areas; these cells were round and granular, similar to CD163 IR cells (Supplementary Fig. 5C). Weak expression of PGP 9.5 was found in neurons, which were not TSPO IR (data not shown). Thus, TSPO immunoreactivity occurred almost exclusively in microglia, but not in astrocytes or neurons.
Fig. 5.

Immunohistochemistry from the frontal lobe of one baboon that was killed 6h after LPS administration (immediately after the end of the 4h-post-LPS scan). Cells immunoreactive for TSPO (A, B) were small, rod-like cells with fine branches that were similar to cells immunoreactive for the microglial marker CD68 (D, E). Conversely, immunoreactivity for the astrocytic marker GFAP (C, F) was found cells that were much larger, more numerous, and that had more prominent processes. Scale bar = 100 μm.
4. Discussion
Using PET imaging, we show for the first time that systemic inflammation is associated with increased binding (VT) of the TSPO ligand [11C]PBR28 in the brain of nonhuman primates. The increase in [11C]PBR28 binding indicates that systemic inflammation induced by LPS is associated with an acute increase in TSPO expression. The results are in line with postmortem studies which demonstrate that systemic LPS administration or sepsis causes microglial activation in rodents (Qin et al. 2007; Semmler et al. 2008) and humans (Lemstra et al. 2007).
The increase in [11C]PBR28 binding 4h after LPS administration correlated with serum IL-1β levels at 2h and with IL-6 and TNFα levels at 3h. LPS administration results in systemic release of these inflammatory cytokines, which signal through receptors on brain endothelial cells (Chakravarty and Herkenham 2005; Dauphinee and Karsan 2006; Gosselin and Rivest 2008) and activate microglia (Qin et al. 2008; Semmler et al. 2008). Because LPS is eliminated rapidly from the circulation after IV administration in baboons (Haudek et al. 2003), it is likely that the effect of LPS on TSPO expression in the brain is mediated by LPS-induced inflammatory cytokines (Haudek et al. 2003).
In postmortem samples from one animal, TSPO IR cells were morphologically very similar to those that expressed the microglial/macrophage marker CD68, and very different from astrocytes, suggesting that increased microglial expression of TSPO likely accounts for most of the increase in [11C]PBR28 binding observed after LPS administration. Cells that expressed TSPO and CD68 were rod-like and mostly devoid of branching processes, which is consistent with the morphology of activated microglia (Glenn et al. 1992). Rarely, TSPO IR cells were found adjacent to blood vessels with a morphology similar to CD163 IR cells. This suggests that TSPO is also expressed in perivascular macrophages and/or that some TSPO expression may have been due to infiltration of monocytes from the circulation. CD163 IR cells were never observed inside the brain parenchyma, and the number of TSPO IR cells inside the brain parenchyma far outnumbered perivascular TSPO IR cells. This indicates that the increase in TSPO expression measured with PET was not largely due to infiltrating monocytes or perivascular macrophages. Lastly, no signs of blood-brain barrier disruption were observed. This is consistent with data from humans, in whom a comparable dose of LPS does not cause a measurable disruption of the blood-brain barrier (van den Boogaard et al. 2010).
The four-fold individual variation in baseline [11C]PBR28 binding (range: 10.3-43.9 ml •cm−3) may indicate either differences in baseline levels of TSPO expression or individual differences in the affinity of [11C]PBR28 for TSPO, a phenomenon which occurs in humans due to a polymorphism in the TSPO gene (Owen et al. 2011). Whether this polymorphism occurs in nonhuman primates is not know, and we are not aware of baboons or other nonhuman primates that are non-binders (as occurs in humans homozygous for the minor allele of this polymorphism). The individual variation in the LPS-induced increase in [11C]PBR28 binding (range: 11.5%-47.4% at 1h and 35.6%-100.7% at 4h) may point to individual differences in the susceptibility of microglia to a systemic inflammatory stimulus. Because all but one animal were very similar in age (range 5-7 years), we could not determine any effects of age on the microglial susceptibility to systemic inflammation. The variability in microglial response within a group of animals of a similar age is consistent with data from young, healthy human subjects, in whom LPS-induced systemic inflammation can have highly variable effects on behavior (Hannestad et al. 2011) and on brain glucose metabolism (Hannestad et al. 2012). Based on the cytokine and physiologic response, the LPS dose used here (0.1 mg/kg) is comparable to a 2-4 ng/kg dose in humans (Haudek et al. 2003), a dose that does not cause any detectable cognitive impairment in healthy subjects (van den Boogaard et al. 2010). This is consistent with studies showing that systemic inflammation causes cognitive impairment mainly in older individuals and in those whose brain is more susceptible to inflammatory insults, e.g. individuals with mild cognitive impairment (Cunningham 2011).
It is notable that this dose of LPS causes an increase in microglial expression of TSPO in baboons, while the equivalent dose of LPS in healthy human subjects does not cause disruption of the BBB or any detectable changes in cognition. This suggests that acute systemic inflammation can have subtle effects on microglia, which do not result in measurable cognitive or other behavioral effects. Whether the effects of LPS on non-cognitive brain functions such as motivation and fatigue are mediated by microglial activation, remains to be determined. A key clinical question is whether subtle effects of acute or chronic systemic inflammation on the activation state or cytokine phenotype of microglia play a role in the well-known deleterious effects of systemic inflammation on diseases such as Alzheimer's dementia, multiple sclerosis, and stroke.
One drawback of [11C]PBR28 in humans is that approximately 3.4% of the population will have no binding of this radiotracer and approximately 30% will have low binding, due to a substitution polymorphism in the TSPO gene (Owen et al. 2011). Although several other TSPO radiotracers are available (Rupprecht et al. 2010), this polymorphism affects binding to all these radiotracers, with the exception of [11C]PK11195. Genotyping can be used to screen out non-binders and low binders, and TSPO radiotracers then be used to characterize the effects of systemic inflammation on the brain in human subjects, in efforts to develop and monitor the effects of novel neuroprotective and anti-inflammatory drugs.
This study has several limitations. The sample size is small and this is therefore a preliminary study; however, the within-subject design is a significant strength, as is the consistency of the response to LPS, i.e. that each animal tested had an increase in [11C]PBR28 binding at 1h and 4h. Further, due to the variability in [11C]PBR28 VT across animals, a within-subject design is critical.
For the postmortem data, because double immunostaining was not performed it is possible that TSPO and CD68 expression occurred in different cell types, or that TSPO expression occurred in astrocytes in addition to microglia.
In one of the two animals with follow-up PET at 22h after LPS, [11C]PBR28 binding returned to baseline, whereas in the other animal binding decreased 42.7% below baseline. This may be an effect of prolonged isoflurane anesthesia because isoflurane inhibits microglial responses to LPS (Xu et al. 2008; Kim et al. 2009). Ketamine, which was used for induction, also has anti-inflammatory effects, including the inhibition of LPS binding to LPS-binding protein (which is required for subsequent LPS signaling in immune cells) and inhibition of Toll-like receptor 4 signaling (Wittebole et al. 2010), the receptor that mediates the effect of LPS on immune cells. Even though ketamine was administered at least 3h before LPS, due to the 2-3h half-life (Haas and Harper 1992), it is possible that ketamine may have inhibited the systemic and/or brain inflammatory response to LPS. It is also possible that isoflurane inhibited the effect of LPS on microglia and TSPO expression. If this is the case, however, one would expect an even more pronounced increase in [11C]PBR28 binding after LPS in the absence of ketamine and/or isoflurane.
5. Conclusions
This study shows that: (1) systemic administration of LPS is associated with an increase in binding (VT) of the TSPO radiotracer [11C]PBR28, (2) the increase in binding may be mediated by inflammatory cytokines, and (3) TSPO expression occurred mostly in microglia. This is the first study to show that an LPS-induced increase in TSPO expression can be detected in vivo with PET in baboons, whose brains and immune systems are very similar to those of humans. These findings have important implications for brain diseases in which systemic inflammation contributes to progression and worsening, e.g. Alzheimer's disease, mild cognitive impairment, multiple sclerosis, stroke, and possibly depression (Teeling and Perry 2009). Future studies are needed to confirm whether TSPO expression increases in humans after LPS administration or in the context of systemic diseases with an inflammatory component, and whether changes in TSPO expression correlate with inflammation-associated brain dysfunction.
Supplementary Material
Highlights.
PET imaging was used to detect microglial activation after lipopolysaccharide administration.
Systemic inflammation led to increased [11C]PBR28 binding in the brain.
The increase in binding correlated with blood levels of inflammatory cytokines.
The effect of systemic inflammation on microglia can be detected with PET imaging.
This is relevant to brain diseases in which systemic inflammation affects disease progression.
Acknowledgments
The Department of the Army (W81XWH-08-2-0701, JH), the Society for Nuclear Medicine (Molecular Imaging Research Grant for Junior Medical Faculty, JH), and NIH (K12DA00167, JH; K01DA020651, KPC) provided funding and/or salary support. The U.S. Army Medical Research Acquisition Activity, Fort Detrick MD 21702-5014 is the awarding and administering acquisition office. The information does not necessarily reflect the position or the policy of the Government, and no official endorsement should be inferred. None of the authors has any potential conflicts of interest. The authors wish to thank Brian Pittman, M.S. for statistical analysis, Nicole DellaGioia, M.S. assistance with data management, and Amos Brooks for his expertise in immunohistochemistry. The authors are also grateful to Janet Morgan, Ph.D. (Roswell Park Cancer Institute) who graciously provided the polyclonal antibody against TSPO.
Abbreviations
- CD
cluster of differentiation
- GFAP
glial fibrillary acidic protein
- IR
immunoreactive
- IL
interleukin
- LPS
lipopolysaccharide
- NMI
normalized mutual information
- TNF
tumor necrosis factor
- TSPO
translocator protein
Footnotes
Publisher's Disclaimer: This is a PDF file of an unedited manuscript that has been accepted for publication. As a service to our customers we are providing this early version of the manuscript. The manuscript will undergo copyediting, typesetting, and review of the resulting proof before it is published in its final citable form. Please note that during the production process errors may be discovered which could affect the content, and all legal disclaimers that apply to the journal pertain.
References
- Batarseh A, Papadopoulos V. Regulation of translocator protein 18 kDa (TSPO) expression in health and disease states. Mol Cell Endocrinol. 2010;327:1–12. doi: 10.1016/j.mce.2010.06.013. [DOI] [PMC free article] [PubMed] [Google Scholar]
- Block ML, Zecca L, Hong JS. Microglia-mediated neurotoxicity: uncovering the molecular mechanisms. Nat Rev Neurosci. 2007;8:57–69. doi: 10.1038/nrn2038. [DOI] [PubMed] [Google Scholar]
- Bower JE. Cancer-related fatigue: links with inflammation in cancer patients and survivors. Brain Behav Immun. 2007;21:863–871. doi: 10.1016/j.bbi.2007.03.013. [DOI] [PMC free article] [PubMed] [Google Scholar]
- Chakravarty S, Herkenham M. Toll-like receptor 4 on nonhematopoietic cells sustains CNS inflammation during endotoxemia, independent of systemic cytokines. J Neurosci. 2005;25:1788–1796. doi: 10.1523/JNEUROSCI.4268-04.2005. [DOI] [PMC free article] [PubMed] [Google Scholar]
- Chan WY, Kohsaka S, Rezaie P. The origin and cell lineage of microglia: new concepts. Brain Res Rev. 2007;53:344–354. doi: 10.1016/j.brainresrev.2006.11.002. [DOI] [PubMed] [Google Scholar]
- Chen SK, Tvrdik P, Peden E, Cho S, Wu S, Spangrude G, Capecchi MR. Hematopoietic origin of pathological grooming in Hoxb8 mutant mice. Cell. 2010;141:775–785. doi: 10.1016/j.cell.2010.03.055. [DOI] [PMC free article] [PubMed] [Google Scholar]
- Cosenza-Nashat M, Zhao ML, Suh HS, Morgan J, Natividad R, Morgello S, Lee SC. Expression of the translocator protein of 18 kDa by microglia, macrophages and astrocytes based on immunohistochemical localization in abnormal human brain. Neuropathol Appl Neurobiol. 2009;35:306–328. doi: 10.1111/j.1365-2990.2008.01006.x. [DOI] [PMC free article] [PubMed] [Google Scholar]
- Cunningham C. Systemic inflammation and delirium: important co-factors in the progression of dementia. Biochemical Society transactions. 2011;39:945–953. doi: 10.1042/BST0390945. [DOI] [PMC free article] [PubMed] [Google Scholar]
- Dauphinee SM, Karsan A. Lipopolysaccharide signaling in endothelial cells. Lab Invest. 2006;86:9–22. doi: 10.1038/labinvest.3700366. [DOI] [PubMed] [Google Scholar]
- Davies NW, Sharief MK, Howard RS. Infection-associated encephalopathies: their investigation, diagnosis, and treatment. J Neurol. 2006;253:833–845. doi: 10.1007/s00415-006-0092-4. [DOI] [PubMed] [Google Scholar]
- DellaGioia N, Hannestad J. A critical review of human endotoxin administration as an experimental paradigm of depression. Neurosci Biobehav Rev. 2010;34:130–143. doi: 10.1016/j.neubiorev.2009.07.014. [DOI] [PMC free article] [PubMed] [Google Scholar]
- Denes A, Humphreys N, Lane TE, Grencis R, Rothwell N. Chronic systemic infection exacerbates ischemic brain damage via a CCL5 (regulated on activation, normal T-cell expressed and secreted)-mediated proinflammatory response in mice. J Neurosci. 2010;30:10086–10095. doi: 10.1523/JNEUROSCI.1227-10.2010. [DOI] [PMC free article] [PubMed] [Google Scholar]
- Dowlati Y, Herrmann N, Swardfager W, Liu H, Sham L, Reim EK, Lanctot KL. A meta-analysis of cytokines in major depression. Biol Psychiatry. 2010;67:446–457. doi: 10.1016/j.biopsych.2009.09.033. [DOI] [PubMed] [Google Scholar]
- Fabriek BO, Van Haastert ES, Galea I, Polfliet MM, Dopp ED, Van Den Heuvel MM, Van Den Berg TK, De Groot CJ, Van Der Valk P, Dijkstra CD. CD163-positive perivascular macrophages in the human CNS express molecules for antigen recognition and presentation. Glia. 2005;51:297–305. doi: 10.1002/glia.20208. [DOI] [PubMed] [Google Scholar]
- Girard TD, Jackson JC, Pandharipande PP, Pun BT, Thompson JL, Shintani AK, Gordon SM, Canonico AE, Dittus RS, Bernard GR, Ely EW. Delirium as a predictor of long-term cognitive impairment in survivors of critical illness. Crit Care Med. 2010;38:1513–1520. doi: 10.1097/CCM.0b013e3181e47be1. [DOI] [PMC free article] [PubMed] [Google Scholar]
- Glenn JA, Ward SA, Stone CR, Booth PL, Thomas WE. Characterisation of ramified microglial cells: detailed morphology, morphological plasticity and proliferative capability. J Anat. 1992;180(Pt 1):109–118. [PMC free article] [PubMed] [Google Scholar]
- Gosselin D, Rivest S. MyD88 signaling in brain endothelial cells is essential for the neuronal activity and glucocorticoid release during systemic inflammation. Mol Psychiatry. 2008;13:480–497. doi: 10.1038/sj.mp.4002122. [DOI] [PubMed] [Google Scholar]
- Haas DA, Harper DG. Ketamine: a review of its pharmacologic properties and use in ambulatory anesthesia. Anesth Prog. 1992;39:61–68. [PMC free article] [PubMed] [Google Scholar]
- Hannestad J, DellaGioia N, Ortiz N, Pittman B, Bhagwagar Z. Citalopram reduces endotoxin-induced fatigue. Brain Behav Immun. 2011;25:256–259. doi: 10.1016/j.bbi.2010.10.013. [DOI] [PMC free article] [PubMed] [Google Scholar]
- Hannestad J, Subramanyam K, Dellagioia N, Planeta-Wilson B, Weinzimmer D, Pittman B, Carson RE. Glucose Metabolism in the Insula and Cingulate Is Affected by Systemic Inflammation in Humans. J Nucl Med. 2012 doi: 10.2967/jnumed.111.097014. [DOI] [PMC free article] [PubMed] [Google Scholar]
- Haudek SB, Natmessnig BE, Furst W, Bahrami S, Schlag G, Redl H. Lipopolysaccharide dose response in baboons. Shock. 2003;20:431–436. doi: 10.1097/01.shk.0000090843.66556.74. [DOI] [PubMed] [Google Scholar]
- Imaizumi M, Briard E, Zoghbi SS, Gourley JP, Hong J, Fujimura Y, Pike VW, Innis RB, Fujita M. Brain and whole-body imaging in nonhuman primates of [(11)C]PBR28, a promising PET radioligand for peripheral benzodiazepine receptors. Neuroimage. 2008;39:1289–1298. doi: 10.1016/j.neuroimage.2007.09.063. [DOI] [PMC free article] [PubMed] [Google Scholar]
- Iwashyna TJ, Ely EW, Smith DM, Langa KM. Long-term cognitive impairment and functional disability among survivors of severe sepsis. JAMA. 2010;304:1787–1794. doi: 10.1001/jama.2010.1553. [DOI] [PMC free article] [PubMed] [Google Scholar]
- Kim JA, Li L, Zuo Z. Delayed treatment with isoflurane attenuates lipopolysaccharide and interferon gamma-induced activation and injury of mouse microglial cells. Anesthesiology. 2009;111:566–573. doi: 10.1097/ALN.0b013e3181af5b3d. [DOI] [PMC free article] [PubMed] [Google Scholar]
- Lemstra AW, Groen in't Woud JC, Hoozemans JJ, van Haastert ES, Rozemuller AJ, Eikelenboom P, van Gool WA. Microglia activation in sepsis: a case-control study. J Neuroinflammation. 2007;4:4. doi: 10.1186/1742-2094-4-4. [DOI] [PMC free article] [PubMed] [Google Scholar]
- McNally L, Bhagwagar Z, Hannestad J. Inflammation, glutamate, and glia in depression: a literature review. CNS Spectr. 2008;13:501–510. doi: 10.1017/s1092852900016734. [DOI] [PubMed] [Google Scholar]
- Owen DR, Yeo AJ, Gunn RN, Song K, Wadsworth G, Lewis A, Rhodes C, Pulford DJ, Bennacef I, Parker CA, Stjean PL, Cardon LR, Mooser VE, Matthews PM, Rabiner EA, Rubio JP. An 18-kDa Translocator Protein (TSPO) polymorphism explains differences in binding affinity of the PET radioligand PBR28. J Cereb Blood Flow Metab. 2011 doi: 10.1038/jcbfm.2011.147. [DOI] [PMC free article] [PubMed] [Google Scholar]
- Ponomarev ED, Veremeyko T, Barteneva N, Krichevsky AM, Weiner HL. MicroRNA-124 promotes microglia quiescence and suppresses EAE by deactivating macrophages via the C/EBP-alpha-PU.1 pathway. Nat Med. 2011;17:64–70. doi: 10.1038/nm.2266. [DOI] [PMC free article] [PubMed] [Google Scholar]
- Qin L, He J, Hanes RN, Pluzarev O, Hong JS, Crews FT. Increased systemic and brain cytokine production and neuroinflammation by endotoxin following ethanol treatment. J Neuroinflammation. 2008;5:10. doi: 10.1186/1742-2094-5-10. [DOI] [PMC free article] [PubMed] [Google Scholar]
- Qin L, Wu X, Block ML, Liu Y, Breese GR, Hong JS, Knapp DJ, Crews FT. Systemic LPS causes chronic neuroinflammation and progressive neurodegeneration. Glia. 2007;55:453–462. doi: 10.1002/glia.20467. [DOI] [PMC free article] [PubMed] [Google Scholar]
- Reader AJ, Visvikis D, Erlandsson K, Ott RJ, Flower MA. Intercomparison of four reconstruction techniques for positron volume imaging with rotating planar detectors. Phys Med Biol. 1998;43:823–834. doi: 10.1088/0031-9155/43/4/011. [DOI] [PubMed] [Google Scholar]
- Redl H, Bahrami S. Large animal models: baboons for trauma, shock, and sepsis studies. Shock. 2005;24(1):88–93. doi: 10.1097/01.shk.0000191339.46777.63. [DOI] [PubMed] [Google Scholar]
- Rupprecht R, Papadopoulos V, Rammes G, Baghai TC, Fan J, Akula N, Groyer G, Adams D, Schumacher M. Translocator protein (18 kDa) (TSPO) as a therapeutic target for neurological and psychiatric disorders. Nat Rev Drug Discov. 2010;9:971–988. doi: 10.1038/nrd3295. [DOI] [PubMed] [Google Scholar]
- Semmler A, Hermann S, Mormann F, Weberpals M, Paxian SA, Okulla T, Schafers M, Kummer MP, Klockgether T, Heneka MT. Sepsis causes neuroinflammation and concomitant decrease of cerebral metabolism. J Neuroinflammation. 2008;5:38. doi: 10.1186/1742-2094-5-38. [DOI] [PMC free article] [PubMed] [Google Scholar]
- Slepko N, Levi G. Progressive activation of adult microglial cells in vitro. Glia. 1996;16:241–246. doi: 10.1002/(SICI)1098-1136(199603)16:3<241::AID-GLIA6>3.0.CO;2-4. [DOI] [PubMed] [Google Scholar]
- Tambuyzer BR, Ponsaerts P, Nouwen EJ. Microglia: gatekeepers of central nervous system immunology. J Leukoc Biol. 2009;85:352–370. doi: 10.1189/jlb.0608385. [DOI] [PubMed] [Google Scholar]
- Teeling JL, Perry VH. Systemic infection and inflammation in acute CNS injury and chronic neurodegeneration: underlying mechanisms. Neuroscience. 2009;158:1062–1073. doi: 10.1016/j.neuroscience.2008.07.031. [DOI] [PubMed] [Google Scholar]
- Ulvestad E, Williams K, Mork S, Antel J, Nyland H. Phenotypic differences between human monocytes/macrophages and microglial cells studied in situ and in vitro. Journal of neuropathology and experimental neurology. 1994;53:492–501. doi: 10.1097/00005072-199409000-00008. [DOI] [PubMed] [Google Scholar]
- van den Boogaard M, Ramakers BP, van Alfen N, van der Werf SP, Fick WF, Hoedemaekers CW, Verbeek MM, Schoonhoven L, van der Hoeven JG, Pickkers P. Endotoxemia-induced inflammation and the effect on the human brain. Critical care. 2010;14:R81. doi: 10.1186/cc9001. [DOI] [PMC free article] [PubMed] [Google Scholar]
- van Gool WA, van de Beek D, Eikelenboom P. Systemic infection and delirium: when cytokines and acetylcholine collide. Lancet. 2010;375:773–775. doi: 10.1016/S0140-6736(09)61158-2. [DOI] [PubMed] [Google Scholar]
- Venneti S, Lopresti BJ, Wiley CA. The peripheral benzodiazepine receptor (Translocator protein 18kDa) in microglia: from pathology to imaging. Prog Neurobiol. 2006;80:308–322. doi: 10.1016/j.pneurobio.2006.10.002. [DOI] [PMC free article] [PubMed] [Google Scholar]
- Welty-Wolf KE, Carraway MS, Ghio A, Kantrow SP, Huang YC, Piantadosi CA. Proinflammatory cytokines increase in sepsis after anti-adhesion molecule therapy. Shock. 2000;13:404–409. doi: 10.1097/00024382-200005000-00010. [DOI] [PubMed] [Google Scholar]
- Wittebole X, Castanares-Zapatero D, Laterre PF. Toll-like receptor 4 modulation as a strategy to treat sepsis. Mediators Inflamm. 2010;2010:568396. doi: 10.1155/2010/568396. [DOI] [PMC free article] [PubMed] [Google Scholar]
- Woods RP, Mazziotta JC, Cherry SR. MRI-PET registration with automated algorithm. J Comput Assist Tomogr. 1993;17:536–546. doi: 10.1097/00004728-199307000-00004. [DOI] [PubMed] [Google Scholar]
- Xu X, Kim JA, Zuo Z. Isoflurane preconditioning reduces mouse microglial activation and injury induced by lipopolysaccharide and interferon-gamma. Neuroscience. 2008;154:1002–1008. doi: 10.1016/j.neuroscience.2008.04.013. [DOI] [PMC free article] [PubMed] [Google Scholar]
Associated Data
This section collects any data citations, data availability statements, or supplementary materials included in this article.