

Abstract
Collagen fibrils are believed to control the immediate deformation of soft tissues under biomechanical load. Most extracellular matrix proteins remain intact during frozen sectioning, which allows them to be scanned using atomic force microscopy (AFM). Collagen fibrils are distinguishable because of their helical shape. In the present study, the shape and organization of collagen fibrils in dissected porcine vocal folds were quantified using nonlinear laser scanning microscopy data at the micrometer scale and AFM data at the nanometer scale. Rope-shape collagen fibrils were observed. Geometric characteristics for the fibrils were fed to a hyperelastic model to predict the biomechanical response of the tissue. The model simulates the micrometer-scale unlocking behavior of collagen bundles when extended from their unloaded configuration. Force spectroscopy using AFM was used to estimate the stiffness of collagen fibrils (1 ± 0.5 MPa). The presence of rope-shape fibrils is postulated to change the slope of the force-deflection response near the onset of nonlinearity. The proposed model could ultimately be used to evaluate changes in elasticity of soft tissues that result from the collagen remodeling.
Keywords: Collagen, Helix, Nonlinear laser scanning microscopy, Atomic force microscopy, Strain energy function, Remodeling
1. Introduction
The microstructure of biological soft tissues is composed of extracellular matrix proteins (ECMs) saturated within a fluid medium. The ECMs are composed of fibrous proteins, such as collagen and elastin, entangled in saturated interstitial proteins, such as proteoglycans and glycosaminoglycans. The former group constitutes the backbone structure of the ECMs, enabling it to withstand external forces. The relationship between load and deformation for the ECM structure is typically highly nonlinear. Vocal fold tissue, the focus of the present study, undergoes simultaneous longitudinal extension and self-sustained transverse oscillations along the sagittal plane during phonation [1]. It is hypothesized here that characterization of the tissue microstructure, along with a proper structural model, allows a better prediction of the biomechanical behavior of the vocal folds.
Collagen and elastin are two common sources of intrinsic contrast in nonlinear laser scanning microscopy (NLSM). This method does not require staining or preprocessing and is thus ideal for imaging the ECMs [2]. Second harmonic generation (SHG) has been used to image noncentrosymmetic structures, particularly collagen fibrils [3, 4]. Fibril-forming collagens are highly-ordered helical structures that produce considerable nonlinear light scattering [5]. Two-photon fluorescence (TPF) microscopy has been used to image fluorophores in many biological organs. Elastin fibers have an intrinsically high cross-section for TPF emission [6]. Collagen and elastin in human vocal folds were imaged in a recent study [7].
Collagen fibrils can be easily distinguished from other ECMs in untreated biological tissues based on their periodic roughness wavelength, called D-banding [8]. This parameter is determined by the spiral-shape, helical hierarchy of tropocollagens [9]. Undetectable with NLSM, D-banding can be detected using high-resolution atomic force microscopy (AFM) images. An AFM study of dissected tendons, where identified D-banding, has revealed that individual fibrils may be knitted to form a rope [8]. Based on a differential-geometry model of multi-strand ropes [10], Bozec et al. [8] proved that D-banding can be independent of the fibril diameter, and this conclusion resolved a shortcoming of previous models [11].
The configuration of ECMs defines the structural entropy that controls the elastic energy of soft tissues [12]. The quantification of their configuration allows the development of structural models that could predict the biomechanical behavior in situations where mechanical properties are impossible to measure directly, such as in scar tissue and wound healing. Collagen fibrils appear to determine the elastic response of soft tissues under mechanical load [13]. In one study, a three-dimensional mechanical model of collagen-reinforced materials, in which collagen fibrils are idealized as helical elastic springs, was created for soft tissues [14]. A probability function for collagen waviness was introduced and incorporated into a hyperelastic constitutive model of collagen-reinforced soft tissues [15]. The biophysical interactions between collagen fibrils and non-fibrous ECMs, which were included in the viscoelastic models (e.g., [13]), are omitted here for the sake of conciseness.
Structural characterization over different length scales along with relevant biomechanical studies [9, 15, 16] has been used to model the biophysics of soft tissues. From a histological perspective, the human vocal fold consists of two primary layers: the lamina propria and the vocalis muscle [17]. The ECM structure of the lamina propria is dominated by type I and type III collagen fibrils, with a higher volume fraction of collagen type III [1, 18, 19]. The porcine vocal fold was chosen because it has a structure similar to that of human vocal folds [18, 19].
The goal of the present study is to characterize the contribution of collagen helical hierarchy to the nonlinear elasticity of soft tissues using a structural model. The microstructural morphology of the ECMs in porcine vocal folds was investigated using dual-mode NLSM and AFM imaging. A protocol developed by Miri et al. [7] was used to quantify the helical shape of collagen fibrils, and the stiffness of individual fibrils was obtained using AFM-based nanoindentation. Assuming idealized elastic, multi-strand, rope structures [10], a strain-energy function associated with the unloaded, stress-free configuration of collagen fibrils was formulated. The formulation was applied for the simulation of the uniaxial tension response of a representative volume element of the tissue. The effect of the rope-fibril volume fraction on the force-deflection response was investigated using a numerical analysis.
2. Methods and materials
2.1 Nonlinear laser scanning microscopy
Healthy porcine larynges were obtained from a local abattoir immediately post mortem and immersed in a normal saline solution. The protocol was approved by the Animal Care Committee of the Faculty of Medicine, McGill University. Three adult porcine vocal folds, labeled samples I, II and III, were used for the optical sectioning. The inferior vocal folds were dissected from the larynges by cutting along the sub-glottal wall, the superior vocal folds and the vocalis muscle [20]. A rectangular area of approximately 2 mm × 4 mm was excised with sharp blades from the central region of the vocal folds within the sagittal plane. The thickness of the samples was greater than 2 mm, within the lamina propria. The tissue was embedded in OCT (Optimal Cutting Temperature Compound, Sakura Finetek, Dublin, OH) with no wash or dehydration. It was then sectioned using a cryostat microtome and divided into equal-thickness layers of 100 μm from the epithelium. Each slice was placed between two 22 mm × 22 mm cover glasses. The slides were placed on the NLSM stage for imaging.
A custom-built multimodal, multi-photon microscope was used to record the images [7]. In this study, SHG and TPF emissions were imaged with an excitation wavelength of 1050 nm, in which the laser light was linearly polarized in the horizontal plane. The excitation objective (Carl Zeiss, Toronto, Canada) was a 63x 0.9 numerical aperture (NA) water immersion lens with a 2-mm working distance, and the collection objective was a 20x 0.80 NA water immersion lens with a 0.61-mm working distance. The two sinusoidal parameters Ho and Ro, corresponding respectively to the periodicity and amplitude of fibers and fibrils, were extracted from the NSLM images. The periodicity of selected bundles was determined using Fourier analysis [7]. The overall fiber orientation with respect to the longitudinal axis of the vocal folds was then determined. ImageJ (NIH, Bethesda, MD, USA) was used to calculate the area fraction of collagen fibrils or elastin fibers in each image by imposing a binary threshold after background subtraction [7].
Multimode NLSM allows comparisons between the organizations of soft tissue components that have intrinsic contrast in the images. Networks of collagen fibrils and elastin fibers were simultaneously scanned in the same imaging plane. In a previous study of human vocal folds, a qualitative colocalization analysis was used [7]. Colocalization analysis involves the determination of how much the SHG and TPF signals overlap. A quantitative approach was used in the present study to remove observer bias. Pearson’s correlation coefficient, calculated using ImageJ, quantified the colocalization of the SHG and TPF channels from the intensity covariance in each pixel [21]. To reduce noise, the background intensity of each image was subtracted using a rolling-ball algorithm (ImageJ; NIH, Bethesda, MD, USA). An available randomization approach [21] was selected to calculate the Pearson coefficient and assess its statistical significance. For each pair of images, 25 random images were created by translating horizontally and/or vertically the TPF image in 5-pixel increments (i.e., −10, −5, 0, 5 and 10 pixels). The scrambled images, with a length scale of several micrometers, maintain the characteristic shape of the collagen and elastin features. The Pearson coefficient was calculated for each artificial pair and compared to that of the original pair. The cases selected for the analyses had at least 22 randomizations with Pearson coefficients lower than in the original images. About 20% of the images were eliminated using this criterion.
2.2 Atomic force microscopy
In a separate set of experiments, imaging was performed using an AFM (Multimode Nanoscope IIIa, Veeco, Santa Barbara, CA), equipped with a NanoScope V controller. The AFM images were obtained in both the height and the deflection channels using the contact mode at room temperature. Reflective, gold-coated, sharp silicon nitride micro-cantilevers (MSNL-10, 0.1–0.6 N/m; Bruker, Camarillo, CA) were used for high-resolution imaging of sectioned tissue layers in air, at room temperature. Gold-coated silicon nitride micro-cantilevers (NPG-10, 0.35 N/m; Bruker, Camarillo, CA) were used for nanoindentation tests on tissue samples immersed in a phosphate buffer saline with pH = 7.6, to simulate physiological conditions [22].
The deflection sensitivity of the piezoelectric transducer was measured by probing the hard surface of the glass substrates. This procedure could have affected the curvature of the probe tip, thus the tip radius was determined via scanning electron microscopy, as shown in Fig. 1a. The sphericity of the head of the conical tip was obtained using a regression, and was found to have a 75 nm radius. The spring constant of the tips was measured using a thermal tuning method [23]. Most cantilevers remain linear up to a cantilever deflection of 100 nm, as observed in deflection sensitivity curves. The forces measured in the present study were less than ~10 nN and the cantilever deflections were less than ~30 nm. Hence, nonlinear effects were negligible. The optimal cantilever stiffness for a sample can be determined from the assumptions of Hertz contact theory [24]. An effective stiffness value of ~ 0.3 N/m was calculated for nanoindentation testing of collagen fibrils in hydrated conditions [22].
Figure 1.

a) Typical force-deflection curve obtained by AFM-based nanoindentation. Scanning electron microscopy was used to characterize the AFM tip. Scale bar is 5 μm; b) A typical height AFM image for porcine vocal fold superficial layer in which brighter regions exhibit higher height. Scale bar is 1 μm; c) A typical stress-stretch curve of vocal fold tissue samples. The sample, shown with it speckle pattern, was subjected to uniaxial sinusoidal tension at 1 Hz; d) A dual-mode NLSM image of porcine vocal fold lamina propria, in the sagittal plane. e) Anatomy of porcine hemilarynx. The vocal fold tissue is between the thyroid and arytenoid cartilages. The location of sample excision for imaging is shown.
Thin sections of three porcine vocal folds with thicknesses of 7–10 μm were prepared using a procedure similar to that used for the NLSM. The nanoindentation was performed on collagen fibrils. The force-volume mode produced a map of load-displacement force curves in a 20 pt × 20 pt grid over the surface of the samples, each of which had an area of 20 μm × 20 μm. A rate of two indentation cycles per second was applied, yielding a set of 400 indentation curves. The force-volume mode, with a threshold of 6 nN, yielded unloading force curves, which were used to estimate the elastic tensile modulus as described in Oliver and Pharr [24]. A distribution of the 400 elastic moduli in the selected area was obtained. In addition to zero-stiffness points that correspond to pore spaces, contributions of the tissue-tip adhesion were significant at some points. The corresponding data were then disregarded in the final analysis. The data were imported into MATLAB (The MathWorks, Natick, MA) to obtain the histogram. The values of the elastic moduli associated with data population (i.e., the amplitude of the Gaussian fits) were extracted and the maximum value was considered to be the elastic modulus of a single collagen fibril.
3. Results
Fig. 1 shows an overview of the experimental approach. Fig. 1e shows the location of the vocal fold in a porcine hemilarynx and the area where the samples were extracted. The average stress versus stretch, obtained from uniaxial traction testing of the entire vocal fold [20], is shown in Fig. 1c. The strong nonlinearity of the stress-stretch curve can be associated with interactions of collagen fibrils and other ECMs at large deformations [12]. Fig. 1d shows the merged distributions of elastin (red) and collagen (green) networks obtained from a single NLSM imaging acquisition. The collagen fibrils have a characteristic wavy structure while the elastin network looks like a basket. The AFM image, Fig. 1b, illustrates the nanoscale features of the ECMs, highlighting a higher fibers’ effective size (e.g., the diameter) than for other ECMs of the vocal fold [18, 19]. The nanoindentation curve, obtained from AFM, and the scanning electron microscopy image of the AFM tip used are shown in Fig. 1a.
Selected images of 100μm×100μm regions in the 1st (~ 0–100μm depth), 4th (~ 300–400μm depth), and 7th (~ 600–700μm depth) layers of sample I are shown in Fig. 2. The left column shows the distribution of straight elastin fibers and the right column shows the bundles of crimp-shape collagen fibrils. Variations in the collagen and elastin networks, according to depth, are evident. Highly distributed within the first layer, the elastin network diminishes at greater depths (i.e., closer to the muscle), as seen in the 7th layer. The variation is not an optical sectioning artifact because the imaging was done on separate tissue slices. Fig. 2 also shows that the collagen fibrils are primarily oriented along the longitudinal axis of the vocal fold (i.e., the horizontal axis in the images).
Figure 2.
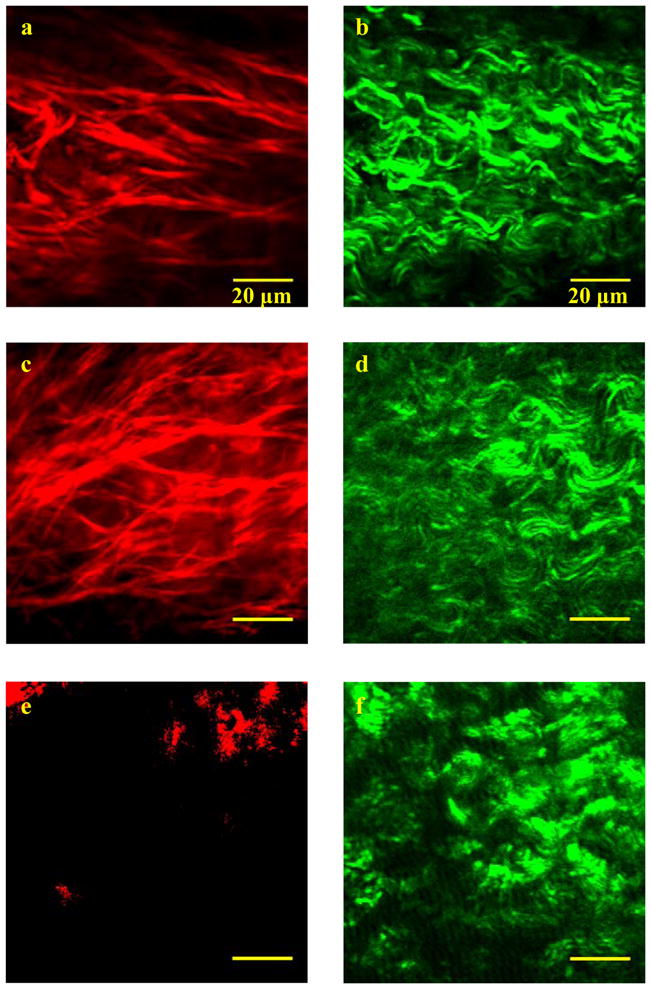
Selected images of TPF (red) and SHG (green) channels for the first (a,b), the fourth (c,d) and the seventh (e,f) 100μm layers in sample I. The excitation wavelength was 1050 nm. The TPF (red) and SHG (green) channels were recorded at 600/50nm and 525/50nm wavelengths. The pixel-resolution of a and b are twice the other images. Scale bar is 20 μm.
The averaged area fractions and associated standard deviations are shown along with Pearson’s correlation coefficients in Fig. 3. The correlation coefficients support the observation that collagen and elastin are more entangled in the first three layers. The periodic, sinusoidal structure of collagen bundles is shown in Fig. 4. Two randomly selected positions for each layer were imaged with NLSM. Ten bundles were selected in each image to calculate the average values of the overall orientation, the wave periodicity and the wave amplitude of the collagen fibrils, as described in Section 2.1.
Figure 3.

Depth distribution of the mean area fraction and its standard deviation for the recorded data, at two random locations in each of three samples, for TPF (red) and SHG (green) channels. Vertical dashed lines indicate separate tissue slices. The depth coordinate was placed in the coronal plane, the epithelium toward the vocalis muscle. Solid red line, TPF area fraction; dashed blue line, SHG area fraction; dotted black line, Pearson correlation coefficient.
Figure 4.

Depth distribution of the mean collagen sinusoidal parameters and its standard deviation, at two random locations in each of three porcine vocal fold samples, based on the Fourier series regression. Vertical dashed lines indicate separate tissue slices. The depth coordinate was placed in the coronal plane, the epithelium toward the vocalis muscle. Solid red line, sample I; dashed blue line, sample II; dotted black line, sample III.
Four thin slices were extracted from each AFM sample, at 100-μm intervals of 0–400 μm depth. Height- and deflection-mode images were recorded at three randomly chosen regions per sample. The collagen fibrils were identified from D-banding. Careful examination of the bundles led to the identification of two distinct collagen distribution patterns, as shown in the first layer of one selected sample (Fig. 5). The left column (Fig. 5a) shows freely distributed single collagen fibrils, which are less integrated than other ECM biopolymers. These were observed in all of the samples. The right column (Fig. 5b) shows rope-shape collagen fibrils, with their notable helical angle and ply radius, found mostly near the epithelium, at depths of 0–200 μm. Nanoindentation was also performed on several fibril-like objects by the AFM and the map of the elastic modulus was calculated. A regression of the normal Gaussian distribution with the moduli yielded three major peaks in most cases, one of which is presented in Fig. 6. Based on the range of collagen modulus in the literature [22], the first peak was attributed to non-collagenous ECMs, including elastin, while two higher peaks were associated with the collagen fibrils. The normal probability function was defined as
Figure 5.
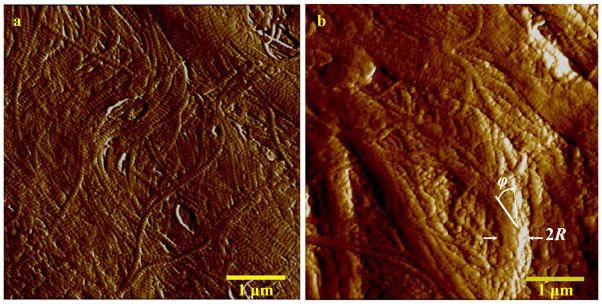
Selected images of single fibrils (a) and rope-like fibrils (b) imaged by AFM, at a depth of 0–100 μm. Scale bar is 1μm. The ply radius, R, and the helical angle, ϕ, are shown in the right image.
Figure 6.
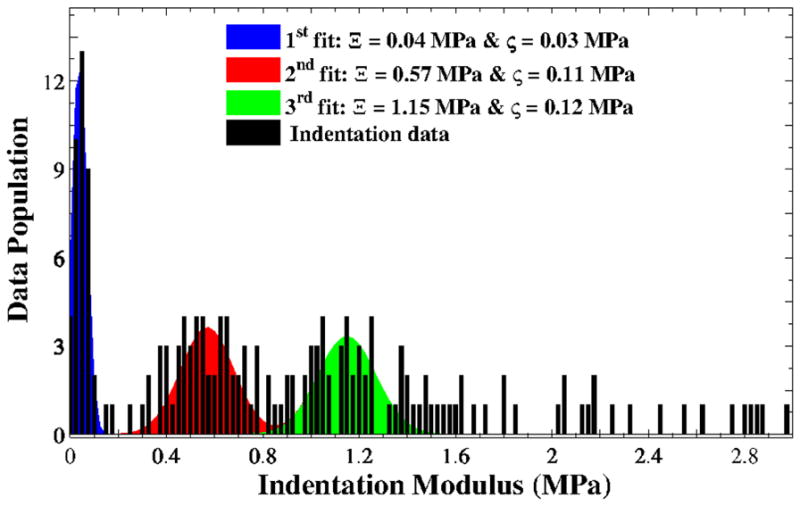
Distributions of data population versus indentation modulus E from nanoindentation of a vocal fold tissue sample; blue curve for the first fit corresponding to non-collagenous ECMs; red curve for the second fit associated with collagen fibrils type III; green curve as the third fit associated with collagen fibrils type I; black bars for the indentation moduli. A combination of the second and third Gaussian distributions was considered as the stiffness of collagen fibrils.
| (1) |
with Ξ and ζ indicating the mean and the standard deviation of the indentation modulus E. Using this approach, the indentation moduli of the collagen fibrils were obtained. Two data sets were averaged to obtain one range of moduli for vocal fold samples. The overall results were found to vary from 0.5 to 1.5 MPa.
4. Theoretical model
4.1 A hyperelastic model of collagen-reinforced composites
From an engineering perspective, soft tissues are composite structures composed of elastin and collagen fibers immersed in hydrated gel-like proteoglycans. Disregarding the effects of viscosity, the tissue hyperelastic model is based on the definition of the strain-energy function [15], that is the Helmholtz free-energy when the tissue is subjected to isothermal deformation. In-vitro experiments in constant-temperature media are commonly performed for soft tissues [20, 25]. The strain-energy density function, Ψ, denotes the elastic energy stored in the deformed tissue per unit volume [26]. It is a function of
| (2) |
where each variable, λi, represents the principal stretch along the ith global coordinate (Fig. 7a). By analogy with engineered fiber-reinforced composites, non-fibrous ECMs supply the matrix phase and fibrous ECMs constitute the reinforcing fibers. An additive formulation [26], which assumes affine deformation of all components, expresses the strain-energy function as
Figure 7.

a) Schematic representation of an area of interest imaged by NLSM and a selected single helical fibril with its regression function. b) Schematic of a four-strand rope model.
| (3) |
in which Ψm denotes the isotropic energy of the non-fibrous proteins, Ψf denotes the anisotropic energy of the fibrous proteins, which occupy a volume fraction of φf.
In vocal fold tissue, the elastin network is generally distributed along random directions (Figs. 1c and 2). Any possible variation in model parameters along the thickness direction is neglected here because the loading is planar along the sagittal plane [20]. Thus, the anisotropic energy, Ψf in Eq. (3), was expanded as
| (4) |
where Ψc denotes the direction-dependent strain-energy function stored by collagen fibrils occupying a volume fraction φc, and Ψe denotes the strain-energy contributed to the elastin fibers. In unloaded tissue samples, collagen fibrils formed a wavy structure with regular sinusoidal characteristics. Collagen fibrils of vocal folds seem to be predominantly oriented along the anterior-posterior direction [7]. An anisotropy vector, a, and the associated probability density function, PO(θ, φ), were thus introduced, where θ and φ are the azimuthal and circumferential angles (Fig. 7a). The collagen strain-energy function is expressed inspherical coordinates as
| (5) |
where Ψfibril is the energy function of one single fibril, and λf is the stretch along a (θo, φo) [15], which depends on the principal stretches and the orientation vector (θo, φo). A bisymmetric unimodal distribution function was used to describe the anisotropic spatial distribution of collagen fibrils.
The microscale crimp-shape distribution of collagen fibrils was modeled as a planar sinusoidal curve (Fig. 7a). The infinitesimal arc-length, dl, of one single collagen fiber lying along the x-axis with a length of L, and lying within the yz plane, is expressed as
| (6) |
where ℓ is a random variable, which has a non-normal distribution in the y- and z-directions with a non-zero mean value. A normal Gaussian distribution, with a non-zero mean value, was assumed for the length probability function
| (7) |
in which ℓ̄ and Ω2 are the mean value and variance, respectively, as estimated from the NLSM images. The integration of Eq. (6) along the length of the fibril yields ℓ̄. For a fixed ℓ, the effective stretch of the fibril is then obtained as
| (8) |
For convenience, Ψm (λi) and Ψe (λi) were modeled using a Neo-Hookean material model [26] having shear stiffnesses μm and μe. When a representative cubic block of the tissue is subjected to a uniaxial extension, λ, the Cauchy stress in the direction of loading (i.e., at θ = 0 and φ = π/2) is obtained from [15]
| (9) |
where I1 (= λ2 + 2/π) is a strain invariant. The uniaxial traction test data were obtained from the experiments of a previous, related study [20]. The measured stress-stretch response of one vocal fold sample is shown in Fig. 1c.
4.2 A rope-shape model of collagen fibrils
Following the model suggested by Bozec et al. [8] for sub-fibrillar length scales, we assumed that collagen fibrils coil around each other to form a rope-like ply with a right-handed helical shape at the micrometer length scale. The ply shape might be the result of an incomplete self-assembly of smaller fibrils. Two distinct types of fibrils were thus identified, which suggests a strain-energy function of the form
| (10) |
in which represents the strain energy function for single fibrils, considered as elastic rods, and represents the strain energy function for rope-shape fibrils, with volume fraction φply. A rope is assumed to have n strands, forming a cylinder of radius, R, with helical angle, ϕo, which is the complement of the pitch angle (Figs. 5b and 7b). The detailed derivation of the strain-energy function of a single rope-shape fibril is presented in Appendix A. The strain-energy function is then considered to have a quadratic form, similar to the second part of , as in Eq. (A.7).
4.3 Application to vocal folds lamina propria
Because of its importance for voice production, the lamina propria at a depth of about 0.5 mm [18, 19] was the focus of this study. The representative element is assumed to be homogenous and non-isotropic, with an anisotropy vector in the range 0° ≤ θo ≤ 90°. The sinusoidal waveform function was quantified, as shown in Fig. 4, and image analysis was used to calculate ℓ̄ and Ω by computing the arc-length of y = Ro sin(2πx/Ho). The overall orientation, θo, was also imposed with a probability density function, PO (θ, φ,), assuming φo = π/2 (i.e., planar loading). A modified von Mises distribution function was used,
| (11) |
where I0(κ) is the modified Bessel function, and κ is the concentration parameter. Eq. (11) satisfies the normalization condition. The volume fraction of fibrous proteins, φf, and the volume fraction of collagen, φc, were deduced from histological data [18, 19].
The geometric parameters of rope-shape fibrils were estimated from the AFM images (Fig. 5). The helical angles and the ply radii were measured in the images, using NanoScope Analysis 1.4 (Veeco, Santa Barbara, CA). The data are summarized in Table 1. Volume fraction values, φply, of 0.30 and 0.70 were assumed in the calculations. Collagen fibrils play a negligible role for small deformation. The strain-energy function related to matrix and elastin is described by a single constant, which was identified from the linear portion of stress-stretch curves [25]. Assuming equal stiffness, the corresponding shear moduli were obtained as μm = μe = 15×103 Pa. Eq. (9) calculates the Cauchy stress of a uniform cubic element subjected to uniaxial loading. For a representative volume element, Eq. (9) was used to calculate stress versus axial stretch. A script written in MATLAB (The MathWorks, Natick, MA) was used to calculate the stress for two values of the moment of anisotropy, κ, and the rope-fibril volume fraction, φply, as shown in Fig. 8.
Table 1.
Geometrical and mechanical parameters for the collagen fibrils used in the present model for (m = 3) porcine vocal fold tissues, within the depth of 0–0.4 mm.
| Parameter | φf | φc | θo | E(N.m−2) | Kb/t(N.nm2) | r(nm) | n | ϕo |
|---|---|---|---|---|---|---|---|---|
|
| ||||||||
| Mean value & standard deviation | 0.601 ± .002 | 0.875 ± .002 | 7.51° ± 7.02° | 1×10⁶ ± 5×10⁵ | 0.97×10⁻⁹ | 111 ± 34 | 8.7 ± 3.8 | 25.8° ± 12.4 |
Figure 8.

Distributions of axial stress σ versus axial stretch λ for a representative block material of the tissue, obtained by Eq. (9); dot-dashed black line for a case of collagen-free material model, Ψfibril = 0; dotted red line for κ = 0.05 and φply = 0.30; dashed blue line for κ = 0.05 and φply = 0.70; solid green line for κ = 1.05 and φply = 0.70. See also Eq. (10) Eq. (11). The distribution from the free-length probability function in Eq. (6) is also shown using a pink line. The black arrows show the initiation of the second-order parabolic response.
5. Discussion
5.1 Spatial distributions of collagen and elastin networks
As illustrated in Figs. 1b and d, NLSM and AFM methods were used to image vocal fold tissue for the development of a strain energy formulation that considers the collagen helical hierarchy. The spatial distribution of ECMs in unloaded and untreated tissue slices defines the stress-free-microstructure. The elastin fibers are more isotropic than collagen fibrils in a planar distribution (i.e., the sagittal plane). This observation supports the hypothesis of the isotropic contribution of the elastin network to the strain-energy function, and it substantiates the poor colocalization of SHG and TPF signals. Comparisons between the fibrous structure seen in Fig. 1d and non-fibrous ECMs in Fig. 1b suggest that fibrous proteins are the dominant structure at the micrometer scale in terms of mechanical resistance while other ECMs play a more effective role at smaller scales. The cellular components are not included in the present study because of the composition of the lamina propria [1].
The collagen and elastin networks are more organized near the superficial layer, as shown in Figs. 2a and 2b, than in the deep layer of the lamina propria, as shown in Figs. 2c and 2d. In the muscle (Figs. 2e and 2f), the elastin fibers disappear and the collagen network is rather isotropic, in consistency with histological data [18, 19]. Human vocal folds have regularly oriented collagen and elastin networks [7] while the porcine vocal fold lamina propria has a more randomly distributed structure. These differences suggest distinct mechanical properties. The phonatory function of vocal folds requires an integrated, unidirectional network of collagen and elastin. A similar waviness seen in Fig. 2 was observed in collagen fibrils taken from intact vocal folds fixed in formaldehyde [7], which shows that the crimp shape of the collagen fibrils is not caused by tissue preparation.
Signal area fractions that represent the layer-wise distribution of collagen and elastin fibers, are shown in Fig. 3. The TPF signal strength was nearly uniform down to a depth of 0.6 mm, beyond which it significantly decreased in the vocal muscle [19]. The SHG signal has a high magnitude below the epithelium and then becomes uniform at varying depths, all the way down to the muscle. The collagen within the superficial layer, immediately below the epithelium, is oriented parallel to the surface, causing an increased SHG signal (Fig. 2b). Fig. 3 confirms the homogeneity of the lamina propria in porcine larynges and substantiates the use of a homogeneous model. The human vocal fold lamina propria, in contrast, is multilayered [18, 19], which requires more elaborate modeling.
Insight into the interactions between collagen and elastin networks is provided by SHG and TPF images (Fig. 3). The Pearson’s correlation coefficient, in general, ranges from −1 to +1, with +1 indicating perfectly correlated objects. A positive number was expected as collagen and elastin fill the entire space, but the correlation decreased beyond a depth of ~ 0.4 mm. The Pearson’s coefficient was found to vary between ~ 0.12 and ~ 0.50 for the porcine lamina propria. Qualitative colocalization, based on observation, however, may indicate a lower correlation for porcine tissue than for human tissue [7]. This criterion cannot offer a rigorous comparison because the fibrous structures are vector-valued, curvilinear objects.
5.2 Structural characterization of collagen fibrils at two length scales
A sinusoidal regression curve (Fig. 7a) was used to extract the periodicity and orientation of collagen fibrils. The lamina propria (< 0.5 mm) has a uniform distribution of parameters with respect to the muscle. For a depth of 400 μm, the measured amplitude and periodicity were Ro = 3.08 ±1.01 μm and Ho = 20.62 ±7.43 μm, respectively. The free length of the fibrils (i.e., after uncurling) was then computed and used in the simulation. Referring to Fig. 4, the dominant orientation was around zero degrees, with a lower variance in the regions close to the epithelium. The estimated threshold stretch, where the collagen network dominates the stretch-stress response, was 1.19 ± 0.08. This value was implemented in the free-length probability function shown in Eq. (7) to generate Fig. 8.
Because surface scanning using AFM can suffer from cutting artifacts, the high-intensity regions of the height-mode images were eliminated. The compliance of vocal fold tissue prevented AFM imaging in hydrated conditions; however, tissue dehydration may have affected the imaging. The images revealed two types of collagen fibrils: single and rope-shape. Two porcine samples taken from intact vocal folds, and fixed in formaldehyde, were also imaged by AFM as control experiments. Similar patterns were observed. Insignificant physical integrations between single fibrils and other ECM macromolecules were observed in the AFM images. The rope-shape fibrils were better integrated with non-fibrous ECMs, a characteristic of type I collagen [12], which suggests that rope-shape fibrils may fall into this category. Models based on the additive decomposition of material elastic energy (Eq. (4)) appear incapable of representing this group of collagen fibrils.
5.3 Biomechanics of collagen-reinforced soft tissues
The technical difficulty involved in in-situ measurements necessitates a multiscale, structural model that can predict the stiffness of tissue from that of individual components, such as collagen fibrils. The AFM-based indentation (Fig. 1a) offers a mechanical characterization tool at the nanometer scale. It was used along with statistical analysis to estimate the stiffness of collagen fibrils (Fig. 6). The indentation elastic modulus may be influenced by the soft microstructure underneath the collagen fibril being indented. However, collagen stiffness on the order of GPa, which was reported for dehydrated samples [22], seems large for vocal folds.
The present formulation assumes affine deformation between collagen fibrils and other ECMs (Eq. (4)). The mechanical resistance contributed by collagen fibrils is a result of their natural stiffness and the loose cross-linking between collagen fibrils and other ECMs. Biomechanical aspects of collagen fibrils have been investigated by two approaches [27]. One approach involves isolating and purifying collagen fibrils, and determining their structure and interactions in vitro [28]. The other approach includes measurements of the bulk mechanical properties of collagenous tissues [20], and predictions of collagen stiffness from multiscale models. In contrary to the two approaches, AFM-based nanoindentation of fresh tissue samples allows for biomechanical characterization of a single collagen fiber in its natural configuration.
Mechanical testing results (Fig. 1b) show that the stress vs. stretch response is nonlinear for stretch values greater than around 1.2. The model shown in Eq. (9) may be used to simulate the behavior of a tissue representative volume element, e.g., when comparing Fig. 8 and Fig. 1b. The initial parts of the curves in Fig. 8 (λ < 1.2) belong to collagen-free contributions, highlighting the resistance of non-fibrous ECMs and elastin. The collagen fibrils uncurl with negligible resistance to the loading. A comparison between the curves for different φply’s reveals the region (1.2 < λ < 1.4), where untwisting the rope-shape structures has a great influence on the stiffness (i.e., the tangential modulus). For large stretches where 1.4 < λ, the collagen fibrils act like unlocked free rods and stress-versus-stretch obeys a parabolic relationship. The dispersion of anisotropy, κ, affects the tissue response in this region. The main contribution of the rope structures in the present formulation can be observed as greater slope changes in the region 1.2 < λ < 1.4 for different volume fractions of rope-shape fibrils, φply. The untwisting mechanism controls the transition from the linear response to the nonlinear (i.e., parabolic) response at large stretch values.
The proposed model is based on the idea that some of the elastic energy required to move a fully-extended crimped fiber is used to untwist the fibrils. As a strain-energy theory, the model can simulate the tissue response based on its unloaded configuration. The formulation further enables the derivation of analytical expressions, which can be implemented in a numerical analysis [16] to predict the tissue response for physiologically relevant stress states. The present model has some limitations. The solid mechanics of soft tissues was only considered, assuming no interactions between the solid structure and interstitial fluid. The fluid phase may contribute significantly to the viscoelasticity of the tissue [20]. The evolution of non-collagenous ECMs, particularly elastin fibers, when collagen fibrils undergo deformation was also excluded. Finally, the model does not consider fibril cross-linking (i.e., fibrils did not interact). The mechanisms of ECM remodeling should be investigated in future experiments.
5.4 Implications to collagen remodeling in wound healing and tissue engineering
In contrast with available constitutive models [13, 15, 16], the proposed formulation provides a mathematical framework to study the biomechanical evolution of soft tissues under remodeling or growth. For example, vocal fold scarring that results from the surgical removal of vocal fold lesions and voice abuse is a common problem in voice clinics [29]. Long-term consequences of scarring include tissue remodeling, during which the ECM composition changes over weeks until a mature scar is formed [29]. Collagen fibrils undergo helical self-assembly at different length scales with significant effects on the biomechanical behavior of the tissue.
Many vocal fold lesions are treated by the injection of tissue-engineering biomaterials [23]. Design and fabrication of injectable biomaterials has followed a trial-and-error approach without a good understanding of ECM remodeling (e.g., for the vocal fold tissue [30]). Interaction of collagen fibrils and tissue engineering scaffolds affects ECM remodeling and eventual tissue elasticity. The remodeling process by which the neo-ECM matures into a heterogeneous and anisotropic structure can affect the mechanical stiffness of the tissue in ways that could be modeled using the framework proposed in the present work.
6. Conclusion
The microstructure of porcine vocal fold tissue was visualized using nonlinear laser scanning microscopy (NLSM) and atomic force microscopy (AFM). The results showed the distribution of collagen and elastin networks in label-free fresh tissue slices. The basket-like elastin network and crimp-shape collagen fibrils were imaged by NLSM. Colocalization of collagen fibrils and elastin fibers was negligible in porcine tissue, unlike in previous studies of human vocal folds. Collagen fibrils were identified by their surface D-banding, and their nanoscale features were mapped by AFM. Two distinct fibril constituents were identified: freely-distributed single fibrils and rope-shape fibrils.
The elastic properties of collagen-reinforced soft tissues were investigated using a composite structural model, where the effect of fibril untwisting was included using classical rope mechanics. Nanoindentation with AFM was further applied to estimate the linear modulus of collagen fibrils, which was found to be in the range of 0.5–1.5 MPa. A simple calculation of stress versus stretch revealed the contribution of the collagen helical hierarchy to the nonlinear relation between external loading and tissue deformation. This model can predict the biomechanical behavior of vocal fold tissue, where assembly of the collagen fibrils factors heavily into the remodeling process. The proposed methodology for microstructural characterization and the strain-energy formulation are applicable to other soft fibrous tissues.
Acknowledgments
This work was supported by NCDCD grant R01-DC005788 and Canadian Institutes of Health Research (CIHR). P.W. Wiseman acknowledges Discovery Grant support from the Natural Sciences and Engineering Research Council of Canada (NSERC) and equipment support from the Canadian Foundation for Innovation (CFI). The authors would like to express their greatest gratitude to Prof. François Barthelat (Mechanical Engineering Department, McGill University, Montreal) for sharing his atomic force microscope.
Appendix A
Referring to Fig. 7b, a ply is made of n strands of radius r twisted around each other on a uniform circular cylinder of radius R and infinite extent (i.e., R/Lo ~ 0), a physically motivated assumption. Two geometrical constraints were used in a previous study [10] to obtain perfectly bonded strands. The global reference (x, y, z) is used for defining the external loading and a right-handed orthonormal coordinate frame (e1, e2, e3) is introduced for kinematical analysis. In the case of constant curvature and torsion, the parametric arc-length vector is written as
| (A.1) |
where ϑ(s) = s sinϕ/R and s represents the arc-length and ϕ is the helical angle or the complement of pitch angle (Fig. 7b). The consistency of perfect contact between adjacent strands in a right-handed ply is guaranteed [8] by
| (A.2) |
| (A.3) |
Eq. (A.2) gives δ, a shift parameter, based on known ϕ, and Eq. (A.3) yields the helical radius R. The mechanics of the rope model provide governing equations [10]. When the rope is extended by axial force Fo per unit length of the rope, the equilibrium equation is then
| (A.4) |
where Kb is the bending stiffness and Kt is the torsional stiffness of each strand. Also τ is the axial torsional strain in each strand and may be decomposed as [10]
| (A.5) |
with γ being the internal pretwist, also called Love’s twist, locked during creation of the rope. The second term is τo (≡ sin 2ϕ/2R), the strand twist (Fig. 7b). Although this model neglects some characteristics of deformation in the strands, it is suitable for large deformation [10, 31]. The axial stretch is defined accordingly as λ̄f = cosϕ/cosϕo [10] with ϕo as the balanced helical angle. A convex and coercive strain-energy function (per strand) is a assumed here with a quadratic function of the bending/torsion strains, as shown below [31].
| (A.6) |
The formula above expresses the energy of the ply as far as it is twisted. The pretwist, γ, is computed by imposing Fo = 0 and ϕ = ϕo in (A.4) and (A.5). To generalize the problem, it is further assumed that the strand acts like a single fibril when it is completely straightened. Considering Ē as the axial stiffness, the strain energy function is further modified
| (A.7) |
2 where H(•) is the Heaviside function.
Footnotes
Disclosures
The authors have no conflicts of interest to declare.
Publisher's Disclaimer: This is a PDF file of an unedited manuscript that has been accepted for publication. As a service to our customers we are providing this early version of the manuscript. The manuscript will undergo copyediting, typesetting, and review of the resulting proof before it is published in its final citable form. Please note that during the production process errors may be discovered which could affect the content, and all legal disclaimers that apply to the journal pertain.
Contributor Information
Amir K. Miri, Department of Mechanical Engineering, McGill University, Montreal, QC H3A 0C3, CANADA
Hossein K. Heris, Department of Mechanical Engineering, McGill University, Montreal, QC H3A 0C3, CANADA
Umakanta Tripathy, Physics and Chemistry Departments, McGill University, Montreal, QC H3A 2T8, CANADA.
Paul W. Wiseman, Physics and Chemistry Departments, McGill University, Montreal, QC H3A 2T8, CANADA
Luc Mongeau, Department of Mechanical Engineering, McGill University, Montreal, QC H3A 0C3, CANADA.
References
- 1.Gray SD, Titze IR, Chan RW, Hammond TH. Vocal fold proteoglycans and their influence on biomechanics. Laryngoscope. 1999;109:845–54. doi: 10.1097/00005537-199906000-00001. [DOI] [PubMed] [Google Scholar]
- 2.Zipfel WR, Williams RM, Webb WW. Nonlinear magic: multiphoton microscopy in the biosciences. Nature biotechnology. 2003;21:1369–77. doi: 10.1038/nbt899. [DOI] [PubMed] [Google Scholar]
- 3.Zipfel WR, Williams RM, Christie R, Nikitin AY, Hyman BT, Webb WW. Live tissue intrinsic emission microscopy using multiphoton-excited native fluorescence and second harmonic generation. Proceedings of the National Academy of Sciences of the United States of America. 2003;100:7075–80. doi: 10.1073/pnas.0832308100. [DOI] [PMC free article] [PubMed] [Google Scholar]
- 4.Matteini P, Cicchi R, Ratto F, Kapsokalyvas D, Rossi F, de Angelis M, et al. Thermal transitions of fibrillar collagen unveiled by second-harmonic generation microscopy of corneal stroma. Biophysical Journal. 2012;103:1179–87. doi: 10.1016/j.bpj.2012.07.055. [DOI] [PMC free article] [PubMed] [Google Scholar]
- 5.Williams RM, Zipfel WR, Webb WW. Interpreting second-harmonic generation images of collagen I fibrils. Biophysical Journal. 2005;88:1377–86. doi: 10.1529/biophysj.104.047308. [DOI] [PMC free article] [PubMed] [Google Scholar]
- 6.Zoumi A, Yeh A, Tromberg BJ. Imaging cells and extracellular matrix in vivo by using second-harmonic generation and two-photon excited fluorescence. Proceedings of the National Academy of Sciences of the United States of America. 2002;99:11014–9. doi: 10.1073/pnas.172368799. [DOI] [PMC free article] [PubMed] [Google Scholar]
- 7.Miri AK, Tripathy U, Mongeau L, Wiseman PW. Nonlinear laser scanning microscopy of human vocal folds. The Laryngoscope. 2012;122:356–63. doi: 10.1002/lary.22460. [DOI] [PMC free article] [PubMed] [Google Scholar]
- 8.Bozec L, van der Heijden G, Horton M. Collagen fibrils: nanoscale ropes. Biophysical Journal. 2007;92:70–5. doi: 10.1529/biophysj.106.085704. [DOI] [PMC free article] [PubMed] [Google Scholar]
- 9.Gupta HS. Nanoscale deformation mechanisms in collagen. In: Fratzl P, editor. Collagen: Structure and Mechanics. New York: Springer; 2008. [Google Scholar]
- 10.Neukirch S, Van der Heijden GHM. Geometry and mechanics of uniform n-plies: from engineering ropes to biological filaments. Journal of Elasticity. 2002;69:32. [Google Scholar]
- 11.Jäger I, Fratzl P. Mineralized collagen fibrils: a mechanical model with a staggered arrangement of mineral particles. Biophysical Journal. 2000;79:1737–46. doi: 10.1016/S0006-3495(00)76426-5. [DOI] [PMC free article] [PubMed] [Google Scholar]
- 12.Humphrey JD. Cardiovascular solid mechanics. 2. New York: Springer; 2002. [Google Scholar]
- 13.Calvo B, Pena E, Martinez MA, Doblare M. An uncoupled directional damage model for fibred biological soft tissues. Formulation and computational aspects Anglais. 2007;69:22. [Google Scholar]
- 14.Freed AD, Doehring TC. Elastic model for crimped collagen fibrils. Journal of Biomechanical Engineering. 2005;127:587–93. doi: 10.1115/1.1934145. [DOI] [PubMed] [Google Scholar]
- 15.Cacho F, Elbischger PJ, Rodríguez JF, Doblaré M, Holzapfel GA. A constitutive model for fibrous tissues considering collagen fiber crimp. International Journal of Non-Linear Mechanics. 2007;42:391–402. [Google Scholar]
- 16.Christian Gasser T. An irreversible constitutive model for fibrous soft biological tissue: a 3-D microfiber approach with demonstrative application to abdominal aortic aneurysms. Acta Biomater. 2011;7:2457–66. doi: 10.1016/j.actbio.2011.02.015. [DOI] [PubMed] [Google Scholar]
- 17.Hirano M. Structure of the vocal fold in normal and disease states anatomical and physical studies. In: Ludlow CL, Hard MO, editors. Assessement of Vocal Pathology. Rockville, MD: American Speech-Language-Hearing Association; 1981. [Google Scholar]
- 18.Hahn MS, Kobler JB, Zeitels SM, Langer R. Quantitative and comparative studies of the vocal fold extracellular matrix II: collagen. Ann Otol Rhinol Laryngol. 2006;115:225–32. doi: 10.1177/000348940611500311. [DOI] [PubMed] [Google Scholar]
- 19.Hahn MS, Kobler JB, Zeitels SM, Langer R. Quantitative and comparative studies of the vocal fold extracellular matrix I: Elastic fibers and hyaluronic acid. Ann Otol Rhinol Laryngol. 2006;115:156–64. doi: 10.1177/000348940611500213. [DOI] [PubMed] [Google Scholar]
- 20.Miri AK, Barthelat F, Mongeau L. Effects of dehydration on the viscoelastic properties of vocal folds in large deformations. Journal of voice : official journal of the Voice Foundation. 2012;26:688–97. doi: 10.1016/j.jvoice.2011.09.003. [DOI] [PMC free article] [PubMed] [Google Scholar]
- 21.Dunn KW, Kamocka MM, McDonald JH. A practical guide to evaluating colocalization in biological microscopy. American Journal of Physiology - Cell Physiology. 2011;300:C723–C42. doi: 10.1152/ajpcell.00462.2010. [DOI] [PMC free article] [PubMed] [Google Scholar]
- 22.Grant CA, Brockwell DJ, Radford SE, Thomson NH. Effects of hydration on the mechanical response of individual collagen fibrils. Applied Physics Letters. 2008;92:233902. [Google Scholar]
- 23.Heris HK, Rahmat M, Mongeau L. Characterization of a hierarchical network of hyaluronic acid–gelatin composite for use as a smart injectable biomaterial. Macromolecular Bioscience. 2011 doi: 10.1002/mabi.201100335. [DOI] [PMC free article] [PubMed] [Google Scholar]
- 24.Oliver WC, Pharr GM. Measurement of hardness and elastic modulus by instrumented indentation: Advances in understanding and refinements to methodology. Journal of Materials Resarch. 2004;19:3–20. [Google Scholar]
- 25.Miri AK, Mongrain R, Chen LX, Mongeau L. Quantitative assessment of the anisotropy of vocal fold tissue using shear rheometry and traction testing. Journal of Biomechanics. 2012;45:2943–6. doi: 10.1016/j.jbiomech.2012.08.030. [DOI] [PMC free article] [PubMed] [Google Scholar]
- 26.Holzapfel GA. Nonlinear solid mechanics. a continuum approach for engineering. Chichester: Wiley; 2000. [Google Scholar]
- 27.Graham JS, Vomund AN, Phillips CL, Grandbois M. Structural changes in human type I collagen fibrils investigated by force spectroscopy. Experimental cell research. 2004;299:335–42. doi: 10.1016/j.yexcr.2004.05.022. [DOI] [PubMed] [Google Scholar]
- 28.Shen ZL, Dodge MR, Kahn H, Ballarini R, Eppell SJ. Stress-strain experiments on individual collagen fibrils. Biophysical Journal. 2008;95:3956–63. doi: 10.1529/biophysj.107.124602. [DOI] [PMC free article] [PubMed] [Google Scholar]
- 29.Hansen JK, Thibeault SL. Current understanding and review of the literature: vocal fold scarring. J Voice. 2006;20:110–20. doi: 10.1016/j.jvoice.2004.12.005. [DOI] [PubMed] [Google Scholar]
- 30.Hahn MS, Liao H, Munoz-Pinto D, Qu X, Hou Y, Grunlan MA. Influence of hydrogel mechanical properties and mesh size on vocal fold fibroblast extracellular matrix production and phenotype. Acta Biomaterialia. 2008;4:1161. doi: 10.1016/j.actbio.2008.04.013. [DOI] [PMC free article] [PubMed] [Google Scholar]
- 31.Chouaieb N, Goriely A, Maddocks JH. Helices. Proceedings of the National Academy of Sciences. 2006;103:9398–403. doi: 10.1073/pnas.0508370103. [DOI] [PMC free article] [PubMed] [Google Scholar]