

Abstract
Objectives:
Evaluation and reduction of dose are important issues. Since cone beam CT (CBCT) has been established now not just in dentistry, the number of acquired examinations continues to rise. Unfortunately, it is very difficult to compare the doses of available devices on the market owing to different exposition parameters, volumes and geometries. The aim of this study was to evaluate the spans of effective doses (EDs) of ten different CBCT devices.
Methods:
48 thermoluminescent dosemeters were placed in 24 sites in a RANDO® head phantom. Protocols with lowest exposition parameters and protocols with highest exposition parameters were performed for each of the ten devices. The ED was calculated from the measured energy doses according to the International Commission on Radiological Protection 2007 recommendations for each protocol and device, and the statistical values were evaluated afterwards.
Results:
The calculation of the ED resulted in values between 17.2 µSv and 396 µSv for the ten devices. The mean values for protocols with lowest and highest exposition parameters were 31.6 µSv and 209 µSv, respectively.
Conclusions:
It was not the aim of this study to evaluate the image quality depending on different exposition parameters but to define the spans of EDs in which different CBCT devices work. There is a wide span of ED for different CBCT devices depending on the selected exposition parameters, required spatial resolution and many other factors.
Keywords: cone beam computed tomography, effective doses, dose range, thermoluminescent dosimetry
Introduction
Evaluation and reduction of doses are important issues in radiology. Since cone beam CT (CBCT) has been established now not just in dentistry, the number of acquired examinations continues to rise. In Germany, close to 2000 CBCT devices are installed. Unfortunately, it is very difficult to compare the doses of available devices on the market owing to different exposition parameters, filtering, volumes and geometries. In the literature, different results of dose evaluations for single devices and examination protocols can be found.1–4 However, it is very difficult to compare these results because of the named multiple influencing factors. The aim of this study is to evaluate the spans of effective doses (EDs) of ten different CBCT devices and to define the highest and the lowest possible ED for these devices, creating a better way to make different devices of many manufacturers comparable.
Materials and methods
The radiation dosimetry was performed with a solid thermoluminescent dosemeter (TLD 100; Thermo Fisher Scientific, Waltham, MA), which was accurate in the range of 10 µGy to 10 Gy. 48 TLDs were placed in 24 sites in a RANDO® head phantom (The Phantom Laboratory, Salem, NY). Table 1 shows the locations of the TLD in the phantom.
Table 1.
Position of TLD in the phantom
| Location (level) | TLD serial |
| Calvarium anterior (2) | 1 |
| Calvarium left (2) | 2 |
| Calvarium posterior (2) | 3 |
| Left orbit (4) | 4 |
| Right orbit (4) | 5 |
| Pituitary (3) | 6 |
| Left parotid (6) | 7 |
| Left ramus mandibulae (6) | 8 |
| Right cheek (5) | 9 |
| Right ramus mandibulae (6) | 10 |
| Right parotid (6) | 11 |
| Centre cervical spine (6) | 12 |
| Left mandible body (7) | 13 |
| Right mandible body (7) | 14 |
| Left submandibular gland (7) | 15 |
| Right submandibular gland (7) | 16 |
| Left back of neck (7) | 17 |
| Centre sublingual gland (7) | 18 |
| Midline thyroid (9) | 19 |
| Oesophagus (9) | 20 |
| Thyroid surface left (9) | 21 |
| Left lens of eye (3) | 22 |
| Right lens of eye (3) | 23 |
| Mid-brain (2) | 24 |
TLD, thermoluminescent dosemeter.
Protocols with lowest exposition parameters and protocols with highest exposition parameters were performed with ten different CBCT devices. The used CBCT devices were the (three-dimensional) 3D Accuitomo FP® (J. Morita, MFG. CORP., Kyoto, Japan); the 3D eXam® (KaVo, Biberach, Germany); the Kodak 9000 3D® and the Kodak 9500® (Carestream Dental, Stuttgart, Germany); the ProMax 3D® (Planmeca Oy, Helsinki, Finland); the Galileos Comfort® and the Orthophos XG 3D® (Sirona, Bensheim, Germany); the Scanora 3D® (Sordex, Tuusula, Finland); and the Master3Ds® and PaX-Duo3D® (VATECH Co., Ltd and E-Woo, Suwon, Korea). Table 2 shows the specific protocols used in this study.
Table 2.
Selected parameters for the different devices
| Protocol | 3D Accuitomo FP® | 3D eXam® | Kodak 9000 3D® | Kodak 9500® | ProMax 3D® | |
| 1 | Voxel (μm) | 125 | 400 | 200 | 500 | 320 |
| FOV (mm) | 40 × 40 | 160 × 20 | 50 × 37 | 90 × 150 | 32 × 42 | |
| kV | 60 | 120 | 60 | 60 | 54 | |
| mA | 1 | 5 | 2 | 2 | 1 | |
| 2 | Voxel (μm) | 125 | 300 | 200 | 300 | 160 |
| FOV (mm) | 80 × 80 | 230 × 170 | 78 × 37 | 184 × 206 | 80 × 80 | |
| kV | 90 | 120 | 90 | 90 | 84 | |
| mA | 8 | 5 | 10 | 10 | 16 |
| Protocol | Galileos Comfort® | Orthophos XG 3D® | Scanora 3D® | Master3Ds® | PaX-Duo3D® | |
| 1 | Voxel (μm) | 300 | 200 | 200 | 400 | 200 |
| FOV (mm) | 150 × 150 | 80 × 55 | 60 × 60 | 160 × 70 | 50 × 50 | |
| kV | 85 | 85 | 85 | 50 | 50 | |
| mA | 7 | 7 | 8 | 2 | 2 | |
| 2 | Voxel (μm) | 150 | 200 | 250 | 200 | 100 |
| FOV (mm) | 150 × 150 | 80 × 80 | 135 × 145 | 200 × 190 | 120 × 85 | |
| kV | 85 | 85 | 85 | 90 | 90 | |
| mA | 7 | 13 | 15 | 10 | 10 |
3D, three-dimensional; FOV, field of view.
The 3D Accuitomo FP is manufactured by J. Morita, MFG. CORP., Kyoto, Japan; the 3D eXam by KaVo, Biberach, Germany; the Kodak 9000 3D and the Kodak 9500 by Carestream Dental, Stuttgart, Germany; the ProMax 3D by Planmeca Oy, Helsinki, Finland; the Galileos Comfort and the Orthophos XG 3D by Sirona, Bensheim, Germany; the Scanora 3D by Sordex, Tuusula, Finland; and the Master3Ds and the PaX-Duo3D by VATECH Co., Ltd and E-Woo, Suwon, South Korea.
Ten recurring expositions were performed for each protocol to statistically stabilize the results. The read-out process was performed in a Fimel LTMWin (Fimel, Fontenay-aux-Roses, France) with a standard planchet that enables measurements of TLDs with a diameter of 5 mm or less. Each TLD was placed in the reader, and the read-out process under nitrogen atmosphere was initialized: the results of the process (digits) were displayed and exported to a .txt file. Three additional TLDs stayed unexposed for each protocol to detect any kind of background radiation (Eback) or other influencing factors and were stored in three different polymethyl methacrylate transportation boxes outside the examination room.
Calibration of thermoluminescent dosemeters
To reset and anneal all TLDs at the same time and in a reproducible procedure, a microprocessor-controlled TLD oven (PTW, Freiburg, Germany) was used. All TLD were heated, held at a defined temperature for 150 min and cooled down to room temperature again. The whole procedure took about 5 h and was repeated before each of the protocols were performed.
For calibration purposes, all TLDs were irradiated with a defined dose (Edef) of 0.5 Gy. A calibration factor K was calculated according to Equation (1) for each TLD:
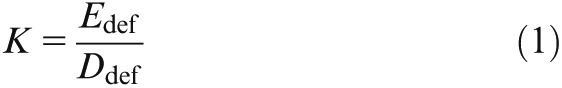 |
where Ddef is the digits from the calibration read-out process.
All individual calculated calibration factors were averaged, and TLDs outside twice the standard deviation were excluded. In the following calculation of the ED, only the averaged K factor was used.
Calculation of the effective dose
For the calculation of the ED, the .txt file was imported to Microsoft® Excel 2011 (Microsoft, Redmond, Washington, DC). The detected energy from the two TLDs at each site was multiplied with the calibration factor K and averaged. The detected background radiation (Eback) was subtracted. The energy dose Emeas (µGy) of each site within the RANDO phantom was given by:
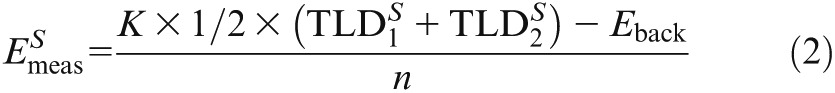 |
where S is the serial number of the site (S = 1,. . ., 24), and n is the count of performed scans. Subsequently, to calculate the ED, all energy doses (Emeas) representing one specific tissue (#S) were averaged and weighted by a factor λtissue, which was in range [0,1] and specified the relative proportion of that tissue/organ in relation to the entire human body (fraction irradiated) for each tissue/organ, as supposed by Roberts5 and Ludlow6 in earlier studies:
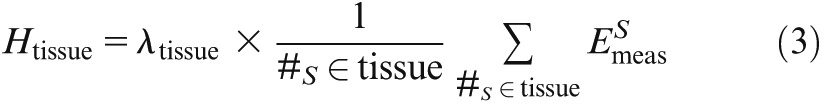 |
The ED in total was then calculated using the weighting factors ωtissue from the International Commission of Radiological Protection (ICRP) 103, published in 2007
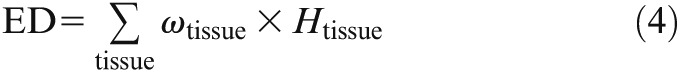 |
Results
There was no statistical difference between the two TLDs of each site. A wide range of EDs could be found. The calculation of the ED resulted in values between 17.2 µSv and 396 µSv for the ten devices. The mean value for the protocols with lowest exposition parameters was 31.6 µSv (SD = 11.8) and 209 µSv (SD = 107.7) for the protocols with highest exposition parameters. The mean values for the two protocols of each individual device delivered the average for all devices as 120.3 µSv (SD = 53.7). Table 3 shows the results of the calculation of the ED, and Figure 1 shows the spans of the ED for all devices.
Table 3.
ED (μSv) for different protocols and all devices
| Device | 3D Accuitomo FP® | 3D eXam® | Kodak 9000 3D® | Kodak 9500® | ProMax 3D® |
| Protocol 1 | 47 | 23 | 25 | 17 | 23 |
| Protocol 2 | 314 | 156 | 48 | 151 | 357 |
| Mean | 180 | 90 | 36 | 84 | 190 |
| Device | Galileos Comfort® | Orthophos XG 3D® | Scanora 3D® | Master3Ds® | PaX-Duo3D® |
| Protocol 1 | 51 | 43 | 40 | 29 | 19 |
| Protocol 2 | 95 | 176 | 170 | 396 | 228 |
| Mean | 73 | 110 | 105 | 212 | 123 |
3D, three-dimensional; ED, effective dose.
The 3D Accuitomo FP is manufactured by J. Morita, MFG. CORP., Kyoto, Japan; the 3D eXam by KaVo, Biberach, Germany; the Kodak 9000 3D and the Kodak 9500 by Carestream Dental, Stuttgart, Germany; the ProMax 3D by Planmeca Oy, Helsinki, Finland; the Galileos Comfort and the Orthophos XG 3D by Sirona, Bensheim, Germany; the Scanora 3D by Sordex, Tuusula, Finland; and the Master3Ds and the PaX-Duo3D by VATECH Co., Ltd and E-Woo, Suwon, South Korea.
Figure 1.

Spans of the effective doses for all devices (EDs) included in this study. The 3D Accuitomo FP is manufactured by J. Morita, MFG. CORP., Kyoto, Japan; the 3D eXam by KaVo, Biberach, Germany; the Kodak 9000 3D and the Kodak 9500 by Carestream Dental, Stuttgart, Germany; the ProMax 3D by Planmeca Oy, Helsinki, Finland; the Galileos Comfort and the Orthophos XG 3D by Sirona, Bensheim, Germany; the Scanora 3D by Sordex, Tuusula, Finland; and the Master3Ds and the PaX-Duo3D by VATECH Co., Ltd and E-Woo, Suwon, South Korea
Discussion
In the present study, the ED of ten different CBCT devices was evaluated using TLDs, which are sensitive to many influencing factors. Nevertheless, this method is accepted to perform in vitro dose measurements. TLDs work in a reasonable dose range and store energies over a long time frame with low fading.
A wide range of EDs could be found using different CBCT devices. The results were in line with other dose evaluating studies. Two protocols were performed for each CBCT device to find the high- and low-end border of the dose interval. Some devices delivered a poor image quality at the lower dose border. In some cases, the volume seems to be empty to the observer because of a very bad signal-to-noise ratio. However, evaluation of image quality was not one of the aims of this study and was therefore neglected.
A critical point in dose measurements using only a head phantom and TLD is the questionability of the reproducible positioning of the phantom in the device. A vertical shift in the positioning of the volume will influence the outcome: a small volume acquired in the upper front jaw will result in a lower ED than the same volume located in the lower back jaw because of different irradiated tissues. This fact makes it difficult to compare EDs of small volumes unless they are acquired in the same region of the skull.
Furthermore, it should be considered that recreation of similar conditions for each measurement is difficult. Variables like geographical location, time and transportation of the TLD are also influencing factors. All these criteria have a lower impact when performing dose measurements on higher dose modalities such as CT.
Pauwels et al3 performed ED measurements with 14 different CBCT devices (3D Accuitomo 170, Galileos Comfort, i-CAT Next Generation, Iluma Elite, Kodak 9000 3D, Kodak 9500, NewTom VG, NewTom VGi, Pax-Uni3D, Picasso Trio, ProMax 3D, Scanora 3D, SkyView and Veraviewepocs 3D) and selected “typical” patient exposition parameters and protocols. The measurement of the EDs resulted in values between 19 µSv and 368 µSv, depending on the selected volume size and/or position. These results match the range of this present study.
The calculation of the ED according to the ICRP recommendations is also a questionable method. The thyroid e.g. is calculated with 100%, even if it is not directly in the primary beam. With a weighting factor of 0.12, its influence on the resulting ED is strong. Previous studies also used a head phantom only and were therefore not able to detect energy doses in the thorax or the abdomen. Unfortunately, some of the sensitive tissues are located in these areas. In a dose evaluation study performed by Jeong et al,7 a full body phantom was used and the EDs for different examination protocols were calculated. In this case, an estimation of the parts of tissues is not needed and all averaged organ doses can be simply calculated to the total ED. This should be considered in CBCT studies as well, even if the calculated ED would be higher.
Another method to evaluate the ED of CBCT devices using metal oxide semiconductor field-effect transistor was investigated by Koivisto et al.8 The measurement using this method delivered 153 µSv for a Promax 3D (Planmeca, Helsinki, Finland) with a cylindrical 80 × 80 mm volume (84 kV, 12 mAs, 145 mAs).
Dose simulation models are available for CT. Because of many different geometries used in CBCT, it is complicated to transfer these models to this technique.
In conclusion, this study implicates an overall mean ED of 120.3 µSv for the investigated ten different devices. Despite the more hypothetical value of minimal EDs, it has been revealed that the typical ED for a standard acquisition protocol (upper and lower jaw) has to be located between 100 µSv and 200 µSv.
References
- 1.Ludlow JB. A manufacturer’s role in reducing the dose of cone beam computed tomography examinations: effect of beam filtration. Dentomaxillofac Radiol 2011; 40: 115–122. 10.1259/dmfr/31708191 [DOI] [PMC free article] [PubMed] [Google Scholar]
- 2.Morant JJ, Salvadó M, Hernández-Girón I, Casanovas R, Ortega R, Calzado A. Dosimetry of a cone beam CT device for oral and maxillofacial radiology using Monte Carlo techniques and ICRP adult reference computational phantoms. Dentomaxillofac Radiol 2012; 42: 92555893. 10.1259/dmfr/92555893 [DOI] [PMC free article] [PubMed] [Google Scholar]
- 3.Pauwels R, Beinsberger J, Collaert B, Theodorakou C, Rogers J, Walker A, et al. Effective dose range for dental cone beam computed tomography scanners. Eur J Radiol 2012; 81: 267–271. 10.1016/j.ejrad.2010.11.028 [DOI] [PubMed] [Google Scholar]
- 4.Bai M, Liu B, Mu H, Liu X, Jiang Y. The comparison of radiation dose between C-arm flat-detector CT (DynaCT) and multi-slice CT (MSCT): a phantom study. Eur J Radiol 2012; 81: 3577–3580. 10.1016/j.ejrad.2011.09.006 [DOI] [PubMed] [Google Scholar]
- 5.Roberts JA, Drage NA, Davies J, Thomas DW. Effective dose from cone beam CT examinations in dentistry. Br J Radiol 2009; 82: 35–40. 10.1259/bjr/31419627 [DOI] [PubMed] [Google Scholar]
- 6.Ludlow J. Dosimetry of 3 CBCT devices for oral and maxillofacial radiology: CB Mercuray, NewTom 3G and i-CAT. Dentomaxillofac Radiol 2006; 35: 219–226. 10.1259/dmfr/14340323 [DOI] [PubMed] [Google Scholar]
- 7.Jeong D-K, Lee SC, Huh KH, Yi WJ, Heo MS, Lee SS, et al. Comparison of effective dose for imaging of mandible between multi-detector CT and cone beam CT. Imaging Sci Dent 2012; 42: 65–70. 10.5624/isd.2012.42.2.65 [DOI] [PMC free article] [PubMed] [Google Scholar]
- 8.Koivisto J, Kiljunen T, Tapiovaara M, Wolff J, Kortesniemi M. Assessment of radiation exposure in dental cone-beam computerized tomography with the use of metal-oxide semiconductor field-effect transistor (MOSFET) dosimeters and Monte Carlo simulations. Oral Surg Oral Med Oral Pathol Oral Radiol 2012; 114, 393–400 [DOI] [PubMed] [Google Scholar]