

Abstract
Aims: Glucocorticoids, such as dexamethasone, enhance hepatic energy metabolism and gluconeogenesis partly through changes in mitochondrial function. Mitochondrial function is influenced by the balance between mitochondrial fusion and fission events. However, whether glucocorticoids modulate mitochondrial function through the regulation of mitochondrial dynamics is currently unknown. Results: Here, we report that the effects of dexamethasone on mitochondrial function and gluconeogenesis in hepatoma cells are dependent on the mitochondrial fission protein dynamin-related protein 1 (Drp1). Dexamethasone increased routine oxygen consumption, maximal respiratory capacity, superoxide anion, proton leak, and gluconeogenesis in hepatoma cells. Under these conditions, dexamethasone altered mitochondrial morphology, which was paralleled by a large increase in Drp1 expression, and reduced mitofusin 1 (Mfn1) and Mfn2. In vivo dexamethasone treatment also enhanced Drp1 expression in mouse liver. On the basis of these observations, we analyzed the dependence on the Drp1 function of dexamethasone effects on mitochondrial respiration and gluconeogenesis. We show that the increase in mitochondrial respiration and gluconeogenesis induced by dexamethasone are hampered by the inhibition of Drp1 function. Innovation: Our findings provide the first evidence that the effects of glucocorticoids on hepatic metabolism require the mitochondrial fission protein Drp1. Conclusion: In summary, we demonstrate that the mitochondrial effects of dexamethasone both on mitochondrial respiration and on the gluconeogenic pathway depend on Drp1. Antioxid. Redox Signal. 19, 366–378.
Introduction
Mitochondrial fusion and fission regulates, at least in part, mitochondrial morphology, response to apoptotic stimuli, mitochondrial metabolism, and quality control (23, 41). Mitochondrial fusion is required to facilitate the intercomplementation of mitochondrial DNA, and it protects mitochondria under different kinds of cellular stress (8, 40). To ensure mitochondrial complementation, both the inner and the outer mitochondrial membrane need to fuse (25). The main proteins involved in mitochondrial fusion are the outer membrane GTPases: Mitofusins (Mfn1 and Mfn2) (10, 19) and the inner membrane GTPase optic atrophy 1 (OPA1) (6, 20). Mitochondrial fission is necessary to drive old or damaged mitochondria from the cell through an autophagic process called mitophagy. Alterations in the fission machinery cause an increased generation of reactive oxygen species, a higher susceptibility of cells to undergo apoptosis, a different capacity to generate ATP, and a population of mitochondria with heterogeneuos mtDNA distribution (27). On the other hand, dynamin-related protein 1 (Drp1), mitochondrial fission factor (Mff), and fission protein 1 homolog (Fis1) regulate mitochondrial fission (14, 21, 26, 42).
Innovation.
Glucocorticoids are key regulators of gluconeogenesis and of mitochondrial bioenergetics in liver mitochondria (1, 32, 33) or in hepatoma cells (12). Although some of the effects of glucocorticoids on respiratory chain activity are dependent on the transcription of genes encoding enzymes of oxidative phosphorylation, it is not known whether changes in mitochondrial fusion and fission proteins are required for glucocorticoids to exert its effects on mitochondrial function and gluconeogenesis. Here, we report that the effects of dexamethasone on mitochondrial function and gluconeogenesis in hepatoma cells are dependent on the mitochondrial fission protein dynamin-related protein 1 (Drp1). Our findings provide the first evidence that the mitochondrial effects of glucocorticoids on hepatic metabolism require the mitochondrial fission protein Drp1.
Glucocorticoids are important regulators in mammalian metabolism, partly by regulating hepatic gluconeogenesis through the up-regulation of key gluconeogenic enzymes and the increased supply of substrates coming from peripheral tissues (30). Glucocorticoids also regulate mitochondrial bioenergetics in rat liver mitochondria (1, 32, 33) or in hepatoma HepG2 cells (12). Some of the effects of glucocorticoids on respiratory chain activity are dependent on the transcription of genes encoding enzymes of oxidative phosphorylation (OXPHOS) (34). However, it is not known whether changes in mitochondrial fusion and fission proteins are required for glucocorticoids to exert their effects on mitochondrial function and gluconeogenesis. In the present study, we analyzed the effects of dexamethasone both on mitochondrial respiration, and on the expression of the mitochondrial fusion and fission proteins in hepatoma FaO cells. Dexamethasone markedly increased Drp1 expression. This increase is physiologically relevant, as the modulation of Drp1 function altered the effects of dexamethasone on mitochondrial function and gluconeogenesis. Thus, we have demonstrated that the mitochondrial fission Drp1 is a novel target that modulates gluconeogenesis and mitochondrial metabolism in hepatoma cells.
Results
Effects of dexamethasone on mitochondrial respiration and on gluconeogenesis in hepatoma cells
We analyzed the effect of dexamethasone on respiration and glucose production in hepatoma (Fao) cells. These differentiated cells are known to respond to glucocorticoids (15, 36). Incubation of cells for 24 h with 1 μM dexamethasone increased glucose production by gluconeogenesis from lactate/pyruvate (Fig. 1A) (a pathway that involves mitochondrial steps) but not from dihydroxyacetone (which follows an exclusively cytosolic pathway) (Fig. 1B). Under these conditions in intact cells, dexamethasone increased routine oxygen consumption, proton leak, and electron transfer system capacity (ETS capacity or noncoupled state) (Fig. 1C–E). Dexamethasone also lowered mitochondrial membrane potential (Fig. 1F). An analysis of mitochondrial respiration in cell extracts revealed that dexamethasone reduced state 4 respiration for complex I and enhanced the respiratory control ratio (RCR) (Fig. 1G, H). Under these conditions, ETS capacity was also enhanced by dexamethasone as observed in intact cells (Fig. 1I); and this increase was maintained in the presence of rotenone (data not shown) or in state 3 using a substrate for respiratory complexes I and II (Fig. 1G, and data not shown), suggesting a role of complex II in the effects of the hormone. The profound alterations in mitochondrial function caused by dexamethasone were not explained by changes in the expression of OXPHOS subunits (Fig. 1J). Dexamethasone did not alter the expression of the mitochondrial marker Porin (Fig. 2F), thereby suggesting the absence of changes in mitochondrial mass or in cellular biogenesis.
FIG. 1.

Dexamethasone stimulates mitochondrial respiration in FaO cells. (A) Glucose production using 20 mM lactate/2 mM pyruvate or (B) 20 mM dihydroxyacetone. (C–E) Oxygen consumption rates (OCRs) of intact FaO cells with or without 1 μM dexamethasone (24 h) as explained in Supplementary Figure S1A. (C) Routine respiration, (D) leak (oligomycin-insensitive respiration) (1 μg/ml oligomycin), and (E) ETS capacity or uncoupled respiration (1 μM FCCP) were measured in cells cultured in Dulbecco's modified Eagle's medium (DMEM) containing 5 mM glucose. (F) Mitochondrial membrane potential measured with JC1 probe. (G–I) OCRs in cell extracts obtained after 24 h incubation of cells with or without 1 μM dexamethasone. (G) State 4 and state 3 (I+II), (H) respiratory control ratio (RCR), and (I) ETS capacity as explained in Supplementary Figure S1B. (J) Western blotting analysis of subunits of respiratory chain complexes in 20 μg of cell homogenates. Subunit NDUFA9 (complex I), anti-SdhA (complex II), anti-Uqcrc2, (complex III), anti-COX IV (Complex IV), and anti-Atp5a1 (Complex V). Proteins were detected by the ECL method. Data are expressed relative to β-actin. Dexamethasone-treated cells: black bars versus control cells: open bars. *p<0.05 compared with control cells.
FIG. 2.

Dexamethasone modifies the expression of mitochondrial fission and fusion proteins and mitochondrial morphology in FaO cells. (A–F) Protein expression of mitochondrial dynamic proteins in total homogenates of FaO cells with and without 1 μM dexamethasone for 24 h. Data are expressed relative to β-actin. (G–H) Representative images of mitochondria in FaO cells and quantification. Mitochondria were visualized by labeling with Mitotracker green in live cells without and with 1 μM dexamethasone incubated for 24 h. Scale bars 10 μm (G). (I, J) In vivo dexamethasone treatment. (I) Representative WB images of total liver homogenates. (J) WB quantification. Dexamethasone-treated cells: black bars versus control cells: open bars. *p<0.05 compared with control cells. WB, western blot. To see this illustration in color, the reader is referred to the web version of this article at www.liebertpub.com/ars
We also examined the effects of dexamethasone on the expression of proteins that participate in mitochondrial fusion and fission. Dexamethasone caused an increased expression of the mitochondrial fission protein Drp1 (threefold increase), with no changes in Fis1 (Fig. 2A, B). In contrast, the expression of mitochondrial fusion proteins Mfn1 and Mfn2 was repressed by dexamethasone (Fig. 2C, D). OPA1 was not altered by dexamethasone (Fig. 2E). Under these conditions, dexamethasone caused a change in the mitochondrial morphology in cells. Mitochondrial shape ranged from a round to an elongated morphology in control conditions (Fig. 2G), and the exposure to dexamethasone caused a shift to donut-like shaped mitochondria (Fig. 2G). The percentage of round-shaped mitochondria was markedly enhanced in dexamethasone-treated cells (Fig. 2H). In vivo treatment of dexamethasone (2 mg/kg per day, i.p.) in C57BL6/J mice for 3 days also caused a marked induction of Drp1 expression in livers (Fig. 2I), which was parallel to the induction of the key gluconeogenic enzymes PEPCK and glucose-6-phosphatase (GP6ase) (Fig. 2I). In addition, in agreement with the observations in hepatoma cells, dexamethasone repressed Mfn2 expression in mouse liver (Fig. 2I).
Our data indicate that the treatment of hepatoma FaO cells with dexamethasone causes marked effects on mitochondrial function. These effects are parallel to changes in the expression of mitochondrial dynamics proteins, and, more specifically, of Drp1, and the modification of mitochondrial morphology is also detected. The effects of dexamethasone on Drp1 expression are also detected in mouse liver.
Genetic manipulation of Drp1 activity modulates the effects of dexamethasone on respiration in FaO cells
In order to analyze whether the stimulatory effects of dexamethasone on the mitochondrial fission protein Drp1 was relevant for its functional effects, we next studied the impact of Drp1 inhibition. To this end, cells were transduced with adenoviruses encoding for a dominant negative mutant form of Drp1K38A or with control adenoviruses (LacZ) (Fig. 3A). Drp1K38A affects GTPase activity and inhibits mitochondrial fission (22, 37). In parallel, cells were also transduced with the wild-type form of Drp1 to test whether enhanced activity of Drp1 was sufficient to mimic the effects caused by dexamethasone (Fig. 3B). In agreement with earlier reports, Drp1K38A caused elongation of mitochondria (Fig. 3C), and a reduction of round mitochondria compared with LacZ cells (Fig. 3D). On the other hand, Drp1 overexpression caused fragmentation of mitochondria in FaO cells (Fig. 3C, E). Interestingly, the effects of dexamethasone inducing the formation of donut-like shaped mitochondria were still present on the expression of Drp1K38A or Drp1 wild type (Fig. 3C, E), suggesting the participation of additional proteins dominant over Drp1.In the presence of Drp1 K38A, the effects of dexamethasone on ETS capacity were reduced, and proton leak was not significantly increased (Fig. 4B, C), which occurred in the absence of alterations in routine oxygen consumption (Fig. 4A). In contrast, the overexpression of Drp1 did not alter routine or ETS capacity, but decreased proton leak (Fig. 4A–C). Moreover, the stimulatory effects of dexamethasone on routine or ETS capacity were similar in the Drp1 group compared with control cells (Fig. 4A, C). The effects of Drp1K38A or Drp1 were not a consequence of alteration in the expression of OXPHOS subunits or in mitochondrial mass (Supplementary Fig. S2A, S2B; Supplementary Data are available online at www.liebertpub.com/ars).
FIG. 3.

Effect of a dominant negative form of dynamin-related protein 1 (Drp1) or overexpression of Drp1 on dexamethasone-induced mitochondrial morphology. (A) WB showing the expression of Drp1 in FaO cells after transduction of adenoviruses encoding LacZ or a dominant negative form of Drp1 (K38A). (B) WB showing the expression of Drp1 in FaO cells after the transduction of adenoviruses encoding LacZ or wild-type Drp1. (C) Representative images of mitochondria in FaO cells infected with LacZ, a dominant negative form of Drp1(K38A) or wild-type Drp1 incubated for 24 h with or without 1 μM dexamethasone. Mitochondria were visualized by labeling with Mitotracker green in live cells. Scale bars 10 μm.) (D, E) Quantification of round mitochondria shape without (D) or with dexamethasone treatment (E). To see this illustration in color, the reader is referred to the web version of this article at www.liebertpub.com/ars
FIG. 4.

Respiration rates of FaO cells with or without 1 μM dexamethasone for 24 h and infected with Lac Z, K38A, or Drp1 adenovirus. (A) Routine, (B) leak, and (C) ETS capacity were measured in intact cells cultured in DMEM containing 5 mM glucose as detailed in Supplementary Figure S1A. Cells were infected with adenoviruses encoding Lac Z, a dominant negative form of Drp1 (K38A) or wild-type Drp1, and were treated without or with 1 μM dexamethasone for 24 h. *p<0.05 compared with LacZ cells. †p<0.05 compared basal and dexamethasone treatment. ‡p<0.05 compared among dexamethasone treatments.
Our data indicate that the regulatory effects of dexamethasone on mitochondrial respiration are largely ablated by the inhibition of Drp1 function, suggesting that a normal mitochondrial fission activity is required for the effects of dexamethasone to be displayed.
Effects of dexamethasone and Drp1 on reactive oxygen species production and antioxidant capacity
Next, we monitored the effects of dexamethasone on reactive oxygen species (ROS) production in FaO cells. Dexamethasone increased superoxide anion (Fig. 5A), but hydrogen peroxide remained unaltered (Fig. 5B). Under these conditions, catalase and glutathione reductase were reduced by dexamethasone, whereas superoxide dismutase (SOD) or glutathione peroxidase stayed normal (Supplementary Fig. S3A–D). The expression of Drp1K38A caused a moderate increase in superoxide anion concentration, whereas Drp1 wild type had no effects on either superoxide or hydrogen peroxide concentrations in cells, and it did not counteract the effects of dexamethasone (Fig. 5A, B). With regard to antioxidant enzymes, the expression of Drp1K38A caused a substantial reduction of catalase activity, and the expression of Drp1 cancelled the response to dexamethasone (Supplementary Fig. S3B). Our data indicate that dexamethasone enhances superoxide anion production, and this may be upstream of Drp1 induction.
FIG. 5.
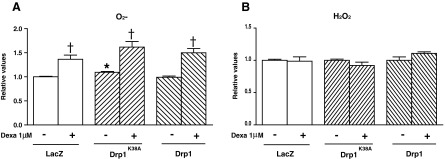
Effects of Drp1 and Drp1K38A on oxidative stress. Cells were infected with adenoviruses encoding Lac Z, a dominant negative form of Drp1 (K38A) or wild-type Drp1, and were treated without or with 1 μM dexamethasone for 24 h. (A) Superoxide anion was measured in FaO cells (B) Hydrogen peroxide was measured in extracts of FaO cells. *p<0.05 compared with LacZ cells, †p<0.05 compared with basal and dexamethasone treatment. ‡p<0.05 compared with LacZ with dexamethasone and both Drp1 or Drp1K38A overexpression with dexamethasone.
Drp1 modulates the effects of dexamethasone on gluconeogenesis in FaO cells
On the basis of the previous results, we next analyzed whether the modulation of Drp1 expression/activity could alter the stimulatory effect of dexamethasone on glucose production from gluconeogenic substrates such as lactate/pyruvate or dihydroxyacetone. In this regard, overexpression of the Drp1 dominant negative mutant K38A largely reduced dexamethasone-induced gluconeogenesis from lactate pyruvate, which requires functional mitochondria (Fig. 6A). No effects were detected on gluconeogenesis from dihydroxyacetone, which do not require mitochondrial steps (Fig. 6B). On the other hand, the overexpression of Drp1 did not alter the effect of dexamethasone on gluconeogenesis (Fig. 6A). The inhibitory effects of Drp1K38A on dexamethasone-induced gluconeogenesis were not due to changes in the expression of PEPCK or GPase. Dexamethasone caused a marked induction of two key gluconeogenic enzymes, PEPCK and GPase protein expression, and these effects were not altered by either Drp1K38A or Drp1 wild type (Fig. 6C).
FIG. 6.

Effects of Drp1 and Drp1K38A on gluconeogenesis in FaO cells. (A and B) Fao cells were incubated with Coon's Modified Ham's F12 media, infected with adenovirus, and incubated 24 h with or without 1 μM dexamethasone. Glucose production was measured during a period of 4 h in the presence of 20 mM lactate and 2 mM pyruvate (A), or 20 mM dihydroxyacetone (B) in glucose-free RPMI-1640 media. (C) PEPCK protein and G6Pase protein was measured in 20 μg total homogenates of FaO cells incubated for 24 h with or without 1 μM dexamethasone. Proteins were detected by the ECL method. Data are expressed relative to β-actin. *p<0.05 compared with LacZ cells, †p<0.05 compared with basal and dexamethasone treatment. ‡p<0.05 compared with LacZ with dexamethasone and both Drp1 or Drp1K38A overexpression with dexamethasone.
Mfn2 loss of function does not mimic the effects of dexamethasone
Next, we analyzed whether the effects of dexamethasone could be mimicked by the loss of function of Mfn2, a manipulation that causes mitochondrial fragmentation and which reduces glucose oxidation and mitochondrial respiration (3, 29). To this end, FaO cells were infected with adenoviruses encoding microRNA (miRNA) specifically directed against Mfn2. This caused a marked repression of Mfn2 (Fig. 7A) and changes in mitochondrial morphology (Fig. 7D, E). Thus, the number of elongated mitochondria was reduced in Mfn2 knockdown cells already under basal conditions (Fig. 7E). In addition, the effect of dexamethasone inducing round-shaped mitochondria was somewhat reduced, resulting in less round mitochondria in the Mfn2 knockdown group (Fig. 7D, E). Next, we monitored the effects on respiration and gluconeogenesis. Basal gluconeogenic rate was reduced in Mfn2 knockdown cells when the substrates were lactate/pyruvate but not from dihydroxyacetone (Fig. 7B, C). This occurred under conditions in which routine or ETS capacity were unaltered and proton leak was induced (Fig. 8A–C). In addition, dexamethasone-induced gluconeogenesis from lactate/pyruvate was diminished in the Mfn2 knockdown cells, whereas dexamethasone-induced respiration was unaltered (Figs. 7B and 8A, C). In all, our data indicate that the effects of dexamethasone on respiration or on gluconeogenesis are not a consequence of reduced Mfn2 expression.
FIG. 7.

Effect of mitofusin 2 (Mfn2) down-regulation in FaO cells on mitochondrial morphology and gluconeogenesis. FaO cells were infected with LacZ, or microRNA (miRNA) Mfn2 adenovirus (KDMfn2) and further incubated with or without 1 μM dexamethasone (24 h). (A) Western blot showing Mfn2 expression in cells infected with LacZ or miRNA adenoviruses. (B) Glucose production using 20 mM lactate/2 mM pyruvate or (C) 20 mM dihydroxyacetone as substrates. (D) Representative images of mitochondria in FaO cells infected with LacZ or miRNA adenoviruses incubated for 24 h with or without 1 μM dexamethasone. Mitochondria were visualized by labeling with Mitotracker red in live cells. Scale bars 10 μm. (E) Quantification of elongated mitochondria shape without or with dexamethasone treatment. *p<0.05 compared with LacZ cells, †p<0.05 compared with basal and dexamethasone groups. ‡p<0.05 compared with LacZ-dexamethasone and KDMfn2-dexamethasone groups. To see this illustration in color, the reader is referred to the web version of this article at www.liebertpub.com/ars
FIG. 8.

Effect of Mfn2 down-regulation in FaO cells on respiration rates. FaO cells were infected with LacZ, or miRNA Mfn2 adenovirus (KDMfn2) and further incubated with or without 1 μM dexamethasone (24 h). (A–C) OCRs of FaO cells. (A) Routine, (B) leak, and (C) ETS capacity were measured in intact cells in DMEM containing 5 mM glucose as detailed in Supplementary Figure S1A. *p<0.05 compared with LacZ cells, †p<0.05 compared with basal and dexamethasone groups. ‡p<0.05 compared with LacZ-dexamethasone and KDMfn2-dexamethasone groups.
Discussion
Here, we demonstrate that dexamethasone up-regulates the expression of mitochondrial fission protein Drp1 in hepatoma FaO cells and in mouse liver. Moreover, our data indicate that the effects of dexamethasone on mitochondrial respiration and on gluconeogenesis depend on normal Drp1 activity. In this regard, the inactivation of Drp1 activity by the expression of a dominant negative form of Drp1 impairs the effects of dexamethasone on oxygen consumption and on mitochondrial-dependent glucose production from lactate/pyruvate. This study demonstrates, for the first time, that glucocorticoids modulate mitochondrial dynamics components, which, in turn, determines the mitochondrial actions of the hormone.
Current evidence demonstrates that changes in Drp1 function modulate mitochondrial metabolism. Thus, the down-regulation of Drp1 by interference RNA (RNAi) in HeLa cells induced highly fused and interconnected mitochondria. This morphological alteration was accompanied by reduced oxygen consumption, ATP content, and mitochondrial membrane potential, as well as increases in ROS levels and oxidative damage, along with mitochondrial DNA loss and autophagic repression (4, 27). Other studies have shown that mutations in the fission protein Drp1 result in elongated mitochondria, reduced levels of OXPHOS subunits, decreased cardiac ATP, and cause a form of dilated cardiomyopathy in mice (2). The overexpression of a dominant negative mutant form of Drp1 (K38A) also causes a marked reduction in the respiratory capacity of INS1 rat insulinoma cells (41). In FaO cells, the inhibition of mitochondrial fission mediated by Drp1K38A reduced ETS capacity. In this regard, the effects of dexamethasone on ETS capacity were almost completely blocked after the inhibition of mitochondrial Drp1 function. The observation that dexamethasone induces Drp1 and that the effects on cellular respiration require Drp1 activity permit the proposal that dexamethasone stimulates cell respiration by a mechanism which requires a normal Drp1 activity and that involves enhanced activity of respiratory complex II.
Another important observation of our study is that the stimulatory effects of dexamethasone on gluconeogenesis are modulated by Drp1. Thus, the inhibition of mitochondrial fission by expression of Drp1K38A did not alter basal glucose production from lactate/pyruvate (which requires mitochondrial steps) or from dihydroxyacetone (which follows a cytosolic gluconeogenic pathway). However, Drp1K38A almost completely blocked the effects of dexamethasone enhancing gluconeogenesis from lactate/pyruvate. This indicates that dexamethasone enhances gluconeogenesis, at least in part, by the activation of mitochondrial function, which requires Drp1 activity.
It is also relevant to note that the in vivo administration of dexamethasone in mice caused a parallel induction of the gluconeogenic proteins PEPCK and GPase and also of Drp1 in livers. On the basis of our data, we propose a key role of hepatic Drp1 in the maintenance of normal gluconeogenesis in mammalian species. Thus, a reduction in Drp1 activity may block the induction of gluconeogenesis in response to glucocorticoids or other hormonal cues that permit a normal glucose homeostasis. Support of this view comes from a lethal disorder reported in a newborn girl carrying a heterozygous missense mutation in DRP1 (A395D) and showing microcephaly, abnormal brain development, OPA and hypoplasia, persistent lactic acidemia, and a mildly elevated plasma concentration of very-long-chain fatty acids has been recently characterized (43). The patient affected by a DRP1 mutation showed elevated blood lactate and plasma alanine concentrations, suggesting alterations in hepatic mitochondrial pyruvate oxidation (43). Further studies in vivo using a Drp1 conditional knockout mouse in the liver will be crucial to validate our findings in vitro.
Dexamethasone also caused Mfn2 repression in FaO cells and in mouse liver. Alterations in Mfn2 expression may disrupt mitochondrial metabolism as well as mitochondrial and endoplasmic reticulum biology (3, 9, 11, 29). However, it is unlikely that Mfn2 repression mediates the effects of dexamethasone studied in this article. Thus, the stimulatory effects of dexamethasone on mitochondrial respiration or on gluconeogenesis were not mimicked by Mfn2 loss of function in FaO cells. This suggests that at least in that cell context, Mfn2 repression is not responsible for the effects of dexamethasone.
In this article, we provide evidence for a role of Drp1 in mediating the effects of dexamethasone in FaO cells. Interestingly, our laboratory has also determined that Mfn2 loss of function causes a deficient insulin signaling in both muscle and liver, which makes mice more susceptible to developing glucose intolerance and insulin resistance (35). Considering all these data, we propose the existence of a link between hormone action and proteins that participate in mitochondrial dynamics; so, mitochondrial dynamics determines the extent of hormone action in mammalian cells.
Our data indicate that dexamethasone stimulates routine and ETS capacity in FaO cells, and under these conditions, superoxide production and proton leak are increased, whereas mitochondrial membrane potential is reduced. Based on available data indicating that ROS induces proton leak (5), our interpretation is that dexamethasone operates as an uncoupler in FaO cells, probably as a consequence of an enhanced superoxide production that, in turn, accelerates proton leak, and leads to reduced mitochondrial membrane potential. The observation that dexamethasone increases superoxide production is in agreement with earlier reports (17), although the precise mechanisms involved are unknown. Nevertheless, manipulations in Drp1 activity did not alter the effects of dexamethasone on superoxide production, indicating that it does not contribute to the actions of dexamethasone on respiration or on gluconeogenic activity.
Dexamethasone caused a marked modification of mitochondrial morphology in FaO cells; so, mitochondria shifted from elongated tubules to donut-like shaped mitochondria. This is similar to the toroidal mitochondrial morphology detected after induction to hypoxia (24). Interestingly, the formation of donut-like mitochondria seems to be independent of Drp1 activity. In fact, the effects of dexamethasone or the effects of hypoxia on mitochondrial morphology are not cancelled on expression of the dominant negative Drp1K38A (24). It does not seem that the changes induced in mitochondrial morphology are relevant in the effects of dexamethasone either on mitochondrial respiration or on gluconeogenesis.
In all, our data indicate that the effects of dexamethasone both on mitochondrial function and on gluconeogenesis involving mitochondrial steps require a higher Drp1 activity. Benard and colleagues have shown that Drp1 regulates membrane fluidity in mitochondria (4), which regulates the activity of F1F0-ATP-synthase activity (13, 17, 24) Thus, it may be feasible that mitochondrial membrane fluidity is crucial in the activation of ATP synthesis in response to glucocorticoids, which, in turn, is key in the activation of gluconeogenesis, a process that requires considerable ATP and GTP supply.
Materials and Methods
Cell culture and adenovirus infection
FaO cells (cell line from rat, Sigma, Madrid, Spain) were grown in Coon's Modified Ham's F12 medium (Sigma) supplemented with 10% fetal bovine serum (FBS; Gibco, Invitrogen, Madrid, Spain) and 2 mM glutamine (Invitrogen). Infection with adenoviruses was performed in Coon's modified Ham's F12 medium supplemented with 0.2% (w/v) bovine serum albumin (Sigma) (infection medium) for 2 h at a moi of 50 pfu/cell. After infection, the cells were incubated for a further 24 h in infection medium before performing the experiment. The following adenoviruses were used in this study: Ad-LacZ (encoding for β-galactosidase), Mouse Drp1, and Drp1K38A cDNA were amplified by PCR and cloned using BP and LR recombinations into the pAdeno-CMV-V5 destination vector (Gateway Technology, Invitrogen, Life Technologies, Barcelona, Spain). The pAdeno-CMV-Drp1 or Drp1K38A-V5 was digested with PacI (NEB) to linearize the plasmid and then sequenced. The Ad-miR2 (encoding for 5 miRNAs against Mfn2) miRNAs were generated using the Bock-it Pol II system from Invitrogen using the expression vector pcDNA 6.2 Gw/EmGFP/miR, which allows the cloning of several miRNAs in tandem and contains a GFP expression cassette. miRNAs were cloned by recombination into the pAdeno-CMV-V5 adenoviral vector (Invitrogen, Life Technologies) using the Gateway system. After the sequence had been verified, the vectors were transfected in HEK293A cells (Invitrogen, Life Technologies) using Lipofectamine 2000 (Invitrogen, Life Technologies) and, after 7–14 days, cytopathic effect was observed in HEK293A. The adenoviruses generated were then amplified in HEK 293 cells, titrated using the Adeno-X™ Rapid Titer kit (Clontech, Nucliber, Madrid, Spain), and directly used for cell transduction.
Respirometry assays
Respirometry in intact cells
FaO cells were seeded and infected with adenoviruses in XF 24-well cell culture microplates at 7.5×10⁴ cells/well (0.32 cm2) in 250 μl growth medium and then incubated at 37°C/5% CO2 for 48 h. The oxygen consumption measurements in intact cells were performed using a Seahorse Bioscience XF-24 instrument (Seahorse Bioscience, North Billerica, MA). On the day before the experiment, the sensor cartridge was placed into the calibration buffer supplied by Seahorse Bioscience to hydrate overnight. Assays were initiated by removing the growth medium from each well and replacing it with 750 μ l of assay medium prewarmed to 37°C (Dulbecco's modified Eagle's medium [DMEM] [Invitrogen, Life Technologies] containing 5 mM glucose and supplemented with 5 mM N-2-hydroxyethylpiperazine-N′-2-ethanesulfonic acid [HEPES] [Sigma], 10% FBS, and penicillin–streptomycin [pen-strep; 100 μg/ml final concentration]) (Gibco, Invitrogen). In basal conditions, cells were incubated at 37°C for 30 min to allow media temperature and pH to reach equilibrium before the first rate measurement. In case of adenovirus infection, 50 moi of adenovirus was used per 24 h before the experiment. The sensor was then placed into the XF-24 instrument and calibrated. After calibration, the calibration fluid plate was replaced with the cell plate. The measurement cycle consisted of a 2-min mix, a 1-min wait, and a 2-min measurement. Four basal rate measurements were followed with injections, and each injection was followed by four measurement cycles. Before the rate measurements, the XF24 Analyzer gently mixed the assay media in each well for 10 min to allow the oxygen partial pressure to reach equilibrium. After the mixing, the oxygen consumption rate (OCR) was measured simultaneously thrice to establish a baseline rate. For each measurement, there was a mix/wait time of about 5 min to restore normal oxygen tension and pH in the microenvironment surrounding the cells. After the baseline measurement, 75 μl of a test compound prepared in assay medium was then injected into each well to reach the desired final concentration as follows: port A: oligomycin 1 μg/ml (Sigma), port B: 1 μM FCCP (carbonylcyanide p-trifluoromethoxyphenylhydrazone) (Sigma), port C: rotenone 1 μM (Sigma), and port D: antimycin A 1 μM (Sigma). Then, four measurements were made after each one of the injections (Supplementary Fig. S1A). For any one treatment, the rates from four wells were used. Rates for the wells were normalized for protein content. Average basal rates were the averages of the third and fourth basal rates, and average uncoupled rates FCCP were the averages of the first and second rates after the injection. All average rates were normalized to control basal. Routine, Leak, and ETS capacity rates were calculated as reported (18, 31, 38, 39)
Respirometry in cell extracts
FaO mitochondrial extracts was prepared with 250 mM sucrose (Sigma), 2 mM EGTA (Sigma), and 10 mM HEPES (Sigma). Oxygen consumption was assessed in the Oxygraph-2k. The experiment was made in triplicate using 250 μg of mitochondrial extracts and followed this protocol: resting respiration (state 2, absence of adenylates) was assessed by the addition of 10 mM glutamate and 2 mM malate (Sigma) as the complex I substrate supply, and then, state 3 respiration was assessed by the addition of 2.5 mM ADP (Sigma). The integrity of the outer mitochondrial membrane was established by the addition of 10 μM cytochrome c (Sigma); no stimulation of respiration was observed. The addition of 10 mM succinate (Sigma) provided state 3 respiration with parallel electron input to complexes I and II. We examined ADP control of coupled respiration and uncoupling control through the addition of the protonophore FCCP (Sigma) (optimum concentration for maximal flux). The addition of 0.5 μM rotenone (Sigma) resulted in the inhibition of complex I, thereby allowing examination of O2 flux with complex II substrate alone, while 2.5 μM antimycin A (Sigma) was added to inhibit complex III in order to observe nonmitochondrial respiration. The concentrations of substrates and inhibitors used were based on earlier experiments conducted for optimization of the titration protocols (Supplementary Fig. S1B). Respiratory state 4, state 3, RCR, and ETS capacity were calculated as reported (7, 16, 38, 39).
Glucose production assays
See details in the Supplementary Methods section.
Mitochondrial membrane potential
See details in the Supplementary Methods section.
Western blotting
See details in the Supplementary Methods section.
Measurement of O2−
O2− levels in FaO living cells were measured using the mitosox probe (Invitrogen, Life Technologies) following the instructions of the manufacturer.
Measurement of H2O2
H2O2 levels in FaO cells extracts were measured using the Amplex Red hydrogen peroxide assay kit (Invitrogen, Life Technologies) following the instructions of the manufacturer. Extracts were obtained in lysis buffer (50 mM Tris pH 7.5, 150 mM NaCl, 1% Triton X-100, and 2 mM EDTA) (Sigma), and 50–100 μg of extract were used for the assay.
Enzymatic activities
FaO cells homogenates were prepared by homogenizing frozen cells in buffer and centrifuged according to the protocols provided by the manufacturer. Total SOD, catalase, glutathione reductases, and glutathione peroxidase activity were measured with commercial enzyme assay kits (Cayman Chemicals, Madrid, Spain). Changes in absorbance were normalized by protein concentrations.
Mitochondrial morphology
See details in the Supplementary Methods section.
Administration of dexamethasone in mice
All animal work was done in compliance with guidelines established by the University of Barcelona Committee on Animal Care. Mice were kept under a 12 h dark-light period, and were provided a standard chow diet and water ad libitum. Dexamethasone (Sigma) administration was carried out as described by Patel et al. (28). Briefly, 12-week-old male mice were separated in control or dexamethasone treatment. Mice were intraperitoneally injected with 100 μl of dexamethasone or 100 μl phosphate-buffered saline. Dexamethasone was administered twice a day in two divided doses (2.5 mg/kg at 8 am and 8 pm, total 5 mg/kg/day) during 3 days. Control mice received the same volume of the vehicle by an intraperitoneal injection at the same time points.
Statistical analysis
The data presented here were analyzed using the Student t-test. Data are presented as mean±standard error of the mean. Significance was established at p<0.05.
Supplementary Material
Abbreviations Used
- BSA
bovine serum albumin
- Dex
dexamethasone
- DMEM
Dulbecco's modified Eagle's medium
- Drp1
dynamin-related protein 1
- ETS
electron transfer system
- FBS
fetal bovine serum
- FCCP
carbonylcyanide p-trifluoromethoxyphenylhydrazone
- Fis1
fission protein 1 homologue
- Mff
mitochondrial fission factor
- Mfn
mitofusin
- miRNA
microRNA
- mtDNA
mitochondrial DNA
- OCR
oxygen consumption rate
- OPA1
optic atrophy 1
- OXPHOS
oxidative phosphorylation
- PBS
phosphate-buffered saline
- RCR
respiratory control ratio
- RNAi
interference RNA
- ROS
reactive oxygen species
- SOD
superoxide dismutase
- WB
western blot
Acknowledgments
The authors thank I. Castrillón, J.C. Monasterio, and N. Plana for technical assistance. They also thank Ms. T. Yates for editorial support. M.I.H.-A. was the recipient of a predoctoral fellowship from the CONACYT, Mexico. M.L. was a recipient of an FPU fellowship from the Ministerio de Educacion y Cultura (Spain) and is a recipient of a post-doctoral fellowship from Fundacion Ramon Areces. J.C.P. was a recipient of predoctoral fellowships from the “Ministerio de Ciencia e Innovación (MICINN),” Spain. This study was supported by research grants from the MICINN (SAF2008-03803), Grant 2009SGR915 from the “Generalitat de Catalunya,” CIBERDEM (“Instituto de Salud Carlos III”), FP7-European Commission (MITIN, HEALTH-F4-2008-223450), INTERREG IV-B-SUDOE-FEDER (DIOMED, SOE1/P1/E178), and COST Action BM0602. A.Z. was the recipient of a Science Intensification Award from the University of Barcelona.
Author Disclosure Statement
The authors declare no conflict of interest.
References
- 1.Arvier M. Lagoutte L. Johnson G. Dumas JF. Sion B. Grizard G. Malthiery Y. Simard G. Ritz P. Adenine nucleotide translocator promotes oxidative phosphorylation and mild uncoupling in mitochondria after dexamethasone treatment. Am J Physiol Endocrinol Metab. 2007;293:E1320–E1324. doi: 10.1152/ajpendo.00138.2007. [DOI] [PubMed] [Google Scholar]
- 2.Ashrafian H. Docherty L. Leo V. Towlson C. Neilan M. Steeples V. Lygate CA. Hough T. Townsend S. Williams D. Wells S. Norris D. Glyn-Jones S. Land J. Barbaric I. Lalanne Z. Denny P. Szumska D. Bhattacharya S. Griffin JL. Hargreaves I. Fernandez-Fuentes N. Cheeseman M. Watkins H. Dear TN. A mutation in the mitochondrial fission gene Dnm1l leads to cardiomyopathy. PLoS Genet. 2010;6:e1001000. doi: 10.1371/journal.pgen.1001000. [DOI] [PMC free article] [PubMed] [Google Scholar]
- 3.Bach D. Pich S. Soriano FX. Vega N. Baumgartner B. Oriola J. Daugaard JR. Lloberas J. Camps M. Zierath JR. Rabasa-Lhoret R. Wallberg-Henriksson H. Laville M. Palacin M. Vidal H. Rivera F. Brand M. Zorzano A. Mitofusin-2 determines mitochondrial network architecture and mitochondrial metabolism. A novel regulatory mechanism altered in obesity. J Biol Chem. 2003;278:17190–17197. doi: 10.1074/jbc.M212754200. [DOI] [PubMed] [Google Scholar]
- 4.Benard G. Bellance N. James D. Parrone P. Fernandez H. Letellier T. Rossignol R. Mitochondrial bioenergetics and structural network organization. J Cell Sci. 2007;120:838–848. doi: 10.1242/jcs.03381. [DOI] [PubMed] [Google Scholar]
- 5.Brookes PS. Mitochondrial H(+) leak and ROS generation: an odd couple. Free Radic Biol Med. 2005;38:12–23. doi: 10.1016/j.freeradbiomed.2004.10.016. [DOI] [PubMed] [Google Scholar]
- 6.Cipolat S. De Brito OM. Dal Zilio B. Scorrano L. OPA1 requires mitofusin 1 to promote mitochondrial fusion. Proc Natl Acad Sci U S A. 2004;101:15927–15932. doi: 10.1073/pnas.0407043101. [DOI] [PMC free article] [PubMed] [Google Scholar]
- 7.Chance B. Williams GR. Respiratory enzymes in oxidative phosphorylation. III. The steady state. J Biol Chem. 1955;217:409–427. [PubMed] [Google Scholar]
- 8.Chen H. Chan DC. Emerging functions of mammalian mitochondrial fusion and fission. Hum Mol Genet. 2005;14(Spec No. 2):R283–R289. doi: 10.1093/hmg/ddi270. [DOI] [PubMed] [Google Scholar]
- 9.Chen H. Chomyn A. Chan DC. Disruption of fusion results in mitochondrial heterogeneity and dysfunction. J Biol Chem. 2005;280:26185–26192. doi: 10.1074/jbc.M503062200. [DOI] [PubMed] [Google Scholar]
- 10.Chen H. Detmer SA. Ewald AJ. Griffin EE. Fraser SE. Chan DC. Mitofusins Mfn1 and Mfn2 coordinately regulate mitochondrial fusion and are essential for embryonic development. J Cell Biol. 2003;160:189–200. doi: 10.1083/jcb.200211046. [DOI] [PMC free article] [PubMed] [Google Scholar]
- 11.de Brito OM. Scorrano L. Mitofusin 2 tethers endoplasmic reticulum to mitochondria. Nature. 2008;456:605–610. doi: 10.1038/nature07534. [DOI] [PubMed] [Google Scholar]
- 12.Desquiret V. Gueguen N. Malthiery Y. Ritz P. Simard G. Mitochondrial effects of dexamethasone imply both membrane and cytosolic-initiated pathways in HepG2 cells. Int J Biochem Cell Biol. 2008;40:1629–1641. doi: 10.1016/j.biocel.2007.12.010. [DOI] [PubMed] [Google Scholar]
- 13.Ellis CE. Murphy EJ. Mitchell DC. Golovko MY. Scaglia F. Barcelo-Coblijn GC. Nussbaum RL. Mitochondrial lipid abnormality and electron transport chain impairment in mice lacking alpha-synuclein. Mol Cell Biol. 2005;25:10190–10201. doi: 10.1128/MCB.25.22.10190-10201.2005. [DOI] [PMC free article] [PubMed] [Google Scholar]
- 14.Gandre-Babbe S. van der Bliek AM. The novel tail-anchored membrane protein Mff controls mitochondrial and peroxisomal fission in mammalian cells. Mol Biol Cell. 2008;19:2402–2412. doi: 10.1091/mbc.E07-12-1287. [DOI] [PMC free article] [PubMed] [Google Scholar]
- 15.Gaunitz F. Heise K. Gebhardt R. A silencer element in the first intron of the glutamine synthetase gene represses induction by glucocorticoids. Mol Endocrinol. 2004;18:63–69. doi: 10.1210/me.2003-0062. [DOI] [PubMed] [Google Scholar]
- 16.Gnaiger E. Capacity of oxidative phosphorylation in human skeletal muscle: new perspectives of mitochondrial physiology. Int J Biochem Cell Biol. 2009;41:1837–1845. doi: 10.1016/j.biocel.2009.03.013. [DOI] [PubMed] [Google Scholar]
- 17.Hoehn KL. Salmon AB. Hohnen-Behrens C. Turner N. Hoy AJ. Maghzal GJ. Stocker R. Van Remmen H. Kraegen EW. Cooney GJ. Richardson AR. James DE. Insulin resistance is a cellular antioxidant defense mechanism. Proc Natl Acad Sci U S A. 2009;106:17787–17792. doi: 10.1073/pnas.0902380106. [DOI] [PMC free article] [PubMed] [Google Scholar]
- 18.Hutter E. Renner K. Pfister G. Stockl P. Jansen-Durr P. Gnaiger E. Senescence-associated changes in respiration and oxidative phosphorylation in primary human fibroblasts. Biochem J. 2004;380:919–928. doi: 10.1042/BJ20040095. [DOI] [PMC free article] [PubMed] [Google Scholar]
- 19.Ishihara N. Eura Y. Mihara K. Mitofusin 1 and 2 play distinct roles in mitochondrial fusion reactions via GTPase activity. J Cell Sci. 2004;117:6535–6546. doi: 10.1242/jcs.01565. [DOI] [PubMed] [Google Scholar]
- 20.Ishihara N. Fujita Y. Oka T. Mihara K. Regulation of mitochondrial morphology through proteolytic cleavage of OPA1. EMBO J. 2006;25:2966–2977. doi: 10.1038/sj.emboj.7601184. [DOI] [PMC free article] [PubMed] [Google Scholar]
- 21.Ishihara N. Nomura M. Jofuku A. Kato H. Suzuki SO. Masuda K. Otera H. Nakanishi Y. Nonaka I. Goto YI. Taguchi N. Morinaga H. Maeda M. Takayanagi R. Yokota S. Mihara K. Mitochondrial fission factor Drp1 is essential for embryonic development and synapse formation in mice. Nat Cell Biol. 2009;11:958–966. doi: 10.1038/ncb1907. [DOI] [PubMed] [Google Scholar]
- 22.Liesa M. Borda-d'Agua B. Medina-Gomez G. Lelliott CJ. Paz JC. Rojo M. Palacin M. Vidal-Puig A. Zorzano A. Mitochondrial fusion is increased by the nuclear coactivator PGC-1beta. PLoS One. 2008;3:e3613. doi: 10.1371/journal.pone.0003613. [DOI] [PMC free article] [PubMed] [Google Scholar]
- 23.Liesa M. Palacin M. Zorzano A. Mitochondrial dynamics in mammalian health and disease. Physiol Rev. 2009;89:799–845. doi: 10.1152/physrev.00030.2008. [DOI] [PubMed] [Google Scholar]
- 24.Liu X. Hajnoczky G. Altered fusion dynamics underlie unique morphological changes in mitochondria during hypoxia-reoxygenation stress. Cell Death Differ. 2011;18:1561–1572. doi: 10.1038/cdd.2011.13. [DOI] [PMC free article] [PubMed] [Google Scholar]
- 25.Meeusen S. McCaffery JM. Nunnari J. Mitochondrial fusion intermediates revealed in vitro. Science. 2004;305:1747–1752. doi: 10.1126/science.1100612. [DOI] [PubMed] [Google Scholar]
- 26.Otera H. Wang C. Cleland MM. Setoguchi K. Yokota S. Youle RJ. Mihara K. Mff is an essential factor for mitochondrial recruitment of Drp1 during mitochondrial fission in mammalian cells. J Cell Biol. 2010;191:1141–1158. doi: 10.1083/jcb.201007152. [DOI] [PMC free article] [PubMed] [Google Scholar]
- 27.Parone PA. Da Cruz S. Tondera D. Mattenberger Y. James DI. Maechler P. Barja F. Martinou JC. Preventing mitochondrial fission impairs mitochondrial function and leads to loss of mitochondrial DNA. PLoS One. 2008;3:e3257. doi: 10.1371/journal.pone.0003257. [DOI] [PMC free article] [PubMed] [Google Scholar]
- 28.Patel R. Patel M. Tsai R. Lin V. Bookout AL. Zhang Y. Magomedova L. Li T. Chan JF. Budd C. Mangelsdorf DJ. Cummins CL. LXRbeta is required for glucocorticoid-induced hyperglycemia and hepatosteatosis in mice. J Clin Invest. 2011;121:431–441. doi: 10.1172/JCI41681. [DOI] [PMC free article] [PubMed] [Google Scholar]
- 29.Pich S. Bach D. Briones P. Liesa M. Camps M. Testar X. Palacin M. Zorzano A. The Charcot-Marie-Tooth type 2A gene product, Mfn2, up-regulates fuel oxidation through expression of OXPHOS system. Hum Mol Genet. 2005;14:1405–1415. doi: 10.1093/hmg/ddi149. [DOI] [PubMed] [Google Scholar]
- 30.Pilkis SJ. Granner DK. Molecular physiology of the regulation of hepatic gluconeogenesis and glycolysis. Annu Rev Physiol. 1992;54:885–909. doi: 10.1146/annurev.ph.54.030192.004321. [DOI] [PubMed] [Google Scholar]
- 31.Renner K. Amberger A. Konwalinka G. Kofler R. Gnaiger E. Changes of mitochondrial respiration, mitochondrial content and cell size after induction of apoptosis in leukemia cells. Biochim Biophys Acta. 2003;1642:115–123. doi: 10.1016/s0167-4889(03)00105-8. [DOI] [PubMed] [Google Scholar]
- 32.Roussel D. Dumas JF. Augeraud A. Douay O. Foussard F. Malthiery Y. Simard G. Ritz P. Dexamethasone treatment specifically increases the basal proton conductance of rat liver mitochondria. FEBS Lett. 2003;541:75–79. doi: 10.1016/s0014-5793(03)00307-7. [DOI] [PubMed] [Google Scholar]
- 33.Roussel D. Dumas JF. Simard G. Malthiery Y. Ritz P. Kinetics and control of oxidative phosphorylation in rat liver mitochondria after dexamethasone treatment. Biochem J. 2004;382:491–499. doi: 10.1042/BJ20040696. [DOI] [PMC free article] [PubMed] [Google Scholar]
- 34.Scheller K. Sekeris CE. The effects of steroid hormones on the transcription of genes encoding enzymes of oxidative phosphorylation. Exp Physiol. 2003;88:129–140. doi: 10.1113/eph8802507. [DOI] [PubMed] [Google Scholar]
- 35.Sebastian D. Hernandez-Alvarez MI. Segales J. Sorianello E. Munoz JP. Sala D. Waget A. Liesa M. Paz JC. Gopalacharyulu P. Oresic M. Pich S. Burcelin R. Palacin M. Zorzano A. Mitofusin 2 (Mfn2) links mitochondrial and endoplasmic reticulum function with insulin signaling and is essential for normal glucose homeostasis. Proc Natl Acad Sci U S A. 2012;109:5523–5528. doi: 10.1073/pnas.1108220109. [DOI] [PMC free article] [PubMed] [Google Scholar]
- 36.Shao J. Qiao L. Janssen RC. Pagliassotti M. Friedman JE. Chronic hyperglycemia enhances PEPCK gene expression and hepatocellular glucose production via elevated liver activating protein/liver inhibitory protein ratio. Diabetes. 2005;54:976–984. doi: 10.2337/diabetes.54.4.976. [DOI] [PubMed] [Google Scholar]
- 37.Smirnova E. Griparic L. Shurland DL. Van der Bliek AM. Dynamin-related protein Drp1 is required for mitochondrial division in mammalian cells. Mol Biol Cell. 2001;12:2245–2256. doi: 10.1091/mbc.12.8.2245. [DOI] [PMC free article] [PubMed] [Google Scholar]
- 38.Stadlmann S. Rieger G. Amberger A. Kuznetsov AV. Margreiter R. Gnaiger E. H2O2-mediated oxidative stress versus cold ischemia-reperfusion: mitochondrial respiratory defects in cultured human endothelial cells. Transplantation. 2002;74:1800–1803. doi: 10.1097/00007890-200212270-00029. [DOI] [PubMed] [Google Scholar]
- 39.Steinlechner-Maran R. Eberl T. Kunc M. Margreiter R. Gnaiger E. Oxygen dependence of respiration in coupled and uncoupled endothelial cells. Am J Physiol. 1996;271:C2053–C2061. doi: 10.1152/ajpcell.1996.271.6.C2053. [DOI] [PubMed] [Google Scholar]
- 40.Tondera D. Grandemange S. Jourdain A. Karbowski M. Mattenberger Y. Herzig S. Da Cruz S. Clerc P. Raschke I. Merkwirth C. Ehses S. Krause F. Chan DC. Alexander C. Bauer C. Youle R. Langer T. Martinou JC. SlP-2 is required for stress-induced mitochondrial hyperfusion. EMBO J. 2009;28:1589–1600. doi: 10.1038/emboj.2009.89. [DOI] [PMC free article] [PubMed] [Google Scholar]
- 41.Twig G. Elorza A. Molina AJ. Mohamed H. Wikstrom JD. Walzer G. Stiles L. Haigh SE. Katz S. Las G. Alroy J. Wu M. Py BF. Yuan J. Deeney JT. Corkey BE. Shirihai OS. Fission and selective fusion govern mitochondrial segregation and elimination by autophagy. EMBO J. 2008;27:433–446. doi: 10.1038/sj.emboj.7601963. [DOI] [PMC free article] [PubMed] [Google Scholar]
- 42.Wakabayashi J. Zhang Z. Wakabayashi N. Tamura Y. Fukaya M. Kensler TW. Iijima M. Sesaki H. The dynamin-related GTPase Drp1 is required for embryonic and brain development in mice. J Cell Biol. 2009;186:805–816. doi: 10.1083/jcb.200903065. [DOI] [PMC free article] [PubMed] [Google Scholar]
- 43.Waterham HR. Koster J. van Roermund CWT. Mooyer PAW. Wanders RJA. Leonard JV. A lethal defect of mitochondrial and peroxisomal fission. N Engl J Med. 2007;356:1736–1741. doi: 10.1056/NEJMoa064436. [DOI] [PubMed] [Google Scholar]
Associated Data
This section collects any data citations, data availability statements, or supplementary materials included in this article.