Abstract
The innate immune response to viral infection frequently includes induction of type I interferons (IFN), but many viruses have evolved ways to block this response and increase virulence. In vitro studies of IFN production after infection of susceptible cells with measles virus (MeV) have often reported greater IFN synthesis after infection with vaccine than with wild-type strains of MeV. However, the possible presence in laboratory virus stocks of 5′ copy-back defective interfering (DI) RNAs that induce IFN independent of the standard virus has frequently confounded interpretation of data from these studies. To further investigate MeV strain-dependent differences in IFN induction and the role of DI RNAs, monocyte-derived dendritic cells (moDCs) were infected with the wild-type Bilthoven strain and the vaccine Edmonston-Zagreb strain with and without DI RNAs. Production of type I IFN, type III IFN, and the interferon-stimulated genes (ISGs) Mx and ISG56 by infected cells was assessed with a flow cytometry-based IFN bioassay, quantitative reverse transcriptase PCR (RT-PCR), and immunoassays. Bilthoven infected moDCs less efficiently than Edmonston-Zagreb. Presence of DI RNAs in vaccine stocks resulted in greater maturation of moDCs, inhibition of virus replication, and induction of higher levels of IFN and ISGs. Production of type I IFN, type III IFN, and ISG mRNA and protein was determined by both the level of infection and the presence of DI RNAs. At the same levels of infection and in the absence of DI RNA, IFN induction was similar between wild-type and vaccine strains of MeV.
INTRODUCTION
Measles is a disease caused by measles virus (MeV) and remains a leading cause of childhood mortality, with approximately 164,000 deaths in 2008 (1). Infection is initiated in the respiratory tract and then spreads to the local lymph nodes and through the blood to cause systemic infection and a rash disease (2–6). MeV infection leads to weeks of immune suppression (7–9) that result in increased susceptibility to the secondary infections that are responsible for most measles-related deaths (10). Infection with a live-attenuated MeV vaccine induces protective immunity and does not result in clinically significant immune suppression (11–13).
Dendritic cells (DCs) are among the earliest cells infected by MeV (2, 3) and play an important role as a link between innate and adaptive immune responses. DCs recognize pathogen-associated molecular patterns through cell surface and intracellular receptors, such as Toll-like receptors and RNA helicases (14), which can lead to activation of transcription factors and induction of cytokines, such as type I (alpha interferon [IFN-α] and IFN-β) and type III (IFN-λ) interferon (15). DCs also initiate the adaptive immune response by presenting antigen to T cells (16, 17).
IFNs are an important component of the innate response to virus infection and use primarily JAK-STAT signaling to induce IFN-stimulated genes (ISGs), such as myxovirus resistance gene (Mx) and ISG56, also known as IFIT1. ISGs include genes encoding proteins that inhibit viral replication (15), and viruses have developed many ways to counteract IFN signaling. Two nonstructural proteins of MeV, V and C, regulate the IFN pathway by blocking induction of type I IFN and inhibiting JAK-STAT signaling (18–27).
Inhibition of IFN induction has been proposed as a possible contributor to the virulence and immune suppression of wild-type (WT) MeV (28), but studies of MeV induction of IFN have been conflicting. Some studies comparing IFN induction by vaccine and WT strains of MeV report that the vaccine virus induces higher levels of IFN than does the WT virus (29–31), while other studies do not see this difference (27, 32, 33). The sequences of the V and C protein genes are similar between vaccine and WT strains (23, 34, 35). In vivo studies have not detected IFN induction during measles (26, 36), and in vitro studies have often been confounded by the presence of defective interfering (DI) RNA particles in virus stocks (31, 32, 35, 37).
DI RNAs are most frequently produced during virus replication when the multiplicity of infection (MOI) or the passage of the standard virus is high (38). The 5′ copy-back form of DI RNA forms a hairpin RNA structure that is the prevalent form produced during paramyxovirus replication and is packaged similarly to the standard virus (39). DI RNA particles are postulated to interfere with the replication of the standard virus by competing for viral proteins in the infected cell (38). However, DI RNA particles are able to induce IFN independently of the standard virus through interaction with the RNA helicases RIG-I and MDA-5 (31), and their variable presence in virus stocks confounds studies of MeV strain-dependent IFN induction.
In this study, we assessed IFN production by primary monocyte-derived DCs after infection with WT and vaccine strains of MeV. The role of DI RNA particles was directly determined by comparing stocks of the same vaccine strain of virus with and without DI RNAs. The results demonstrate that in the absence of DI RNA and at the same level of monocyte-derived DC (moDC) infection, IFN is similarly minimally induced by both vaccine and WT strains of MeV.
MATERIALS AND METHODS
Cells.
Vero, Vero/hSLAM, and BHK cells were grown in Dulbecco's modified Eagle's medium (DMEM), and A549 cells (ATCC) were grown in Ham's F-12 medium. Media were supplemented with 10% fetal bovine serum (FBS), 50,000 units of penicillin/streptomycin, and 2 mM l-glutamine (Gibco). Cells were grown in 5% CO2 at 37°C.
Leucopacks from healthy adult anonymous donors (Johns Hopkins Hospital Blood Bank) were used for the isolation of peripheral blood mononuclear cells (PBMCs) by Ficoll-Paque PLUS (GE Healthcare) gradient centrifugation. Monocytes were isolated from PBMCs using anti-CD14 microbeads (MACS Miltenyi). T cells (CD3+) were isolated using a pan-T cell isolation kit, mDCs (BDCA-1+) were isolated using the CD11c+ DC isolation kit, and B cells were isolated using the CD19+ microbeads (MACS Miltenyi). Monocytes, B cells, and T cells were cultured at 1 million cells/ml of RPMI medium supplemented with 4% human serum type AB (Lonza), 1% penicillin/streptomycin, 1% 100 mM sodium pyruvate, and 1% 200 mM l-glutamine (RPMI complete). T cell medium contained 100 U/ml of interleukin 2 (IL-2) (R&D). Monocytes were differentiated into DCs using 1,000 U/ml of human IL-4 and 500 U/ml of human granulocyte-macrophage colony-stimulating factor (GM-CSF) (R&D Systems) and incubated for 6 days in 5% CO2 at 37°C. The moDC phenotype on day 6 was confirmed by flow cytometry to be CD14− CD11c+ HLA-DR+. Viability of cells was determined by trypan blue exclusion and live-dead staining (Invitrogen). At least 2 donors were used to calculate the mean values for each experiment.
Viruses and infection of cells.
The Edmonston-Zagreb (designated Edm) vaccine strain of MeV was grown and titers were determined by plaque formation in Vero cells. Two stocks were established. A DI-free stock was obtained by inoculation of Vero cells with a reconstituted dry powder vaccine (manufactured by the Serum Institute of India and dried by Aktiv-Dry LLC) at an MOI of 0.0001. The DI-containing Edm stock had been passaged multiple times at a low MOI. The Bilthoven WT strain of MeV was grown and titers were determined by plaque formation in Vero/hSLAM cells. Vesicular stomatitis virus expressing green fluorescent protein (VSV-GFP), a gift from Sean Whelan (Harvard Medical School), was grown and titers were determined by plaque formation in BHK cells. All virus stocks were free of mycoplasma.
moDCs were either mock infected or infected with MeV at an MOI of 0.4 or 4 for 1 h. Mock infections were performed by adding the same medium (RPMI complete) used for virus dilution. After washes, the cells were cultured for 24 or 48 h, and the cellular pellets and supernatant fluids were collected and stored at −80°C. A 50% tissue culture infective dose (TCID50) assay was used to determine MeV titers. Briefly, Vero or Vero/SLAM cells in 96-well plates were infected with serial dilutions of the supernatant fluids. Wells were assessed for cytopathic effects (CPE) after 3 to 5 days, and the TCID50 was calculated using the Reed-Muench formula.
Detection and sequencing of DI RNA.
Defective interfering (DI) RNA was detected as previously described (31, 40) using reverse transcriptase PCR (RT-PCR). Briefly, RNA was extracted from cell pellets using an RNeasy Plus microkit and from supernatant fluids using the QIAamp viral RNA minikit (Qiagen). cDNA synthesis from RNA was performed using the SuperScript III first-strand synthesis system (Invitrogen) according to the manufacturer's instructions. The primer sequences (31, 40) were as follows (Integrated DNA Technologies [IDT]): standard genome, 5′-TTTATCCAGAATCTCAARTCCGG-3′; DI RNA primer 1, 5′-TATAAGCTTACCAGACAAAGCTGGGAATAGAAACTTCG-3′; DI RNA primer 2, 5′-CGAAGATATTCTGGTGTAAGTCTAGTA-3′. The presence of these RNAs was assessed using agarose gel electrophoresis. For sequencing, the DI RNA RT-PCR product band (SuperScript III one-step RT-PCR kit; Life Technologies) was gel purified, cloned using the PCRII vector TOPO TA cloning kit (Life Technologies), and sequenced.
Real-time quantitative PCR.
RNA was isolated from moDCs using the RNeasy Plus microkit (Qiagen). TaqMan gene expression assays were used with the TaqMan RNA-to-CT 1-step kit by following the manufacturer's instructions (Applied Biosystems). Relative real-time quantitative RT-PCR (qRT-PCR) was performed for mRNAs of the following human genes: GAPDH (glyceraldehyde-3-phosphate dehydrogenase), IFN-β, IL-28, IL-29, ISG56 (IFIT1), and Mx1. GAPDH was used as the endogenous control. A power SYBR green RNA-to-CT 1-step kit (ABI) was used for the relative quantification of pan-IFN-α mRNAs by using the following primers (IDT): forward, GTGAGGAAATACTTCCAAAGAATCAC; reverse, TCTCATGATTTCTGCTCTGACAA.
Flow cytometry.
Standard surface and intracellular cytokine staining protocols were followed for flow cytometry. After infection, viability was determined using live-dead staining (Invitrogen). The cells were then washed with fluorescence-activated cell sorter (FACS) buffer (1% FBS in phosphate-buffered saline [PBS]) and stained using antibodies against the surface markers CD80, CD83, CD86, HLA-DR, and CD209 (BD Bioscience). The cells were then fixed and permeabilized by following instructions of the Cytofix/Cytoperm kit (BD Bioscience) and stained with antibody to the MeV nucleoprotein (N) (Abcam). The samples were run on a BD FACSCanto II flow cytometer and analyzed using FlowJo software.
IFN quantification and neutralization.
Before performing the IFN bioassay, MeV in supernatant fluids was inactivated by UV radiation for 75 s at 250 mJ and rested for at least 24 h before use. Supernatant fluids (50 μl/well) from either mock- or virus-infected cells (moDC or WI-38 cells) were added to confluent Vero cells in 96-well plates and incubated for 24 h. Cells were washed and then incubated with VSV-GFP at an MOI of 1. After 24 h, the cells were trypsinized and analyzed by flow cytometry to determine the percentage of GFP-positive cells. Each plate included a virus control (VSV-GFP alone) and a negative control (no supernatant fluid or VSV-GFP).
Recombinant IFN-α-2a, IFN-β, IFN-γ (PBL Interferon Source), IL-28a, IL-28b, and IL-29 (eBioscience) were applied in a range of 0.01 to 105 U/ml to determine the sensitivity of the bioassay for each type of IFN. IFN activity was quantified using serial 10-fold dilutions of the supernatant fluids. The dilution at which there was an increase in numbers of VSV-GFP-infected cells was compared with the IFN-α (IFN-α units) and IFN-β (IFN-β units) standard curves to determine the IFN concentration.
Neutralization of IFN activity was accomplished with IFN-α and IFN-β neutralizing antibodies (10,000 U/ml) or with type I IFN receptor (20 μg/ml) and type III IFN receptor (IL-10R1; 50 μg/ml) neutralizing antibodies (PBL Interferon Source). Supernatant fluids and mRNAs were collected for titration and real-time quantitative RT-PCR.
Supernatant fluids from mock-infected and MeV-infected moDCs were assessed for levels of IFN-α, IFN-β, IFN-λ, and IFN-ω proteins using the VeriPlex human cytokine 9-plex enzyme-linked immunosorbent assay (ELISA) kit (PBL Interferon Source) according to the manufacturer's instructions. Chemiluminescence was measured with a ChemiDoc XRS camera (Bio-Rad), and the data were analyzed using Q-View software.
Immunoblot analysis.
moDCs were lysed with radioimmunoprecipitation assay (RIPA) buffer (1% NP-40, 0.1% sodium dodecyl sulfate [SDS], 0.1% Na deoxycholate, 10 mM Tris-Cl [pH 7.0], 150 mM NaCl, 1 mM EDTA) with phosphatase inhibitor (Pierce) and protease inhibitor (Sigma) cocktails. Lysates were collected and stored at −80°C after centrifugation of the cells at 16,000 × g for 15 min. The total protein concentration was determined using the Bradford protein assay (Bio-Rad). A total of 10 μg of protein (per well) was denatured by boiling for 5 min in 6× cracking buffer (0.5 M Tris [pH 6.8], 30% glycerol, 10% SDS, 0.12% bromophenol blue, 6% β-mercaptoethanol). After denaturation, the proteins were electrophoresed in a precast 10% gel (Bio-Rad), followed by transfer to a nitrocellulose membrane. Antibodies to MX1 and IFIT1 (Abcam) were used at a dilution of 1:2,000, and anti-β-actin (Chemicon) was used at a dilution of 1:10,000. The secondary horseradish peroxidase-conjugated antibodies (anti-mouse and anti-rabbit IgG) were diluted 1:5,000.
RESULTS
Stocks of the vaccine but not the WT strain of MeV contain DI RNA and induce IFN production by moDCs.
To determine whether vaccine and WT strains of MeV differ in their ability to induce IFN production by moDCs, supernatant fluids were assayed for IFN activity 24 h after cells were infected with the Edmonston-Zagreb (Edm) strain or Bilthoven (Bilt) strain at an MOI of 4. Edm induced IFN, as indicated by inhibition of VSV-GFP infection of Vero cells, while Bilt did not (Fig. 1A). Statistically significant differences in IFN induction were also seen with primary mDCs (BDCA1+) and A549 cells but not with monocytes (CD14+), B cells (CD19+), basophils, or T cells (Fig. 1B to G).
Fig 1.
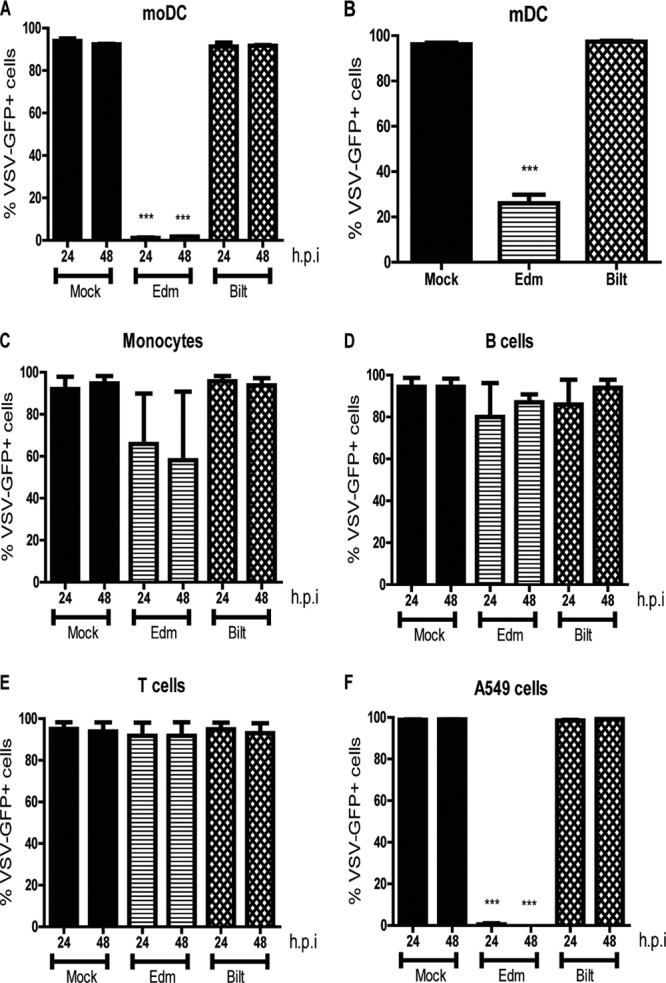
IFN production by various cell types after MeV infection. (A to G) Mock infection or infection with an Edm or Bilt strain of MeV at an MOI of 4 for moDCs (A), BDCA-1+ mDCs (B), monocytes (C), B cells (D), T cells (E), basophils (F), and A549 cells (G). Supernatant fluids were collected at 24 and 48 h postinfection, UV inactivated, and added to Vero cells. Vero cells were infected with VSV-GFP, and the percentage of VSV-GFP+ cells was determined by flow cytometry. Graphs show the mean ± the standard error of the mean (SEM) from 2 to 6 donors. ***, P value of <0.0005 for Edm compared to Bilt (Student's t test).
Because production of IFN after paramyxovirus infection can be complicated by the presence of DI RNA particles in virus stocks (31, 32, 35, 37), Edm and Bilt MeV stocks were tested for DI RNAs. Although both had been passaged at a low MOI (0.0001), the Edm stock contained DI RNA while the Bilt stock did not (Fig. 2A). The Edm DI RNA was sequenced and confirmed to be a 5′ copy-back DI RNA with a jump-off point at nucleotide 15716 (Fig. 2B). This Edm stock was designated Edm DI.
Fig 2.
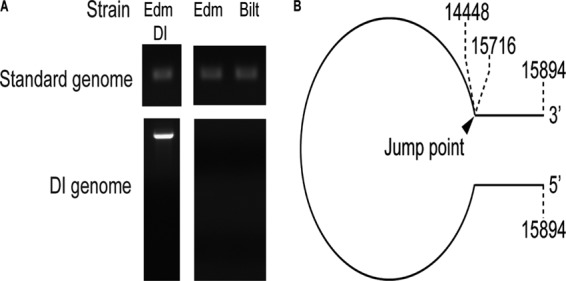
Presence of DI RNA in MeV stocks. (A) Stocks of MeV were tested for the presence of DI RNA with primers that detect the standard genome and primers that detect DI RNA. Results are shown for the stocks used for this study: two Edm stocks (one DI free and one with DI) and one DI-free Bilt stock. (B) Sequencing of the DI RNA from Edm DI confirmed a 5′ copy-back DI with a jump at nucleotide 15716.
Effect of DI particles on infection.
To determine the contribution of DI particles to MeV IFN induction, we developed a new stock of vaccine virus that did not contain detectable DI RNA (Edm). Dry powder vaccine stock negative for DI RNA was used to infect Vero cells at an MOI of 0.0001, and the resulting stock was confirmed to be negative for DI RNA. While all three virus stocks had the standard genome, only Edm DI had DI RNA (Fig. 2A).
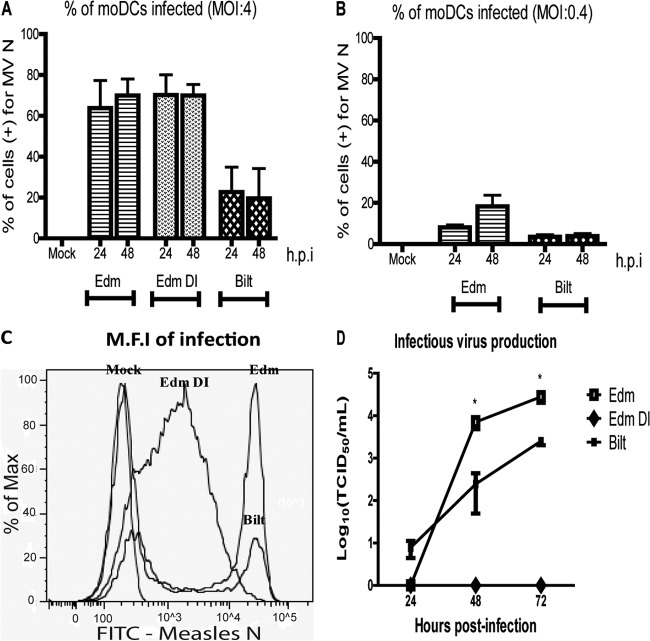
Edm, Edm DI, and Bilt were used to infect moDCs at an MOI of 0.4 or 4. At 24 and 48 h after infection, the percentages of viable cells were similar between infected and uninfected cells. To determine the percentage of cells infected, intracellular staining for the N protein was followed by flow cytometry. At an MOI of 4, approximately 80% of moDCs were infected by Edm and Edm DI at 24 and 48 h but only 35% were infected by Bilt (Fig. 3A). At an MOI of 0.4, Edm infected 14% of moDCs by 48 h while Bilt infected only 3% (Fig. 3B). These differences were not statistically significant due to high variability in infection levels between donors, but the pattern of higher infection by Edm than by Bilt was consistently observed.
Fig 3.
MeV infection of moDCs. (A to C) The percentage of moDCs infected at 24 and 48 h at an MOI of 4 (A) or 0.4 (B) was determined by staining for the MeV N protein and flow cytometry. (C) The level of viral protein production was determined by mean fluorescence intensity (M.F.I) of N protein staining. (D) Infectious virus produced was measured by a TCID50 assay. Graphs show the mean ± SEM from 2 donors. One-way analysis of variance (ANOVA) was used to compare the percentages of cells positive for MeV N. Student's t test was used to compare infectious virus titers. *, P value of <0.05 comparing Edm to Bilt at each time point.
Although Edm and Edm DI infected similar percentages of cells, levels of intracellular N protein were different. Edm- and Bilt-infected cells had a higher mean fluorescent intensity than Edm DI-infected cells (Fig. 3C) at both 24 and 48 h after infection. Edm and Bilt had two distinct negative and positive peaks for N intensity, while the positive Edm DI peak was wide. Thus, while similar numbers of cells were infected by Edm and Edm DI, there was a higher level of N protein production in Edm-infected cells. At an MOI of 4, Edm and Bilt also produced infectious virus while Edm DI did not (Fig. 3D). Edm-infected moDCs produced virus more slowly than Bilt, but titers at 48 and 96 h were significantly higher. At an MOI of 0.4, there was no detectable infectious virus produced by moDCs regardless of virus strain.
Edm- and Edm DI-infected moDCs have a more mature phenotype.
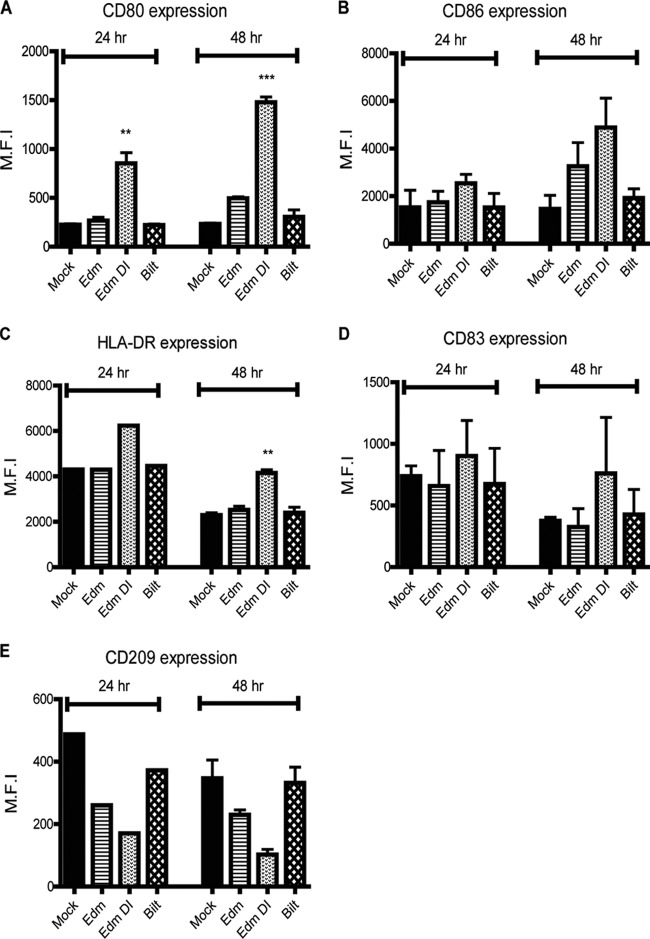
Immature moDCs mature following infection or addition of cytokines, such as IFN, IL-1-β, and tumor necrosis factor alpha (TNF-α). By 48 h, immature DCs infected with Edm, Edm DI, and Bilt increased surface expression of costimulatory molecules (CD80 and CD86) and major histocompatibility complex (MHC) class II (HLA-DR), with the greatest increase for Edm DI-infected cells (Fig. 4A to C). Mature DCs have higher expression of CD83 and lower expression of CD209 (DC-SIGN) than immature DCs. The expression of CD83 was higher in Edm DI-infected cells than in Edm- or Bilt-infected cells (Fig. 4D). Levels of CD209 were lowest in Edm DI-infected cells (Fig. 4E). These patterns were consistent among donors. In summary, Edm DI induced greater maturation of moDCs than Edm or Bilt.
Fig 4.
moDC maturation status after MeV infection. (A to E) moDCs were infected at an MOI of 4, and the levels of cell surface markers CD80 (A), CD86 (B), HLA-DR (C), CD83 (D), and CD209 (E) were determined. The mean fluorescent intensity (M.F.I.) of the maturation markers was determined by flow cytometry. Graphs show the mean ± SEM from 2 donors. One-way ANOVA with Bonferroni multiple-comparison tests was used to compare the levels of MeV-infected cells to those of mock-infected cells. *, P < 0.05; **, P < 0.005; ***, P < 0.0005.
Edm and Edm DI strains of MeV induce IFN after moDC infection.
When moDCs were infected at an MOI of 0.4, none of the strains induced detectable levels of IFN (Fig. 5A). In contrast, at an MOI of 4, both Edm- and Edm DI-infected moDCs produced IFN while the Bilt-infected moDCs did not (Fig. 5A). The amounts of IFN produced by Edm and Edm DI-infected moDCs were compared to recombinant IFN standards that are differentially detected by the Vero cell-based VSV-GFP bioassay (Fig. 6). The assay is most sensitive for detection of IFN-β and least sensitive for IFN-γ. The detection limit for IFN-β, IL-28a, and IL-28b was 1 to 10 U/ml, the range for IL-29 was 10 to 100 U/ml, and the range for IFN-α2a was 100 to 1,000 U/ml (Fig. 6). IFN-γ induction of antiviral activity was essentially not detectable in the bioassay (Fig. 6). Using IFN-α and IFN-β as standards for quantification, Edm DI-infected moDCs produced more IFN (3,736 U IFN-α equivalents/ml; 43 U IFN-β equivalents/ml) than Edm-infected moDCs (448 U IFN-α equivalents/ml; 24 U IFN-β equivalents/ml).
Fig 5.
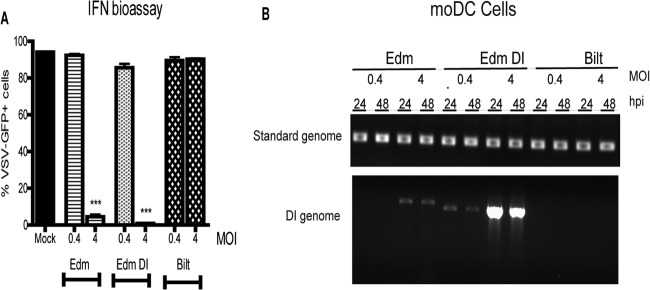
IFN production by moDCs after MeV infection. (A) Mock infection or infection with an Edm, Edm DI, or Bilt strain of MeV at an MOI of 0.4 or 4. IFN was detected by an IFN bioassay on supernatant fluids collected from moDCs at 24 h. The graph shows the mean ± SEM from two donors. One-way ANOVA with Bonferroni multiple-comparison tests was used to compare percentages of VSV-GFP-positive Vero cells. ***, P value of <0.0005 comparing Edm and Edm DI to Bilt. (B) RNA was isolated from infected moDC cell pellets and tested for the presence of DI RNA.
Fig 6.
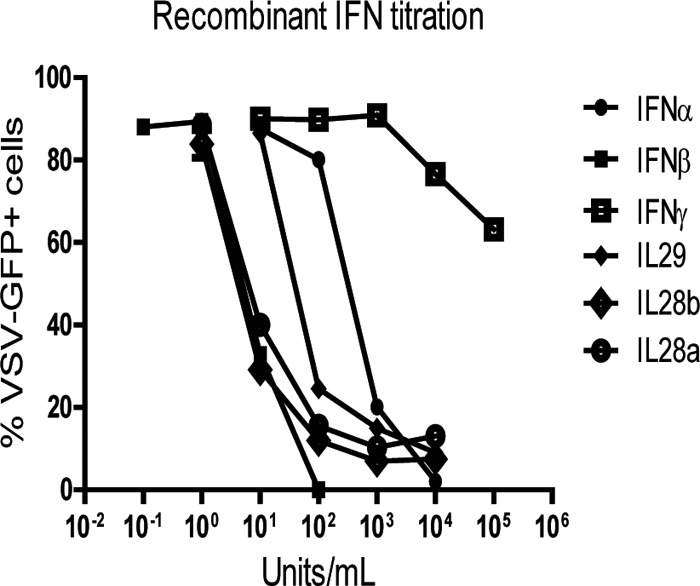
Sensitivity of Vero cell/VSV-GFP bioassays for detection of different types of IFN. The recombinant human IFNs IFN-α, IFN-β, IFN-γ, IL-28A, IL-28B, and IL-29 in the concentration range of 0.01 to 100,000 U/ml were applied to Vero cells for 24 h prior to challenge with VSV-GFP. Percentages of GFP-positive cells were determined by flow cytometry 24 h later.
When cells are infected at a high MOI, DI RNAs may be formed even if the parent stock is DI free. Because moDCs infected with Edm at a high MOI but not those infected at a low MOI produced detectable levels of IFN, we assessed the cells for DI RNA after infection. No DI RNA was detected in cells after low-MOI infections with either Edm or Bilt. However, the moDCs infected with the high-MOI Edm (DI free) produced detectable DI RNA within 24 h (Fig. 5B). As expected, DI RNA was detected in the low-MOI as well as the high-MOI Edm DI-infected moDCs.
Type I and type III IFN gene expression and protein levels upregulated in moDCs after MeV infection.
Using the IFN bioassay, no IFN was detected after low- or high-MOI Bilt infections. It is possible that moDCs were making IFN after WT infection that was not detected by the bioassay due to an autocrine consumption of IFN by the producing cells or due to low sensitivity of the bioassay for the type of IFN produced (Fig. 6).
We therefore assessed the mRNA levels of IFNs and ISGs in moDCs normalized to a reference gene (GAPDH cycle threshold [CT] value of 21) by qRT-PCR before (Fig. 7) and after (Fig. 8 and 9) infection. To determine relative fold change compared to the baseline, a CT value of 50 was assigned to genes that were not expressed at baseline. Pan-IFN-α primers that detect all 14 subtypes were used to detect IFN-α mRNA. In uninfected moDCs, IFN-α and IFN-β mRNAs were constitutively expressed (normalized CT values of 1.56 to 1.58) while IL-28 and IL-29 were not expressed (normalized CT value of 2.34) (Fig. 7). ISG Mx mRNA was constitutively expressed at high levels (normalized CT of 1.25), and ISG56 mRNA was expressed at somewhat lower levels (normalized CT of 1.59) (Fig. 7).
Fig 7.
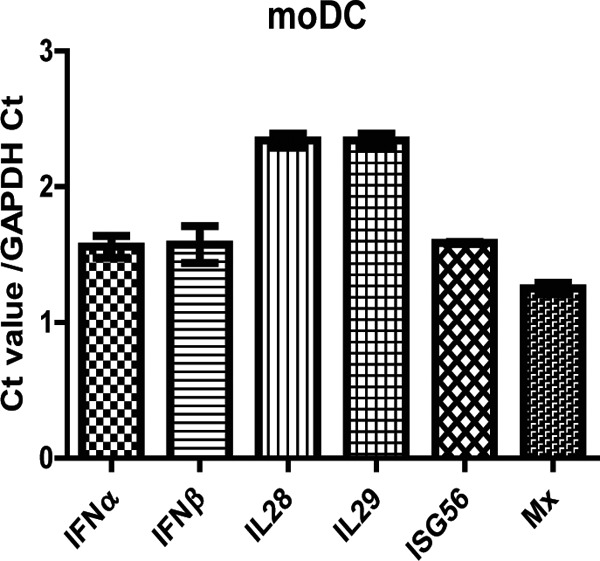
Baseline levels of IFN and ISG mRNAs in mock-infected moDCs. Quantitative RT-PCR was performed for the following genes: IFN-α, IFN-β, IL-28, IL-29, Mx, and ISG56. Graphs show the mean ± SEM from 2 donors of the cycle threshold (CT) values normalized to GADPH. A value of 50 was assigned to undetectable mRNAs.
Fig 8.
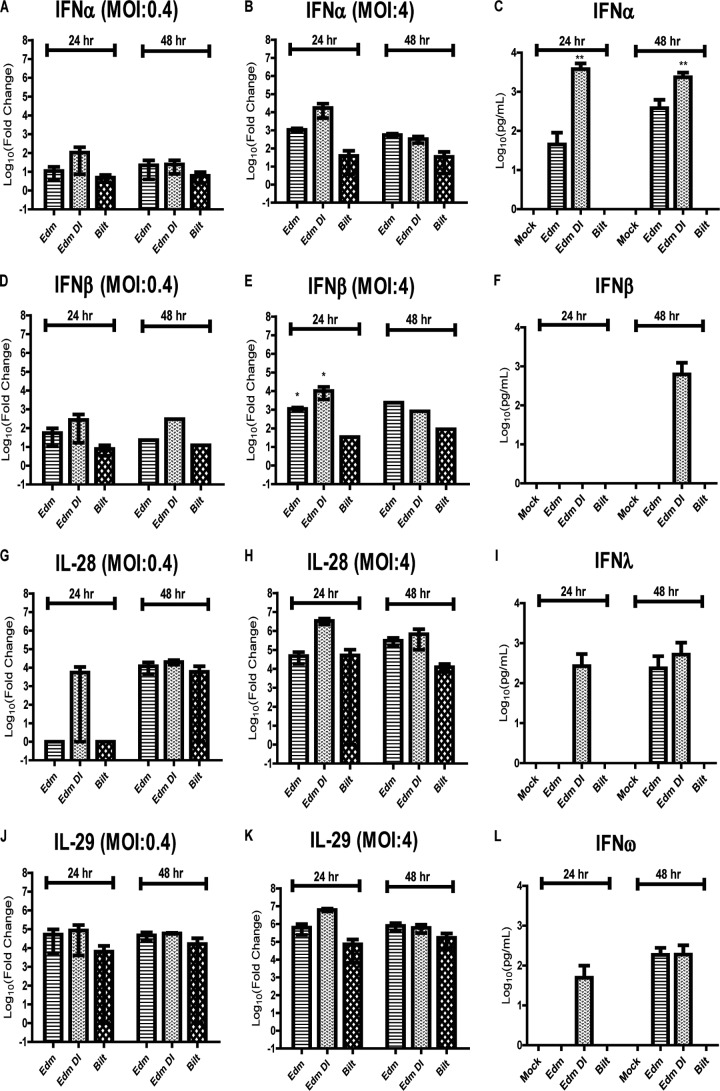
IFN mRNA and protein expression levels after MeV infection. RNA was isolated from cells infected with MeV at an MOI of 0.4 (A, D, G, and J) or 4 (B, E, H, and K). qRT-PCR was performed for the following gene mRNAs: IFN-α (A and B), IFN-β (D and E), IL-28 (G and H), and IL-29 (J and K). Graphs show the mean log10 fold change ± SEM of the CT values compared to mock-infected cells from 2 donors. (C, F, I, and L) Multiplex ELISA performed on the supernatant fluids from moDCs infected at an MOI of 4 to determine the protein levels of IFN-α (C), IFN-β (F), IFN-λ (I), and IFN-ω (L). Graphs show the mean log10 concentration (pg/ml) ± SEM from 3 donors. *, P < 0.05; ***, P < 0.0005. One-way ANOVA with Bonferroni multiple-comparison tests for comparing Edm and Edm DI to Bilt.
Fig 9.
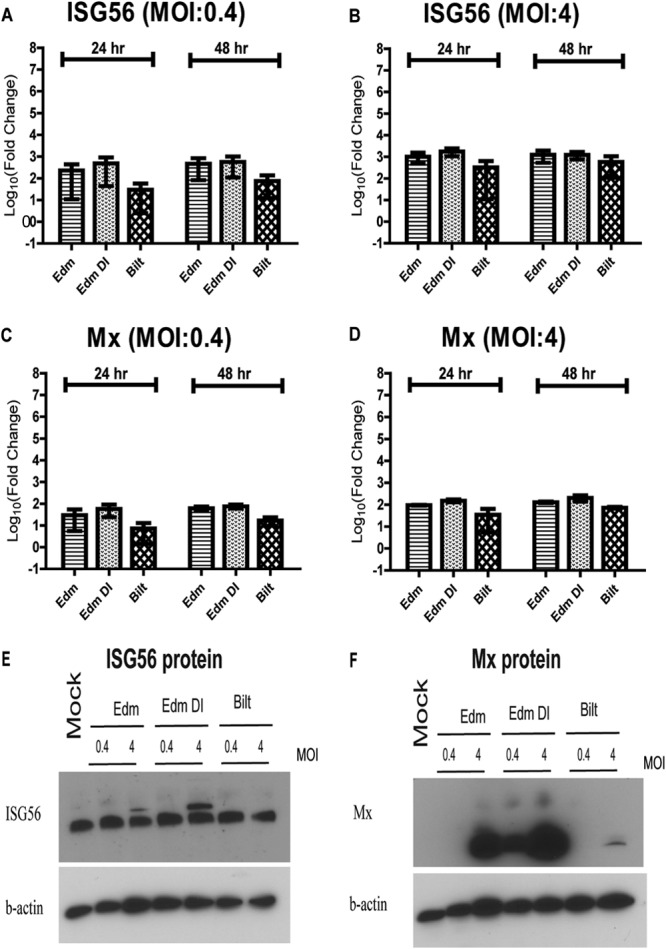
ISG levels after MeV infection. (A to D) RNA was isolated from moDCs infected with MeV at an MOI of 0.4 or 4. qRT-PCR was performed for ISG56 (A and B) and Mx (C and D) gene mRNAs. Graphs show the mean log10 fold change ± SEM from 2 donors of the CT values compared to mock-infected cells. No significant differences were identified (one-way ANOVA with Bonferroni multiple-comparison tests). (E and F) Immunoblots for ISG56 (E) and Mx (F) protein levels after MeV infection.
To determine if IFN mRNAs were being induced by infection even when protein was not detected by a bioassay, we examined expression of both type I and type III IFN mRNAs after infection. IFN-α mRNA was induced in moDCs by Edm, Edm DI, and Bilt after infection at an MOI of 0.4 or 4. At 24 h, Edm DI induced the highest levels of IFN-α mRNA, followed by Edm and Bilt (Fig. 8A and B). At 48 h, there was a similar strain-dependent pattern, although the differences in IFN-α mRNA levels were reduced (Fig. 8A and B). The mRNA levels were much higher at an MOI of 4 than at an MOI of 0.4. Similar strain- and MOI-dependent patterns were also seen for IFN-β, IL-28 (IL-28A and IL-28B), and IL-29 mRNAs (Fig. 8D, E, G, H, J, and K). Similar to a previous report that DI RNAs induce IFN very rapidly (31), high levels of IFN-α, IFN-β, IL-28, and IL-29 mRNAs were observed by 12 h with Edm DI at an MOI of 4 and as early as 2 h for IFN-β (2,593-fold increase), IL-28 (73,070-fold increase), and IL-29 (2,330,164-fold increase).
IFN protein levels were assessed in supernatant fluids from mock-infected and MeV-infected moDCs using a multiplex ELISA kit. No IFN-α, IFN-β, IFN-λ, or IFN-ω protein was detected in supernatant fluids of mock-infected or 0.4-MOI MeV-infected moDCs at 24 or 48 h. Following infection at an MOI of 4, IFN-α was detected at 24 and 48 h with Edm and Edm DI but not Bilt (Fig. 8C). IFN-β was detected at 48 h with Edm DI at an MOI of 4 (Fig. 8F). IFN-λ and IFN-ω proteins were detected at 24 h only after infection with Edm DI at an MOI of 4 and by 48 h with both Edm and Edm DI (Fig. 8I and L).
ISG induction in infected moDCs.
Because both type I and type III IFN mRNAs were induced after MeV infection, we measured mRNA levels of ISGs expected to be induced by IFN. Both Mx and ISG56 mRNAs were induced after infection of moDCs at an MOI of 0.4 or 4 with all of the strains (Fig. 9A to D). Similar to the IFN mRNA, there was a strain- and MOI-dependent pattern. At an MOI of 0.4 or 4, Edm DI-infected cells had higher levels of Mx and ISG56 mRNAs at 24 h than Edm-infected cells or Bilt-infected cells that had the lowest levels (Fig. 9A to D). Again, at 48 h, the ISG mRNA levels were similar between Edm and Edm DI while Bilt induced lower levels.
To determine if protein was produced, we assessed ISG protein levels by immunoblot. Interestingly, despite differences in mRNA levels, baseline levels of ISG56 protein were similar in uninfected cells and infected cells (Fig. 9E). However, after Edm and Edm DI infections with an MOI of 4, a second, higher-molecular-weight band was also present. In contrast to ISG56, Mx protein was not present in mock-infected cells. With infection at an MOI of 0.4, only Edm DI-infected cells produced detectable levels of Mx protein (Fig. 9F). At an MOI of 4, Edm DI-infected cells produced the highest levels of Mx protein, followed by Edm-infected cells, while Bilt-infected cells produced little to no Mx protein (Fig. 9F).
Type I IFNs induce ISGs in infected moDCs.
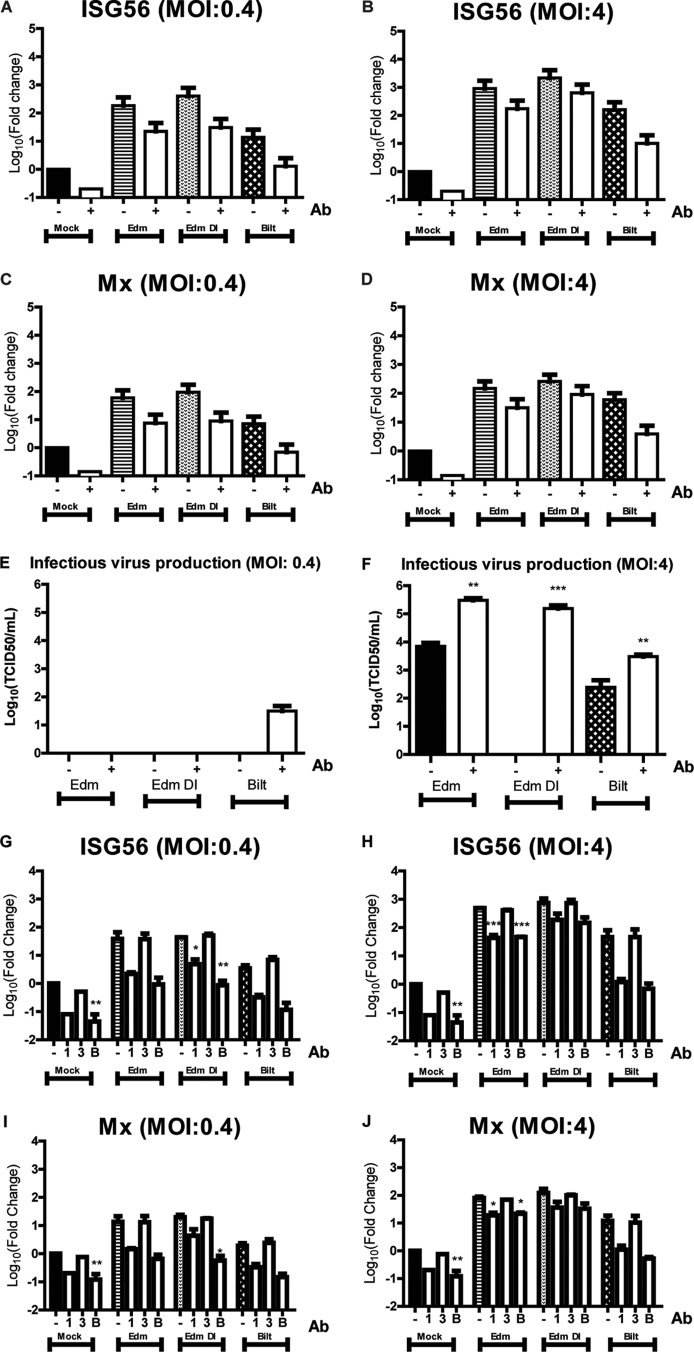
While Mx and ISG56 are generally thought to be exclusively induced by IFN, recent studies have suggested that certain ISGs can be induced independent of IFN signaling (41). To determine whether Mx and ISG56 mRNAs were induced solely by IFN, infected moDCs were cultured with neutralizing antibodies for IFN-α and IFN-β for 24 h. If the induction of ISGs were independent of IFN, then this neutralization would not affect ISG levels. For all of the strains with an MOI of 0.4 or 4, there was a reduction in Mx and ISG56 mRNA expression when type I IFN was neutralized (Fig. 10A to D). Interestingly, the mock-infected cells also expressed lower levels of ISGs in the presence of neutralizing antibodies, suggesting constitutive production of IFN by moDCs.
Fig 10.
Levels of ISG expression and virus production after infection of moDCs in the presence of IFN neutralizing antibodies. (A to F) moDCs infected by MeV at an MOI of 0.4 or 4 in the presence of IFN-α and IFN-β neutralizing antibodies. mRNA levels of ISG56 (A and B) and Mx (C and D) compared to those in mock-infected cells. (E and F) Production of infectious virus. (G to J) moDCs were infected by MeV at an MOI of 0.4 or 4 in the presence of antibodies against type I IFN receptor only (1), type III IFN receptor only (3), both antibodies (B), or no antibodies (−). mRNA levels of ISG56 (G and H) and Mx (I and J) compared to those of mock-infected cells without neutralizing antibodies. Graphs show the mean log10 fold change ± SEM from 2 donors of the CT values compared to mock-infected cells. *, P < 0.05; **, P < 0.005; ***, P < 0.0005. Student's t tests or one-way ANOVA with Bonferroni multiple-comparison tests was used to compare the mRNA fold changes and virus titers to the no-antibody control.
Neutralization of type I IFN for the low-MOI Edm- and Edm DI-infected cells did not improve infectious virus production at 48 h (Fig. 10E). In contrast, there was an increase in production of infectious virus by low-MOI Bilt-infected cells in the presence of type I IFN neutralizing antibodies (Fig. 10E). With infection at an MOI of 4, there was a significant increase in infectious virus production for Edm, Edm DI, and Bilt in the presence of type I IFN neutralizing antibodies (Fig. 10F). This suggests that constitutive production of low levels of IFN-α/β in the cultures inhibits MeV production. Interestingly, high-MOI infection of moDCs by Edm DI produced virus levels comparable to those of Edm in the presence of neutralizing antibodies while there was no infectious virus detected without IFN neutralization. As DI particles have an inhibitory effect on the standard virus production, these data suggest that this inhibitory effect is likely explained largely by the IFN induced by DI RNAs.
To determine if blocking type III IFN activity would reduce ISG expression, we used receptor-blocking antibodies against type I IFN receptor alone, type III IFN receptor alone, or both receptors. In mock-infected and infected moDCs, blocking type III IFN receptor alone did not decrease ISG levels (Fig. 10G to J). Blocking both type I and type III receptors decreased ISG mRNA expression to a similar level as blocking type I receptor alone (Fig. 10G to J). This suggests that Mx and ISG56 mRNAs are induced primarily by type I IFN. This is consistent with lower levels of baseline IFN-λ mRNA (although the fold change is high after infection) (Fig. 7 and 8) than of IFN-α and IFN-β mRNAs.
Similar levels of IFN induced by Edm and Bilt when infection levels are equal.
Because Edm infects moDCs more efficiently than Bilt at the same MOI (Fig. 3B and C), we next assessed IFN induction when infection levels were the same. moDCs were infected with Edm or Bilt to achieve a 5% infection level, and the IFN and ISG mRNA levels were assessed. The mRNA levels induced by the two strains at the same levels of infection were not significantly different for IFN-α, IFN-β, IL-28, IL-29, Mx, or ISG56 (Fig. 11A to F).
Fig 11.
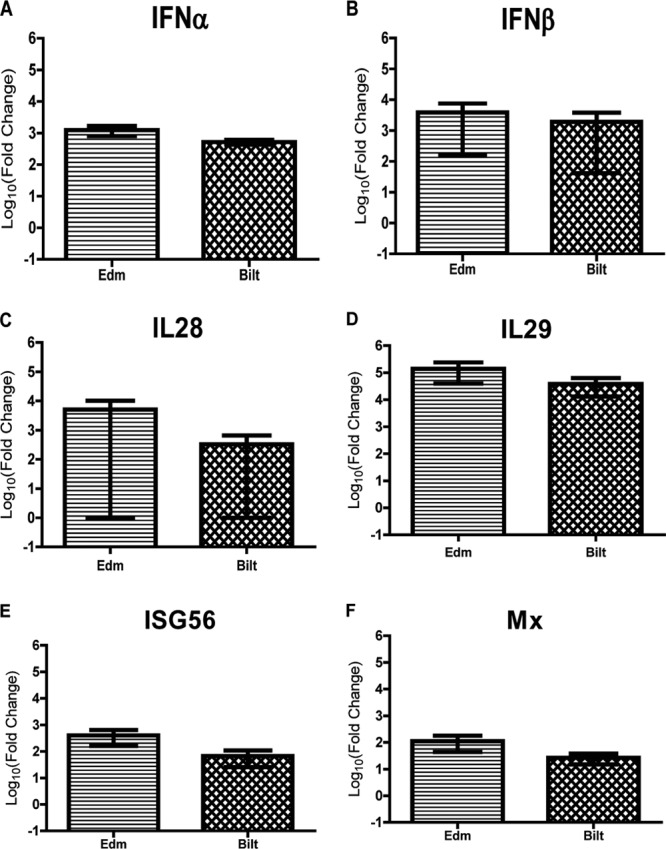
IFN and ISG mRNA levels in moDCs infected with Edm and Bilt at similar levels. (A to E) RNA was isolated from moDCs with 5% of cells infected with Edm or Bilt. qRT-PCR was performed comparing mRNA levels to those of mock-infected cells for IFN-α (A), IFN-β (B), IL-28 (C), IL-29 (D), Mx (E), and ISG56 (F). Graphs show the mean log10 fold change ± SEM from 2 donors of the CT values compared to mock-infected cells. No significant differences were identified between Edm and Bilt for any of the genes (Student's t test).
DISCUSSION
In this study, we have shown that moDCs were less-efficiently infected by a WT strain of MeV than by a vaccine strain but that production of WT infectious virus was more rapid. IFN-α and -β mRNAs were constitutively produced by moDCs, and IFN-α, -β, and -λ mRNAs were induced after infection with both the WT and vaccine strains of MeV. Direct comparison of vaccine virus stocks with and without DI RNAs showed that DIs induced high levels of IFN-α, -β, and -λ mRNAs, resulting in lower virus replication and greater DC maturation. Levels of IFN mRNA were lower after WT MeV infection, but when adjusted for level of infection, induction of IFN and ISG mRNAs was similar. Therefore, these studies have shown no difference in induction of IFN by infection of moDCs with vaccine and WT strains of MeV as long as levels of infection were comparable and the presence of DI RNA was controlled for.
More-efficient infection of moDCs with Edm than with Bilt may be partly explained by MeV receptor availability on immature DCs (30). There is universal expression of the CD46 receptor used by Edm but limited expression of the SLAM/CD150 receptor required for Bilt infection (42). Previous studies comparing infectious virus production after vaccine and WT infection of moDCs are conflicting. One study showed greater virus production by WT MeV (43), and another study showed similar virus production by vaccine and WT strains (44). In our study, Bilt-infected moDCs produced more virus at 24 h, but by 48 h, Edm-infected cells produced more infectious virus.
Both vaccine and WT MeV were able to induce the expression of type I IFN, type III IFN, and ISG mRNAs to a limited extent. DCs induce IFN-λ mRNA after infection with influenza and Sendai viruses (45). To our knowledge, this is the first study showing the induction of type III IFN by MeV-infected DCs. Edm induced higher levels of IFN mRNA than did Bilt, and this difference was reflected in IFN-α, IFN-λ, IFN-ω, and Mx protein levels. These differences in IFN protein levels between the strains correlate with one study (31), but another study that used a lower MOI did not see differences in IFN-α or IFN-β protein levels (30). Surprisingly, despite differences in IFN-β and ISG56 mRNA levels, there were no differences in protein levels in infected and uninfected moDCs (except at 48 h with Edm DI for IFN-β). While IFN-β protein is not expressed before or after infection, ISG56 is expressed basally and does not increase after infection. A discrepancy between IFN-β mRNA and protein levels was previously reported for MeV infection of moDCs (30). Basal expression of ISG56 has been reported for uninfected macrophages (46).
Our IFN bioassay results also showed differences in levels of functional IFN induced by different MeV strains. However, no functional IFN (in contrast to mRNA and immunoblot data) was detected after infection with Bilt. This might be due to IFN being made below the detection limit of a bioassay, as there is only a faint immunoblot band after Bilt infection for Mx protein, which inhibits VSV replication used for the bioassay as well as MeV (47, 48). While Bilt induced less IFN than Edm in moDCs, Bilt had lower levels of infection. When levels of infection were adjusted, there was similar induction of IFN and ISG mRNAs. Thus, differences in infection levels at least partly explained the differences in IFN production by the WT and vaccine strains of MeV.
DI RNAs played a major role in the induction of IFN by MeV-infected moDCs. Despite low-MOI passage, we detected DI RNA in most of our vaccine stocks and some WT stocks, including the stock of the Chicago-1 strain used for a previous transcriptional analysis of moDC infection with MeV (49). Therefore, it is important that the presence or absence of DI RNAs be documented for any studies of IFN induction by MeV. The presence of DI RNA in Edm stocks did not affect its ability to infect moDCs but did affect MeV replication. Both expression of N protein and production of infectious virus were decreased.
A lack of infectious virus production after Edm DI infection may be explained in part by interference with standard virus replication (38), but blocking the activity of IFN indicates that induction of type I IFN, type III IFN, and ISGs is probably more important. IFN neutralizing antibodies increased production of infectious virus after Edm DI infection from undetectable levels to levels comparable to those of DI-free Edm.
The moDCs infected with Edm DI were more mature. Increased maturation by DI particles has also been documented with another paramyxovirus, Sendai virus (50, 51). Because DI RNA particles interfere with standard virus replication, induce high levels of IFN, and enhance maturation of DCs, they have been proposed as possible vaccine candidates (52) or adjuvants (50). Further research would be needed before moving forward with such an approach.
In summary, we have shown that there is essentially no difference in IFN induction in moDCs by infection with the Edmonston-Zagreb vaccine and Bilthoven WT strains of MeV. Analysis of cellular responses to infection and virus production requires control for the presence of DI RNAs in the MeV stocks used for infection.
ACKNOWLEDGMENTS
This work was supported by a research grant from the Bill and Melinda Gates Foundation (to D.E.G.), research grant R01 AI23047 (to D.E.G.) and training grant T32 AI07417 (to R.S.) from the National Institutes of Health, and a Katharine Welsh student fellowship (to M.S.).
Footnotes
Published ahead of print 15 May 2013
REFERENCES
- 1. World Health Organization 2009. Global reductions in measles mortality 2000-2008 and the risk of measles resurgence. Wkly. Epidemiol. Rec. 84:509–516 [PubMed] [Google Scholar]
- 2. de Swart RL, Ludlow M, De Witte L, Yanagi Y, Van Amerongen G, McQuaid S, Yüksel S, Geijtenbeek TBH, Duprex WP, Osterhaus ADME. 2007. Predominant infection of CD150+ lymphocytes and dendritic cells during measles virus infection of macaques. PLoS Pathog. 3:e178. 10.1371/journal.ppat.0030178 [DOI] [PMC free article] [PubMed] [Google Scholar]
- 3. Ferreira CSA, Frenzke M, Leonard VHJ, Welstead GG, Richardson CD, Cattaneo R. 2010. Measles virus infection of alveolar macrophages and dendritic cells precedes spread to lymphatic organs in transgenic mice expressing human signaling lymphocytic activation molecule (SLAM, CD150). J. Virol. 84:3033–3042 [DOI] [PMC free article] [PubMed] [Google Scholar]
- 4. Moussallem TM, Guedes F, Fernandes ER, Pagliari C, Lancellotti CLP, De Andrade HF, Duarte MIS. 2007. Lung involvement in childhood measles: severe immune dysfunction revealed by quantitative immunohistochemistry. Hum. Pathol. 38:1239–1247 [DOI] [PubMed] [Google Scholar]
- 5. Plaza JA, Nuovo GJ. 2005. Histologic and molecular correlates of fatal measles infection in children. Diagn. Mol. Pathol. 14:97–102 [DOI] [PubMed] [Google Scholar]
- 6. Moench TR, Griffin DE, Obriecht CR, Vaisberg AJ, Johnson RT. 1988. Acute measles in patients with and without neurological involvement: distribution of measles virus antigen and RNA. J. Infect. Dis. 158:433–442 [DOI] [PubMed] [Google Scholar]
- 7. Hirsch RL, Griffin DE, Johnson RT, Cooper SJ, Lindo de Soriano I, Roedenbeck S, Vaisberg A. 1984. Cellular immune responses during complicated and uncomplicated measles virus infections of man. Clin. Immunol. Immunopathol. 31:1–12 [DOI] [PubMed] [Google Scholar]
- 8. Tamashiro VG, Perez HH, Griffin DE. 1987. Prospective study of the magnitude and duration of changes in tuberculin reactivity during uncomplicated and complicated measles. Pediatr. Infect. Dis. J. 6:451–454 [DOI] [PubMed] [Google Scholar]
- 9. Ward BJ, Johnson RT, Vaisberg A, Jauregui E, Griffin DE. 1991. Cytokine production in vitro and the lymphoproliferative defect of natural measles virus infection. Clin. Immunol. Immunopathol. 61:236–248 [DOI] [PubMed] [Google Scholar]
- 10. Beckford AP, Kaschula RO, Stephen C. 1985. Factors associated with fatal cases of measles. A retrospective autopsy study. S. Afr. Med. J. 68:858–863 [PubMed] [Google Scholar]
- 11. Ward BJ, Griffin DE. 1993. Changes in cytokine production after measles virus vaccination: predominant production of IL-4 suggests induction of a Th2 response. Clin. Immunol. Immunopathol. 67:171–177 [DOI] [PubMed] [Google Scholar]
- 12. Hussey GD, Goddard EA, Hughes J, Ryon JJ, Kerran M, Carelse E, Strebel PM, Markowitz LE, Moodie J, Barron P, Latief Z, Sayed R, Beatty D, Griffin DE. 1996. The effect of Edmonston-Zagreb and Schwarz measles vaccines on immune response in infants. J. Infect. Dis. 173:1320–1326 [DOI] [PubMed] [Google Scholar]
- 13. Fireman P, Friday G, Kumate J. 1969. Effect of measles vaccine on immunologic responsiveness. Pediatrics 43:264–272 [PubMed] [Google Scholar]
- 14. Takeuchi O, Akira S. 2010. Pattern recognition receptors and inflammation. Cell 140:805–820 [DOI] [PubMed] [Google Scholar]
- 15. Stetson DB, Medzhitov R. 2006. Type I interferons in host defense. Immunity 25:373–381 [DOI] [PubMed] [Google Scholar]
- 16. Banchereau J, Steinman RM. 1998. Dendritic cells and the control of immunity. Nature 392:245–252 [DOI] [PubMed] [Google Scholar]
- 17. Mellman I, Steinman RM. 2001. Dendritic cells: specialized and regulated antigen processing machines. Cell 106:255–258 [DOI] [PubMed] [Google Scholar]
- 18. Yokota S, Saito H, Kubota T, Yokosawa N, Amano K, Fujii N. 2003. Measles virus suppresses interferon-alpha signaling pathway: suppression of Jak1 phosphorylation and association of viral accessory proteins, C and V, with interferon-alpha receptor complex. Virology 306:135–146 [DOI] [PubMed] [Google Scholar]
- 19. Caignard G, Bouraï M, Jacob Y, Tangy F, Vidalain P-O. 2009. Inhibition of IFN-alpha/beta signaling by two discrete peptides within measles virus V protein that specifically bind STAT1 and STAT2. Virology 383:112–120 [DOI] [PubMed] [Google Scholar]
- 20. Takeuchi K, Kadota S, Takeda M, Miyajima N, Nagata K. 2003. Measles virus V protein blocks interferon (IFN)-α/β but not IFN-γ signaling by inhibiting STAT1 and STAT2 phosphorylation. FEBS Lett. 545:177–182 [DOI] [PubMed] [Google Scholar]
- 21. Sparrer KMJ, Pfaller CK, Conzelmann K-K. 2012. Measles virus C protein interferes with beta interferon transcription in the nucleus. J. Virol. 86:796–805 [DOI] [PMC free article] [PubMed] [Google Scholar]
- 22. Caignard G, Guerbois M, Labernardière J-L, Jacob Y, Jones LM, Wild F, Tangy F, Vidalain P-O. 2007. Measles virus V protein blocks Jak1-mediated phosphorylation of STAT1 to escape IFN-alpha/beta signaling. Virology 368:351–362 [DOI] [PubMed] [Google Scholar]
- 23. Fontana JM, Bankamp B, Bellini WJ, Rota PA. 2008. Regulation of interferon signaling by the C and V proteins from attenuated and wild-type strains of measles virus. Virology 374:71–81 [DOI] [PubMed] [Google Scholar]
- 24. Nakatsu Y, Takeda M, Ohno S, Shirogane Y, Iwasaki M, Yanagi Y. 2008. Measles virus circumvents the host interferon response by different actions of the C and V proteins. J. Virol. 82:8296–8306 [DOI] [PMC free article] [PubMed] [Google Scholar]
- 25. Palosaari H, Parisien J, Rodriguez JJ, Ulane CM, Horvath CM. 2003. STAT protein interference and suppression of cytokine signal transduction by measles virus V protein STAT protein interference and suppression of cytokine signal transduction by measles virus V protein. J. Virol. 77:7635–7644 [DOI] [PMC free article] [PubMed] [Google Scholar]
- 26. Devaux P, Hodge G, McChesney MB, Cattaneo R. 2008. Attenuation of V- or C-defective measles viruses: infection control by the inflammatory and interferon responses of rhesus monkeys. J. Virol. 82:5359–5367 [DOI] [PMC free article] [PubMed] [Google Scholar]
- 27. Pfaller CK, Conzelmann K-K. 2008. Measles virus V protein is a decoy substrate for IκB kinase alpha and prevents Toll-like receptor 7/9-mediated interferon induction. J. Virol. 82:12365–12373 [DOI] [PMC free article] [PubMed] [Google Scholar]
- 28. Oldstone MBA. 2006. Viral persistence: parameters, mechanisms and future predictions. Virology 344:111–118 [DOI] [PubMed] [Google Scholar]
- 29. Naniche D, Yeh A, Eto D, Manchester M, Friedman RM, Oldstone MB. 2000. Evasion of host defenses by measles virus: wild-type measles virus infection interferes with induction of alpha/beta interferon production. J. Virol. 74:7478–7484 [DOI] [PMC free article] [PubMed] [Google Scholar]
- 30. Duhen T, Herschke F, Azocar O, Druelle J, Plumet S, Delprat C, Schicklin S, Wild TF, Rabourdin-Combe C, Gerlier D, Valentin H. 2010. Cellular receptors, differentiation and endocytosis requirements are key factors for type I IFN response by human epithelial, conventional and plasmacytoid dendritic infected cells by measles virus. Virus Res. 152:115–125 [DOI] [PubMed] [Google Scholar]
- 31. Shingai M, Ebihara T, Begum NA, Kato A, Honma T, Matsumoto K, Saito H, Ogura H, Matsumoto M, Seya T. 2007. Differential type I IFN-inducing abilities of wild-type versus vaccine strains of measles virus. J. Immunol. 179:6123–6133 [DOI] [PubMed] [Google Scholar]
- 32. Kessler JR, Kremer JR, Muller CP. 2011. Interplay of measles virus with early induced cytokines reveals different wild type phenotypes. Virus Res. 155:195–202 [DOI] [PubMed] [Google Scholar]
- 33. Schlender J, Hornung V, Finke S, Marozin S, Brzózka K, Moghim S, Endres S, Hartmann G, Conzelmann K, Gu M, Brzo K. 2005. Inhibition of Toll-like receptor 7- and 9-mediated alpha/beta interferon production in human plasmacytoid dendritic cells by respiratory syncytial virus and measles virus. J. Virol. 79:5507–5515 [DOI] [PMC free article] [PubMed] [Google Scholar]
- 34. Seya T. 2011. Addendum to “Strain-to-strain difference of V protein of measles virus affects MDA5-mediated IFN-β-inducing potential” [Mol. Immunol. 48(4) (2011) 497-504]. Mol. Immunol. 48:1589–1590 [DOI] [PubMed] [Google Scholar]
- 35. Takaki H, Watanabe Y, Shingai M, Oshiumi H, Matsumoto M, Seya T. 2011. Strain-to-strain difference of V protein of measles virus affects MDA5-mediated IFN-β-inducing potential. Mol. Immunol. 48:497–504 [DOI] [PubMed] [Google Scholar]
- 36. Zilliox MJ, Moss WJ, Griffin DE. 2007. Gene expression changes in peripheral blood mononuclear cells during measles virus infection. Clin. Vaccine Immunol. 14:918–923 [DOI] [PMC free article] [PubMed] [Google Scholar]
- 37. Bellocq C, Mottet G, Roux L. 1990. Wide occurrence of measles virus subgenomic RNAs in attenuated live-virus vaccines. Biologicals 18:337–343 [DOI] [PubMed] [Google Scholar]
- 38. Perrault J. 1981. Origin and replication of defective interfering particles. Curr. Top. Microbiol. Immunol. 93:151–207 [DOI] [PubMed] [Google Scholar]
- 39. Lazzarini RA, Keene JD, Schubert M. 1981. The origins of defective interfering particles of the negative-strand RNA viruses. Cell 26:145–154 [DOI] [PubMed] [Google Scholar]
- 40. Calain P, Curran J, Kolakofsky D, Roux L. 1992. Molecular cloning of natural paramyxovirus copy-back defective interfering RNAs and their expression from DNA. Virology 191:62–71 [DOI] [PubMed] [Google Scholar]
- 41. Bego MG, Mercier J, Cohen EA. 2012. Virus-activated interferon regulatory factor 7 upregulates expression of the interferon-regulated BST2 gene independently of interferon signaling. J. Virol. 86:3513–3527 [DOI] [PMC free article] [PubMed] [Google Scholar]
- 42. Yanagi Y, Takeda M, Ohno S. 2006. Measles virus: cellular receptors, tropism and pathogenesis. J. Gen. Virol. 87:2767–2779 [DOI] [PubMed] [Google Scholar]
- 43. Ohgimoto K, Ohgimoto S, Ihara T, Mizuta H, Ishido S, Ayata M, Ogura H, Hotta H. 2007. Difference in production of infectious wild-type measles and vaccine viruses in monocyte-derived dendritic cells. Virus Res. 123:1–8 [DOI] [PubMed] [Google Scholar]
- 44. Fugier-Vivier I, Servet-Delprat C, Rivailler P, Rissoan MC, Liu YJ, Rabourdin-Combe C. 1997. Measles virus suppresses cell-mediated immunity by interfering with the survival and functions of dendritic and T cells. J. Exp. Med. 186:813–823 [DOI] [PMC free article] [PubMed] [Google Scholar]
- 45. Coccia EM, Severa M, Giacomini E, Monneron D, Remoli ME, Julkunen I, Cella M, Lande R, Uzé G. 2004. Viral infection and Toll-like receptor agonists induce a differential expression of type I and lambda interferons in human plasmacytoid and monocyte-derived dendritic cells. Eur. J. Immunol. 34:796–805 [DOI] [PubMed] [Google Scholar]
- 46. Daffis S, Samuel MA, Keller BC, Gale M, Diamond MS. 2007. Cell-specific IRF-3 responses protect against West Nile virus infection by interferon-dependent and -independent mechanisms. PLoS Pathog. 3:e106. 10.1371/journal.ppat.0030106 [DOI] [PMC free article] [PubMed] [Google Scholar]
- 47. Schneider-Schaulies S, Schneider-Schaulies J, Schuster A, Bayer M, Pavlovic J, Ter Meulen V. 1994. Cell type-specific MxA-mediated inhibition of measles virus transcription in human brain cells. J. Virol. 68:6910–6917 [DOI] [PMC free article] [PubMed] [Google Scholar]
- 48. Schnorr JJ, Schneider-Schaulies S, Simon-Jödicke A, Pavlovic J, Horisberger MA, ter Meulen V. 1993. MxA-dependent inhibition of measles virus glycoprotein synthesis in a stably transfected human monocytic cell line. J. Virol. 67:4760–4768 [DOI] [PMC free article] [PubMed] [Google Scholar]
- 49. Zilliox MJ, Parmigiani G, Griffin DE. 2006. Gene expression patterns in dendritic cells infected with measles virus compared with other pathogens. Proc. Natl. Acad. Sci. U. S. A. 103:3363–3368 [DOI] [PMC free article] [PubMed] [Google Scholar]
- 50. Yount JS, Kraus TA, Horvath CM, Moran TM, López CB. 2006. A novel role for viral-defective interfering particles in enhancing dendritic cell maturation. J. Immunol. 177:4503–4513 [DOI] [PubMed] [Google Scholar]
- 51. Yount JS, Gitlin L, Moran TM, López CB. 2008. MDA5 participates in the detection of paramyxovirus infection and is essential for the early activation of dendritic cells in response to Sendai virus defective interfering particles. J. Immunol. 180:4910–4918 [DOI] [PubMed] [Google Scholar]
- 52. Scott PD, Meng B, Marriott AC, Easton AJ, Dimmock NJ. 2011. Defective interfering virus protects elderly mice from influenza. Virol. J. 8:212. [DOI] [PMC free article] [PubMed] [Google Scholar]


