Abstract
Epstein-Barr Virus (EBV) generates a variety of viral microRNAs (miRNAs) by processing the BHRF1 and BamHI A rightward (BART) transcripts. BART miRNAs are expressed in all cells latently infected with EBV, but the functions of most BART miRNAs remain unknown. The results of a cell proliferation assay revealed that miR-BART15-3p inhibited cell proliferation. Fluorescence-activated cell sorting following staining with annexin V or propidium iodide showed that miR-BART15-3p promoted apoptosis. Furthermore, the inhibitor for miR-BART15-3p increased cell growth and reduced apoptosis in EBV-infected cells. Using bioinformatic analyses, we predicted that miR-BART15-3p may target the antiapoptotic B-cell lymphoma 2 (BCL2), BCL2L2, DEAD (Asp-Glu-Ala-Asp) box polypeptide 42 (DDX42), and baculovirus inhibitor of apoptosis repeat-containing ubiquitin-conjugating enzyme (BRUCE) mRNAs. The luciferase reporter assay showed that only the 3′ untranslated region (UTR) of BRUCE was affected by miR-BART15-3p. Two putative seed-matched sites for miR-BART15-3p were evident on the BRUCE 3′ UTR. The results of a mutation study indicated that miR-BART15-3p hybridized only with the first seed-matched site on the BRUCE 3′ UTR. miR-BART15-3p downregulated the BRUCE protein in EBV-negative cells, while the inhibitor for miR-BART15-3p upregulated the BRUCE protein in EBV-infected cells without affecting the BRUCE mRNA level. miR-BART15-3p was secreted from EBV-infected gastric carcinoma cells, and the level of miR-BART15-3p was 2- to 16-fold higher in exosomes than in the corresponding cells. Our data suggest that miR-BART15-3p can induce apoptosis partially by inhibiting the translation of the apoptosis inhibitor BRUCE. Further study is warranted to understand the role of miR-BART15-3p in the EBV life cycle.
INTRODUCTION
MicroRNAs (miRNAs) are small noncoding RNAs approximately 19 to 25 nucleotides in length that can modulate gene expression in multiple species. Primary miRNA transcripts are processed consecutively by the enzymes Drosha and Dicer. Mature miRNAs function as negative gene regulators through complementary sequence pairing to the 3′ untranslated region (3′ UTR) of the target gene (1).
Epstein-Barr virus (EBV) is a herpesvirus which infects more than 90% of the adult population and which has transforming activity (2). It establishes latent infection in most people and is closely associated with a variety of malignancies, including Burkitt's lymphoma (3), Hodgkin's disease, gastric carcinoma, nasopharyngeal carcinoma, and nasal natural killer/T-cell lymphoma (2). There are three types of latency in EBV infections depending on the expression patterns of the latent proteins (4). EBV-encoded RNAs (EBERs) and BamHI A rightward transcripts (BARTs) are expressed in all three latency types (4, 5). EBV expresses 25 different pre-microRNAs (6–8). BamHI fragment H rightward open reading frame 1 (BHRF1) miRNAs processed mainly from the long transcripts of the Epstein-Barr virus nuclear antigen (EBNA) are expressed in latency type III, while 22 pre-miRNAs generated from the BART transcripts are detected in most EBV-associated tumors and cell lines (8–11).
The functions of several EBV BART miRNAs have been identified. miR-BART5-5p reduces the expression of p53 upregulated modulator of apoptosis (PUMA), a proapoptotic protein, resulting in increased cell survival (12). miR-BART1-5p, miR-BART16-5p, and miR-BART17-5p decrease the expression of latent membrane protein 1 (LMP1), which usually triggers cell growth and transformation but inhibits cell growth and potentiates apoptosis when overexpressed (13). miR-BART22-3p targets latent membrane protein 2A (LMP2A) of EBV to contribute to immune evasion but does not affect cell proliferation and apoptosis (14). miR-BART2-5p downregulates the EBV DNA polymerase BALF5 to produce persistent EBV latency (15) and the natural killer cell ligand MICB, which enables evasion of the immune response (16). The expression of Dicer, which is associated with miRNA biogenesis, is decreased by miR-BART6-5p (17). BART cluster 1 and 2 miRNAs inhibit the expression of proapoptotic Bim to reduce apoptosis. However, which specific BART miRNA targets Bim is unclear (18). The functions of the majority of the BART miRNAs remain unknown.
As part of a larger effort to determine the function of each individual BART miRNA, a total of 44 BART miRNA mimics were prepared and transfected into AGS (gastric adenocarcinoma) cells. Unexpectedly, unlike the majority of the BART miRNAs, a few BART miRNAs increased apoptosis and inhibited cell proliferation. The functional mechanism of miR-BART15-3p, which showed the strongest apoptotic activity among the BART miRNAs, was further investigated.
MATERIALS AND METHODS
Cell lines.
AGS is an EBV-negative gastric cancer (GC) cell line, while AGS-EBV is an AGS cell line infected with a recombinant Akata virus. AGS and SNU-719 cells were cultured in RPMI 1640 (Gibco BRL, Grand Island, NY) supplemented with 10% fetal bovine serum (FBS) and antibiotics (100 U/ml penicillin and 100 μg/ml streptomycin; Gibco BRL). AGS-EBV was maintained in the culture medium containing 400 μg/ml G418 (Gibco BRL).
Transfection of miRNA mimic and LNA-miRNA inhibitor.
All the BART miRNA mimics and the scrambled control, which was used as a negative control, were purchased from Genolution Pharmaceuticals (Seoul, South Korea). The locked nucleic acid (LNA)-miR-BART15-3p inhibitor and the negative control LNA-miRNA inhibitor were purchased from Exiqon (Vedbaek, Denmark). All transfection experiments were performed using Lipofectamine 2000 (Invitrogen, Carlsbad, CA) according to the manufacturer's protocol. Protein or RNA was extracted 48 h after transfection.
Cell proliferation assay.
Cell proliferation was analyzed using cell counting kit 8 (CCK-8; Dojindo Molecular Technologies, Tokyo, Japan). AGS cells (1 × 10³ cells/well) were seeded in a 96-well plate and transfected with each BART miRNA (10 nM) or the scrambled control (10 nM). AGS-EBV cells (1 × 10³ cells/well) were plated in a 96-well plate and transfected with LNA-miR-BART15-3p inhibitor (50 nM) or the negative control (50 nM). After 72 h of incubation, 10 μl of CCK-8 solution was added to each well. The absorbance was measured after 2 h using a SoftMax apparatus (Molecular Devices, Sunnyvale, CA) at a wavelength of 450 nm.
Annexin V staining.
Cells were washed with cold phosphate-buffered saline (PBS) and resuspended in 500 μl annexin V binding buffer (PE annexin V apoptosis detection kit; BD Biosciences, San Diego, CA), containing phycoerythrin (PE)-labeled annexin V and 7-amino-actinomycin (7-AAD). Annexin V was used to label cells undergoing apoptosis by detecting phosphatidylserine (PS) on the outer plasma membrane, while 7-AAD was used to detect dead cells. After incubating for 10 min at room temperature in an area shielded from light, the specimens were analyzed by fluorescence-activated cell sorting (FACS) using a FACSCalibur apparatus (BD Biosciences), acquiring 10,000 events. Cells positive for annexin V and negative for 7-AAD were considered to be undergoing early apoptosis.
Sub-G1 population analysis using propidium iodide (PI) staining.
Cells were harvested, washed with PBS, and fixed in 70% ethanol at −20°C overnight. The cells were washed twice with PBS and then resuspended in PBS containing 10 μg/ml RNase A (Invitrogen) and 50 μg/ml PI (Sigma-Aldrich, St. Louis, MO). The distribution of cells in each phase of the cell cycle was analyzed using a FACSCalibur apparatus (BD Biosciences) as described previously (19).
Plasmid constructs.
The full-length 3′ UTR of each putative miR-BART15-3p target gene was amplified from the genomic DNA of AGS-EBV cells and cloned into the XhoI/NotI sites between the Renilla luciferase coding sequence and the poly(A) site of the psiCHECK-2 plasmid (Promega, Madison, WI). The primers used for the amplification were as follows: for baculovirus inhibitor of apoptosis repeat-containing ubiquitin-conjugating enzyme, (BRUCE); 5′-CCGCTCGAGTGCATTGATGTGGACTTCATAGA-3′ and 5′-ATAAGAATGCGGCCGCAAATGAGCCTGTATGGCAGGT-3′; for B-cell lymphoma 2 (BCL2), 5′-CCGCTCGAGCCCTGGCCTGAAGAAGAGAC-3′ and 5′-ATAAGAATGCGGCCGCAGGGACGAGGAAACCTTCAA-3′; for BCL2L2, 5′-CCGCTCGAGGTTCTCTGTCCCTCCTCCCA-3′ and 5′-ATAAGAATGCGGCCGCTGCAGCTCCTCTTGGCTAAA-3′; for DEAD (Asp-Glu-Ala-Asp) box polypeptide 42 (DDX42), 5′-CCGCTCGAGAGGGGATGTGCTAAAGCGT-3′ and 5′-ATAAGAATGCGGCCGCCCCGGTAGTAAAACATTTACTAGA-3′. Mutations to the seed sequences of psiC-BRUCE were introduced using an EZchange site-directed mutagenesis kit (Enzynomics, Daejeon, South Korea). The primers used for the amplification were as follows: for BRUCEm1, 5′-TGGTATGTTCAACAAATTTGTGTATACAAAG-3′ and 5′-AAGTGTCGTTCTCACAATTGAAAAATAAAAG-3′; for BRUCEm2, 5′-TTTGATAGATTTTATGTTTGGCCATATCTTCATG-3′ and 5′-TAGTGTCAAAAGTTGCTGACTTTAAATAGTAGTTG-3′.
Luciferase reporter assay.
To test the effect of miR-BART15-3p on the expression of putative target genes, HEK293T cells were seeded in a 96-well plate (5 × 10³ cells/well). After 24 h, the cells were cotransfected with the psiCHECK reporter vector containing the 3′ UTR fragment of the putative target gene and miR-BART15-3p or the mutated miR-BART15-3p (miR-BART15-3pm). To test the effect of an inhibitor of miR-BART15-3p on the luciferase activity of psiC-BRUCE in EBV-infected gastric carcinoma cell lines, AGS-EBV and SNU-719 were seeded in a 96-well plate (5 × 10³ cells/well). After 24 h, the cells were cotransfected with the psiC-BRUCE reporter vector and the LNA-miR-BART15-3p inhibitor. Luciferase activities were measured 48 h posttransfection using the Dual-Glo luciferase reporter assay system (Promega). Renilla luciferase activity was normalized using firefly luciferase activity for each sample.
Quantitative reverse transcription-PCR (qRT-PCR).
AGS and AGS-EBV cells were harvested, and total RNA was extracted using the RNAzol B reagent (Tel-Test, Friendswood, TX) according to the manufacturer's instructions. cDNA was synthesized using 1 μg total RNA, oligo(dT) (Ahram Biosystems, Seoul, South Korea), and Moloney murine leukemia virus (M-MLV) reverse transcriptase (Invitrogen). Real-time PCR for the indicated genes was carried out using a SYBR green qPCR kit (TaKaRa, Tokyo, Japan) with a Mx3000P real-time PCR system (Stratagene, La Jolla, CA). The sequences of the primers were as follows: for BRUCE, 5′-CTTGGTCTGAACACGAAAGACA-3′ and 5′-TCCATCCGTACAAGGAAACTGT-3′; for glyceraldehyde phosphate dehydrogenase (GAPDH), 5′-CATGAGAAGTATGACAACAGCCT-3′ and 5′-AGTCCTTCCACGATACCAAAGT-3′. The PCR conditions were 95°C for 10 min, followed by 40 cycles at 95°C for 30 s, 60°C for 30 s, and 72°C for 30 s. For the dissociation curve, reaction mixtures were incubated at 95°C for 10 s and ramped up from 60°C to 95°C with a heating rate of 0.1°C/s, and fluorescence was measured continuously. Relative gene expression was calculated according to the comparative Ct method using GAPDH as an internal standard.
Stem-loop real-time PCR for miRNA analysis.
Real-time reverse transcription quantitative PCR (qRT-PCR) reagent kits were purchased from Applied Biosystems (Foster City, CA). The kit includes TaqMan assays for EBV-miR-BART15-3p and a control assay (RNU6B), the TaqMan microRNA reverse transcription kit, and UNG-free TaqMan universal PCR master mix II. All TaqMan assays were performed using a two-step procedure. First, single-stranded cDNA synthesis from total RNA was performed using the reverse transcription kit. Briefly, for each 7 μl of reverse transcription (RT) master mixture, 0.15 μl of 100 mM concentrations of deoxynucleoside triphosphates (dNTPs), 1 μl of MultiScribe reverse transcriptase, 1.5 μl of 10× RT buffer, 0.19 μl of RNase inhibitor, and 4.16 μl of nuclease-free water were combined. A 7-μl portion of RT master mixture was then combined in a fresh tube with 5 μl total RNA (1 ng) and 3 μl RT primer (specific to each TaqMan assay). The RT reactions were then performed in a DNA Engine thermal cycler (Bio-Rad Laboratories, Hercules, CA) programmed to incubate the reaction mixtures at 16°C for 30 min, 42°C for 30 min, and 85°C for 5 min. In the second step, TaqMan qRT-PCR assays were carried out using a Mx3000P real-time PCR system (Stratagene). Each qRT-PCR was performed in a 20 μl volume containing 10 μl of TaqMan universal PCR master mix II, 1 μl of 20× TaqMan miRNA assay mix, 8 μl of RNase-free water, and 1 μl single-stranded cDNA product. Three replicates were used for each sample. Relative gene expression was calculated according to the comparative cycle threshold (CT) method using RNU6B as an internal standard.
Small interfering RNA (siRNA)-specific knockdown of BRUCE expression.
siRNA specific for BRUCE (siBRUCE) was synthesized by Genolution Pharmaceuticals (Seoul, South Korea). A negative-control siRNA lacking any known gene product was purchased from Genolution Pharmaceuticals. AGS cells at 30 to 50% confluence were transfected with 10 nM siRNA using Lipofectamine 2000 (Invitrogen) in 60-mm-diameter dishes. The cells were harvested 48 h after transfection to analyze BRUCE expression.
Western blotting.
To detect the BRUCE protein, the cell lysate in radioimmunoprecipitation assay (RIPA) buffer (50 μg) was mixed with NuPAGE LDS sample buffer (4×) and heated at 70°C for 10 min. The samples were electrophoretically separated on precast 3 to 8% NuPAGE Novex Tris-acetate gels (Invitrogen), and the separated proteins were transferred to a nitrocellulose membrane (Invitrogen). Rabbit polyclonal antibody against BRUCE (Abcam, Cambridge, United Kingdom) was used as the primary antibody at a dilution of 1:1,000. After a washing, the blots were incubated with horseradish peroxidase-conjugated anti-rabbit secondary antibody (Amersham Biosciences, Piscataway, NJ) at a dilution of 1:1,000 for 2 h at room temperature. Protein bands were visualized using an enhanced chemiluminescence detection system (Amersham Biosciences). β-Actin antibody (Cell Signaling Technology, Danvers, MA) was used to confirm comparable loading.
Exosome isolation and characterization.
Cells were cultured for 48 h with RPMI containing 10% FBS. To avoid contamination with the bovine serum exosome, FBS was predepleted of exosome by ultracentrifugation at 150,000 × g for 16 h at 4°C. The cell culture medium was collected after 48 h and concentrated by ultracentrifugation using the QuixStand benchtop system (Amersham) with a 100-kDa hollow fiber membrane (Amersham Biosciences). To remove the remaining cell debris, the concentrated culture medium was sequentially centrifuged at 500 × g for 5 min and then at 3,000 × g for 20 min at 4°C. The concentrated medium was then ultracentrifuged in a 70Ti rotor (Beckman Instruments, Fullerton, CA) at 100,000 × g for 2 h at 4°C, and the pelleted exosome was resuspended with 1× PBS. Exosomes were stored at −70°C before RNA extraction or Western blot analysis (20).
To characterize the exosomes, proteins of whole-cell lysates (50 μg) and exosomes (1 μg) were separated by SDS-PAGE and transferred to polyvinylidene difluoride (PVDF) membranes (Thermo Fisher Scientific, Rockford, IL). The blocked membrane was incubated with the indicated antibodies. The immunoreactive bands were visualized using enhanced chemiluminescence substrate (GE Healthcare, Buckinghamshire, United Kingdom).
Transmission electron microscopy (TEM).
The purified exosomes were applied to glow-discharged carbon-coated copper grids (EMS, Matfield, PA). After the exosomes had been allowed to be absorbed onto the grid for 3 min, the grids were rinsed with droplets of deionized water and negatively stained with 2% uranylacetate (Ted Pella, Redding, CA). Electron micrographs were recorded with a JEM 1011 microscope (JEOL, Tokyo, Japan) at an acceleration voltage of 100 kV (21).
Statistical analyses.
The data were analyzed using one-way repeated-measure analysis of variance (ANOVA) or Student's t test. Curve fit and analysis were performed using GraphPad Prism (GraphPad Software, San Diego, CA). P values of <0.05 were considered statistically significant. All results are expressed as means ± standard deviations (SD).
RESULTS
BART miRNAs affected cell proliferation in AGS cells.
In order to investigate the effects of BART miRNAs on cell growth, we purchased all BART miRNA mimics (a total of 44 mimics). Figure 1A shows the sequence of the miR-BART15-3p mimic. AGS cells were transfected with each of the BART miRNAs (10 nM), and cell proliferation was accessed 72 h after transfection using the CCK-8 kit (Fig. 1B). The majority of BART miRNAs enhanced cell proliferation, while five BART miRNAs (miR-BART15-3p, -5-5p, -16-5p, -17-3p, and -20-3p) reduced cell growth. Among the five miRNAs, miR-BART15-3p suppressed cell proliferation most strongly and was further studied.
Fig 1.
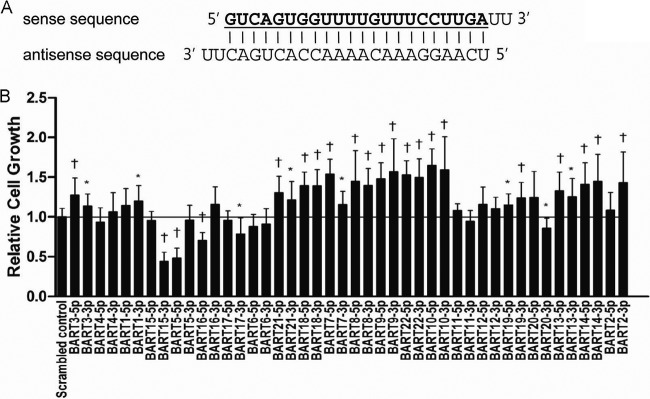
Effects of each individual BART miRNA on cell growth in AGS. Cells were transfected with each individual BART miRNA or the scrambled control. (A) The miR-BART15-3p mimic, which has a 2-uracil (U) overhang at the 3′ end of both strands, is shown. All the other BART miRNA mimics were designed in a similar pattern. (B) The degree of cell proliferation was analyzed using the CCK-8 assay kit after 72 h (n = 9). Error bars indicate SD. *, P < 0.05; †, P < 0.01.
miR-BART15-3p inhibits cell proliferation and induces apoptosis in AGS cells.
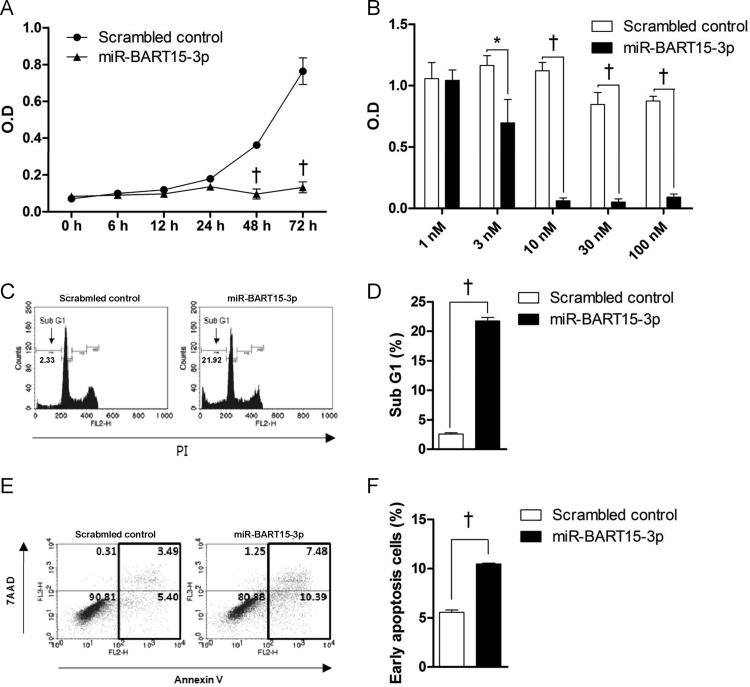
In order to investigate the effects of miR-BART15-3p on cell growth, AGS cells were transfected with 10 nM miR-BART15-3p. Cell growth was analyzed using the cell proliferation assay at 6, 12, 24, 48, and 72 h after transfection. Proliferation of AGS cells transfected with miR-BART15-3p decreased significantly after ∼48 to 72 h compared to that of cells transfected with the scrambled control (Fig. 2A). When AGS cells were transfected with increasing concentrations of miR-BART15-3p, the cell proliferation measured after 72 h was significantly lower than that in control cells at concentrations over 3 nM. Cell growth was almost completely inhibited by miR-BART15-3p at concentrations higher than 10 nM (Fig. 2B).
Fig 2.
Effect of miR-BART15-3p on cell proliferation and apoptosis. (A) Cells were seeded in a 96-well plate and then transfected with the miR-BART15-3p mimic or the scrambled control. After the indicated periods, 10 μl of CCK-8 solution was added to each well to check cell proliferation. (B) Cells were transfected with the indicated concentrations of the miR-BART15-3p mimic or the scrambled control. After 72 h, 10 μl of CCK-8 solution was added to each well. (C) Cells were transfected with the miR-BART15-3p mimic or the scrambled control and analyzed after 72 h. The proportion of the sub-G1 population was evaluated following propidium iodide staining. (D) Results similar to those in panel C were obtained in two more independent experiments, and the means and SD from all three independent experiments are plotted. (E) Cells were transfected with the miR-BART15-3p mimic or the scrambled control and analyzed after 72 h. The proportions of apoptotic cells were accessed by PE-Annexin V staining. (F) Results similar to those in panel E were obtained in two more independent experiments, and the means and SD from all three independent experiments are plotted. Error bars indicate SD (n = 3). *, P < 0.05; †, P < 0.01.
miR-BART15-3p was transfected into AGS cells in order to analyze apoptotic activity. After 72 h, the ratio of the sub-G1 population in AGS cells transfected with miR-BART15-3p was 21.76 ± 0.34%, while that in AGS cells transfected with the scrambled control was 2.57% ± 0.05%. (Fig. 2C). Similar results were obtained in two more independent experiments; the means and SD from all three independent experiments are shown in Fig. 2D. The effect of miR-BART15-3p on apoptosis was further analyzed using a PE-annexin V apoptosis detection kit. AGS cells transfected with miR-BART15-3p showed an increased early apoptotic cell population compared to cells transfected with the scrambled control (Fig. 2E). Similar results were obtained in two more independent experiments; the means and SD from all three independent experiments are shown in Fig. 2F.
miR-BART15-3p inhibitor increases cell proliferation and inhibits apoptosis in EBV-infected cells.
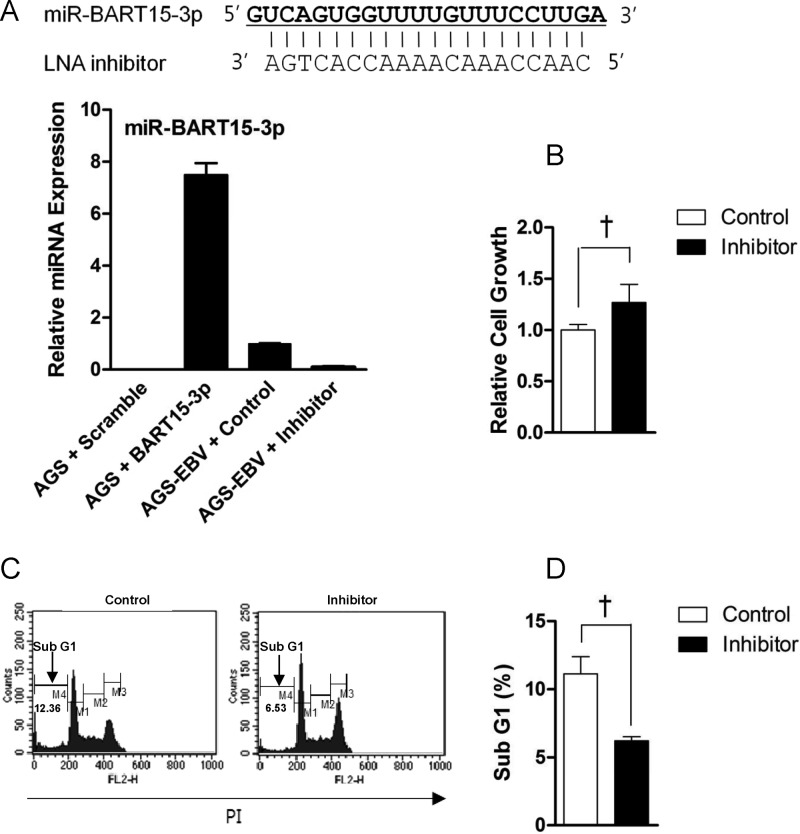
To check the effect of the LNA inhibitor on the miR-BART15-3p expression level, qRT-PCR was carried out in AGS-EBV cells transfected with LNA-miR-BART15-3p inhibitor. The inhibitor reduced the endogenous level of miR-BART15-3p to 9.1% of the level in control LNA-transfected cells (Fig. 3A). As expected, miR-BART15-3p expression was not detected in the EBV-negative cell line, AGS (Fig. 3A). AGS cells transfected with miR-BART15-3p mimic showed 7-fold-higher levels of miR-BART15-3p than the endogenous level found in AGS-EBV cells. Cell proliferation measured 72 h after inhibitor transfection was higher than in control LNA-transfected cells (Fig. 3B). To analyze the effects of reduced miR-BART15-3p function on apoptosis, the inhibitor was transfected into AGS-EBV cells. After 72 h, the proportion of sub-G1 cells was measured by FACS analysis following PI staining. The proportion of the sub-G1 population was lower in AGS-EBV cells transfected with the inhibitor than in cells transfected with the control LNA (Fig. 3C). Figure 3D shows the summarized results of three independent PI staining/FACS experiments.
Fig 3.
Effect of the inhibitor for miR-BART15-3p on AGS-EBV cells. (A) The sequence of the LNA inhibitor for miR-BART15-3p is shown at the top. The endogenous expression of miR-BART15-3p in AGS-EBV cells was analyzed by the TaqMan miRNA assay 72 h after transfection with the LNA-miR-BART15-3p inhibitor or the LNA control. (B) To determine the effect of the miR-BART15-3p inhibitor on cell proliferation, AGS-EBV cells in a 96-well plate were transfected with the inhibitor or the control LNA. After 72 h, 10 μl of CCK-8 solution was added to each well. (C) AGS-EBV cells were transfected with the inhibitor or the control LNA. The proportion of the sub-G1 population was evaluated 72 h later by PI staining. (D) Results similar to those in panel C were obtained in two more independent experiments, and the means and SD from all three independent experiments are plotted. †, P < 0.01.
miR-BART15-3p directly targets the BRUCE 3′ UTR.
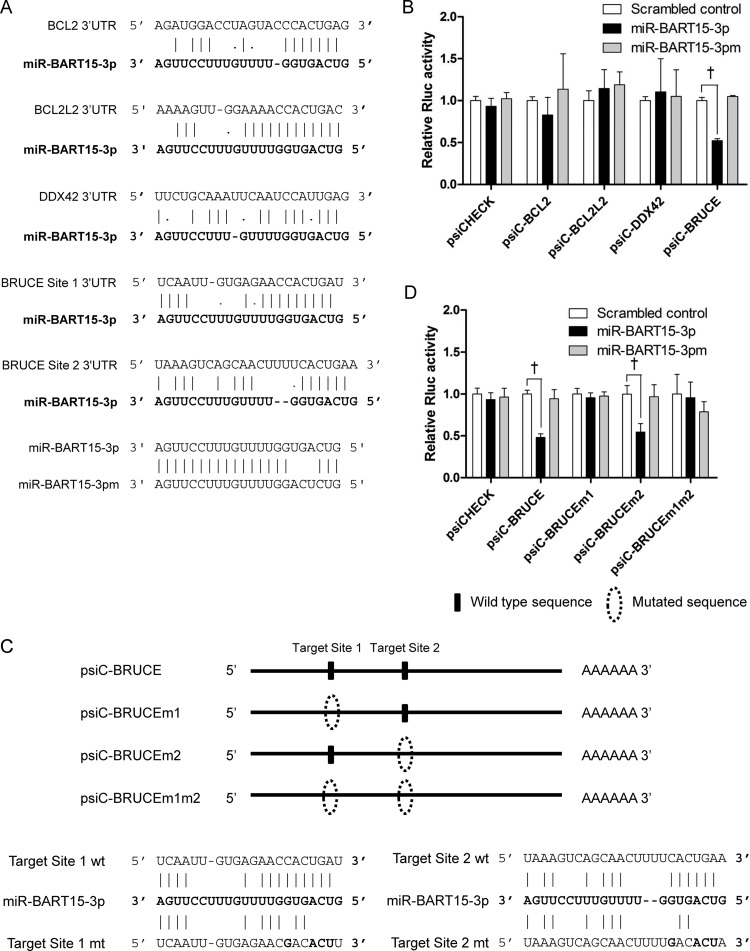
We used three publicly available programs to predict putative targets of miR-BART15-3p: TargetScan (http://www.targetscan.org), DIANA-microT (http://diana.cslab.ece.ntua.gr/microT/), and RNA hybrid (http://bibiserv.techfak.uni-bielefeld.de/rnahybrid/). Among the many predicted targets, BCL2, BCL2L2, DDX42, and BRUCE were chosen for further analysis based on their gene functions and the free energy provided by RNA hybrid program. BRUCE is a member of the inhibitor of apoptosis (IAP) family containing an IAP repeat region at its N-terminal domain (22). The 3′ UTR of the four putative target genes for miR-BART15-3p were individually cloned into the psiCHECK-2 plasmid (Fig. 4A). The resulting 3′ UTR reporter vectors were then individually cotransfected with miR-BART15-3p into HEK293T cells. The luciferase activity of the reporter vector containing the 3′ UTR of BRUCE (psiC-BRUCE) was inhibited by miR-BART15-3p, whereas the activities of the other vectors were not. However, the luciferase activity of the psiC-BRUCE vector was not affected by mutated miR-BART15-3p (miR-BART15-3pm) or by the scrambled control (Fig. 4B). There were two putative seed-matched regions for miR-BART15-3p in the BRUCE 3′ UTR. Site-directed mutagenesis was performed to mutate one (psiC-BRUCEm1, psiC-BRUCEm2) or both (psiC-BRUCEm1m2) of these sites (Fig. 4C). These plasmids were cotransfected into HEK293T cells with miR-BART15-3p, and a luciferase assay was carried out. The luciferase activity of cells transfected with either psiC-BRUCEm1 or psiC-BRUCEm1m2 was not altered by miR-BART15-3p, whereas that of psiC-BRUCEm2-transfected cells was reduced by miR-BART15-3p (Fig. 4D). As expected, the luciferase activity of the wild-type or mutated BRUCE 3′ UTR reporter vector was not affected by miR-BART15-3pm or the scrambled control.
Fig 4.
Target search for miR-BART15-3p. (A) Seed-matched regions of the putative target genes for miR-BART15-3p are shown. (B) To test whether the putative target genes are regulated by miR-BART15-3p, the 3′ UTR fragment of each gene was cloned into a luciferase reporter (psiCHECK-2) vector. HEK293T cells were cotransfected with the miR-BART15-3p mimic and the appropriate 3′ UTR reporter plasmid. To confirm the sequence-specific function of miR-BART15-3p, miR-BART15-3pm (the sequence is shown at the bottom of panel A), which has substituted nucleotides at ∼4 to 6 sites of miR-BART15-3p, was also used. Luciferase activity was analyzed 48 h after transfection (n = 3). (C) Illustration showing the location of the possible seed-matched sites for miR-BART15-3p on the BRUCE 3′ UTR and the sites changed to produce mutated forms of psiC-BRUCE. (D) HEK293T cells were cotransfected with miR-BART15-3p and the indicated psiC-BRUCE vector containing the wild-type or mutated 3′ UTR of BRUCE. Luciferase activity was normalized using firefly luciferase activity. Error bars indicate SD (n = 3). †, P < 0.01.
To investigate the regulation of luciferase activity of psiC-BRUCE by endogenously expressed miR-BART15-3p, EBV-infected cells were cotransfected with the reporters and LNA-miR-BART15-3p inhibitor (Fig. 5). The luciferase activity of psiC-BRUCE was inhibited when it was introduced into EBV-infected cells. In addition, cotransfection of LNA-miR-BART15-3p inhibitor with psiC-BRUCE resulted in recovery of luciferase activity to the control level (Fig. 5).
Fig 5.
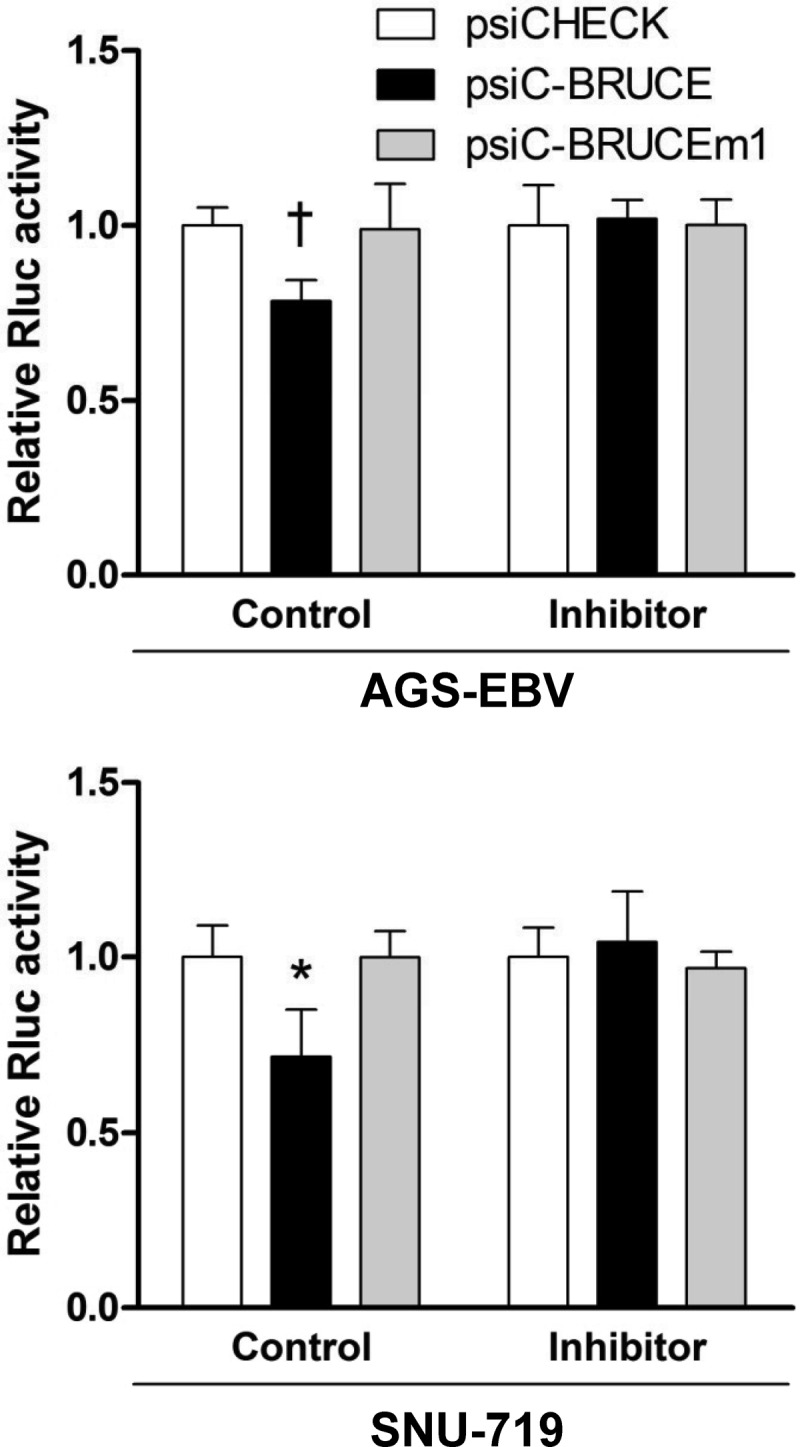
Effect of Inhibitor for miR-BART15-3p on the luciferase activity of the psiC-BRUCE reporter vector cotransfected into EBV-infected cells. AGS-EBV cells were cotransfected with the inhibitor or the control LNA and the psiC-BRUCE vector containing the wild-type or mutated 3′ UTR of BRUCE (top). Experiments similar to those described above were also performed using a naturally EBV-infected gastric carcinoma cell line, SNU-719 (bottom). The observed luciferase activity was normalized to that of firefly luciferase. Error bars indicate SD (n = 3). *, P < 0.05; †, P < 0.01.
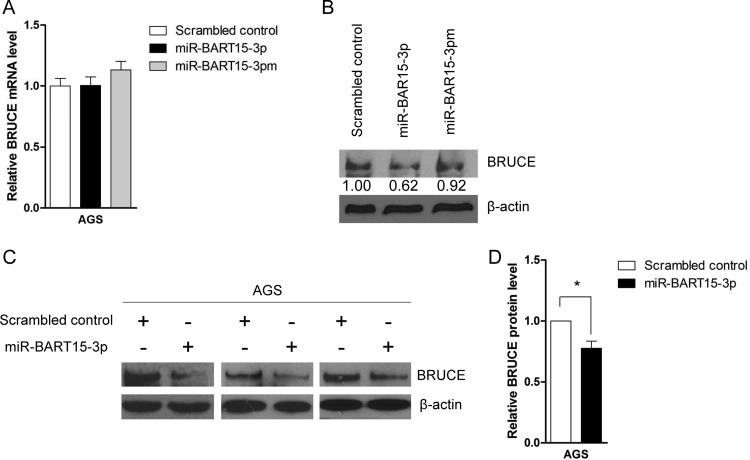
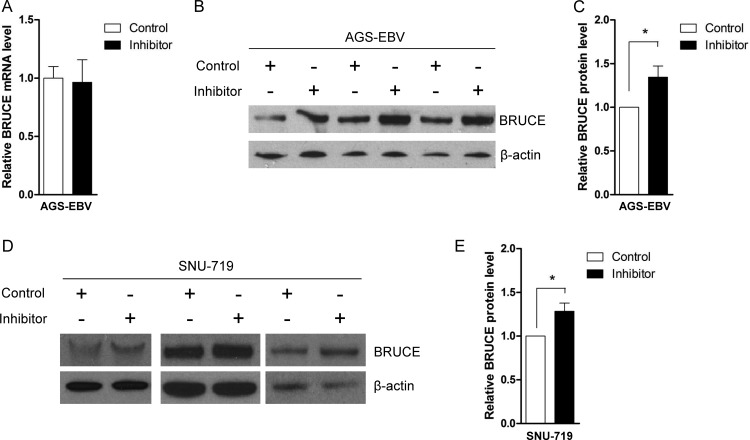
Interestingly, real-time RT-PCR analysis revealed that BRUCE mRNA expression was not reduced by miR-BART15-3p (Fig. 6A). However, Western blot analysis showed that the expression of the BRUCE protein in AGS cells was impaired following miR-BART15-3p transfection (Fig. 6B, C, and D). To confirm these results, we transfected AGS-EBV cells with the LNA-miR-BART15-3p inhibitor, and measured the expression levels of BRUCE mRNA and protein after 48 h. The level of BRUCE mRNA was not altered (Fig. 7A), but an increase in the BRUCE protein level was observed in AGS-EBV cells (Fig. 7B and C) following inhibitor transfection. Similar Western blot results were obtained in SNU-719 cells (Fig. 7D and E).
Fig 6.
Effect of miR-BART15-3p on the mRNA and protein levels of BRUCE. AGS cells were transfected with the miR-BART15-3p mimic or the scrambled control. Cells were harvested after 48 h to extract RNA or protein. (A) Real-time RT-PCR for BRUCE mRNA was carried out using the SYBR green qPCR kit. Relative gene expression was calculated according to the comparative CT method using GAPDH as an internal control. (B) Anti-BRUCE (1:1,000) and anti-β-actin (1:1,000) antibodies were used for Western blot analysis. β-Actin antibody was used to confirm comparable loading. (C) The effect of miR-BART15-3p on BRUCE expression was analyzed by Western blots using three independently transfected AGS cell batches, and similar results were obtained from them. (D) The Western blot of BRUCE shown in panel C was quantified and normalized to β-actin, and results are presented as a bar graph. *, P < 0.05.
Fig 7.
Effect of LNA-miR-BART15-3p inhibitor on BRUCE mRNA and protein levels. AGS-EBV cells were transfected with the LNA-miR-BART15-3p inhibitor or the control LNA. The cells were harvested after 48 h to extract RNA or protein. (A) Real-time RT-PCR for BRUCE mRNA was carried out using the SYBR green qPCR kit. Relative gene expression was calculated according to the comparative CT method using GAPDH as an internal control. (B and D) Anti-BRUCE (1:1,000) and anti-β-actin (1:1,000) antibodies were used for Western blot analysis. The β-actin antibody was used to confirm comparable loading. The effect of LNA-miR-BART15-3p inhibitor on the expression of BRUCE in the EBV-infected gastric cancer cells was analyzed by Western blots using three independently transfected AGS-EBV (B) and SNU-719 (D) cell batches. Similar results were obtained from both cell lines. (C and E) The results of the Western blot of BRUCE expression shown in panels B and D were quantified and normalized to β-actin, and the results are presented as bar graphs. *, P < 0.05.
Knockdown of BRUCE induces cell death in AGS.
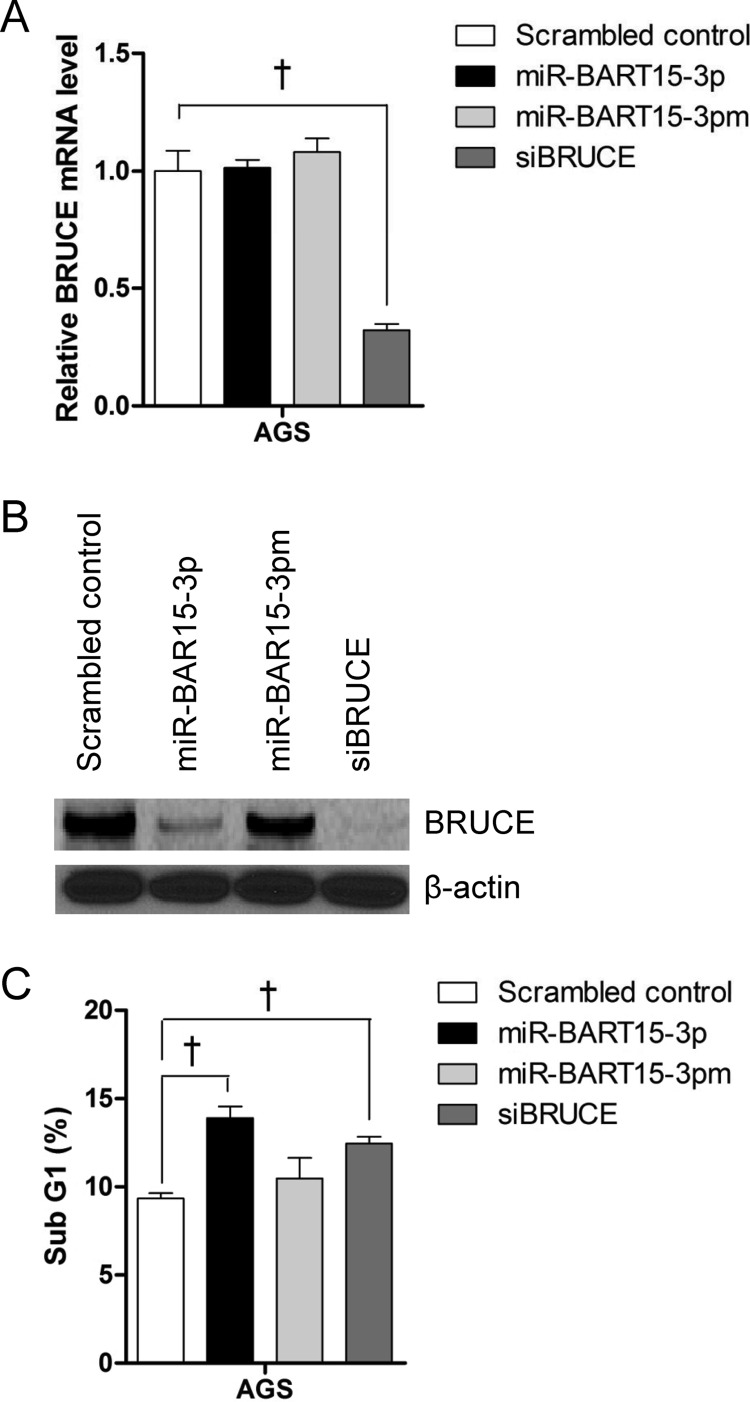
We examined whether siRNA against BRUCE also causes apoptosis similar to miR-BART15-3p. AGS cells were transfected with 10 nM siBRUCE, and the fraction of the sub-G1 population was analyzed 72 h later by PI staining. siBRUCE reduced the mRNA level and protein level of BRUCE as expected (Fig. 8A and B). siBRUCE-transfected AGS cells showed an increased sub-G1 population (Fig. 8C). However, the fraction of the sub-G1 population was higher in AGS cells transfected with miR-BART15-3p than with siBRUCE.
Fig 8.
Effect of siRNA for BRUCE (siBRUCE) on BRUCE expression and apoptosis. The expression levels of BRUCE mRNA (A) and protein (B) in AGS cells 48 h after transfection with the miR-BART15-3p mimic siBRUCE or the scrambled control were measured by qRT-PCR and Western blot, respectively. GAPDH and β-actin were used as internal controls for qRT-PCR and Western blot, respectively. (C) AGS cells were transfected with the miR-BART15-3p mimic siBRUCE or the scrambled control. The proportion of the sub-G1 cell population was measured after 72 h by PI staining and FACS analysis. Error bars indicate SD (n = 3). †, P < 0.01.
miR-BART15-3p is present in exosomes from EBV-infected gastric cell lines.
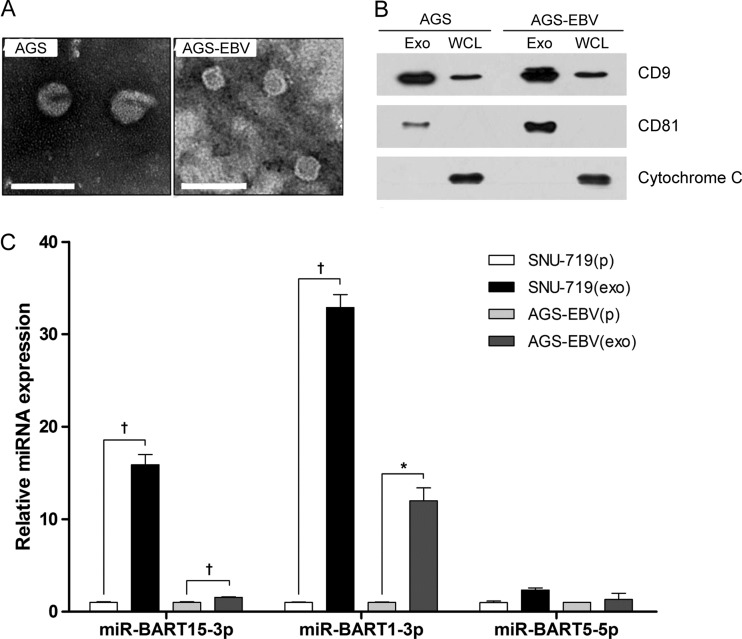
In order to check the possibility that miR-BART15-3p is secreted from the cells, exosomes were isolated from the culture media of the AGS and AGS-EBV cell lines by the ultracentrifugation method. TEM analysis of exosome preparations from both cells showed circular and cup-like vesicles with sizes ranging between ∼30 and ∼50 nm (Fig. 9A). The expression of the exosome markers CD8 and CD81 was analyzed by Western blotting. CD8 and CD81 were detected in the exosome preparations, while the cellular marker cytochrome C was detected only in the whole-cell lysates (Fig. 9B). To test whether miR-BART15-3p is secreted via exosomes, quantitative real-time RT-PCR for miR-BART15-3p was carried out using the same amount of RNAs purified from the exosomes and cell pellets. A 2-fold-higher level of miR-BART15-3p was detected in the exosomal RNA than in the cellular RNA of AGS-EBV. miR-BART1-3p, which was used as a exosomally secreted miRNA control (23, 24), was enriched 12-fold in the exosomal RNA. In the case of SNU-719, miR-BART15-3p was enriched 16-fold in the exosomal RNA, and miR-BART1-3p was enriched in exosomal RNA compared to cellular RNA (Fig. 9C). miR-BART5-5p was not significantly enriched in the exosome (Fig. 9C), as previously reported (23, 24).
Fig 9.
Detection of miR-BART15-3p in exosomes isolated from EBV-infected gastric carcinoma cells. AGS, AGS-EBV, and SNU-719 cells were cultured with RPMI containing 10% serum which had previously been depleted of FBS-derived exosomes. The cell culture medium was harvested after 48 h to isolate exosomes. (A) TEM analysis of exosomes from AGS and AGS-EBV cells. Scale bar, 100 nm. (B) Western blot analysis of proteins used as exosome markers (CD9 and CD81) and an intracellular marker (cytochrome C). One microgram of exosomes and 50 μg of whole-cell lysate (WCL) were used. (C) Quantitative real-time RT-PCR for miR-BART15-3p, miR-BART1-3p, and miR-BART5-5p was carried out using the TaqMan miRNA assay with 5 ng of total RNA each from exosomes and cell pellets. The level of exosomal miRNA expression relative to that of the cell pellet was calculated according to the comparative CT method. *, P < 0.05; †, P < 0.01.
DISCUSSION
In the process of screening the effect of BART miRNAs on cell growth, we found that a few BART miRNAs inhibited cell growth, while majority of the BART miRNAs enhanced cell proliferation. Among the BART-miRNAs that inhibited cell growth, miR-BART15-3p showed the most potent effect. In addition, an inhibitor of miR-BART15-3p promoted cell proliferation and inhibited cell death in EBV-infected cells.
We also found that the miR-BART15-3p mimic repressed the expression of the reporter fused to the 3′ UTR of BRUCE in HEK293T cells. The 3′ UTR of BRUCE has two potential seed matches for miR-BART15-3p. However, miR-BART15-3p seemed to directly target only the first predicted site (NM_016252; positions 14906 to 14928) of the BRUCE 3′ UTR. The miR-BART15-3p binding sites are well conserved among mammals (data not shown), even though EBV is a human herpesvirus. The luciferase activity of psiC-BRUCE was reduced in AGS-EBV cells endogenously expressing miR-BART15-3p, while the reduction in psiC-BRUCE activity was abrogated by the inhibitor for miR-BART15-3p. Thus, the endogenous expression of miR-BART15-3p in the EBV-infected gastric carcinoma cell lines AGS-EBV and SNU-719 seems to suppress BRUCE expression.
Interestingly, we observed that miR-BART15-3p downregulated the level of BRUCE protein without affecting the level of BRUCE mRNA. This agrees with the previous finding that some miRNAs suppress the translation of mRNA without affecting their stability (25).
In this study, custom predictions of TargetScan and DIANA-microT were used to predict targets for miR-BART15-3p. Four antiapoptotic genes (BCL2, BCL2L2, DDX42, and BRUCE) were chosen as putative miR-BART15-3p targets for further analysis. However, these four genes were not predicted targets of miR-BART15-3p based on the high-throughput sequencing (HITS) cross-linking immunoprecipitation (CLIP) and photoactivatable-ribonucleoside-enhanced (PAR)-CLIP data of other researchers (26–28). The free energy of BRUCE was noticeably the lowest among the four chosen potential target genes.
BRUCE, also known as APOLLON or BIRC6, is a member of the inhibitor of apoptosis (IAP) family containing an IAP repeat region at its N-terminal domain (22). BRUCE has a single BIR domain, which protects cells from apoptosis by inhibiting the activities of caspase and proapoptotic elements through pairing and ubiquitin-dependent degradation (29). Similar to previous observations that BRUCE knockout cells can be sensitized to cell death and easily induced to undergo cell death (30), the effect of miR-BART15-3p on apoptosis through BRUCE was confirmed in the present study using BRUCE siRNA in AGS cells. Considering the dramatic effect of BRUCE siRNA on BRUCE expression, its effect on cell death was not very potent compared to that of miR-BART15-3p. This might be due to the fact that miRNAs can have multiple targets. Other apoptosis-related target genes of miR-BART15-3p are now under investigation in our laboratory.
The expression level of miR-BART15-3p detected in EBV-infected NPC cells using qRT-PCR and deep sequencing has been reported to be intermediate compared with those of other BART miRNAs (31, 32). In EBV-infected natural killer/T cell lymphomas and lymphoblastoid cell lines (LCLs), miR-BART15-3p can be detected at low frequencies by deep sequencing (27, 33). In contrast, miR-BART15-3p is not detected in EBV-infected diffuse large B-cell lymphomas, germinal center B cells, and memory B cells (34, 35). In general, the expression level of miR-BART15-3p seems to be lower in immune cells than in epithelial cells.
The effect of miR-BART15-3p on apoptosis was rather unexpected, as EBV is a tumorigenic virus and some of its miRNAs have been reported to increase cell proliferation and inhibit apoptosis (12, 13, 18, 26). It is unclear why miR-BART15-3p would cause apoptosis and inhibit cell proliferation. miR-BART15-3p may accelerate the virus lytic cycle and/or spreading of progeny viruses by inducing host cell apoptosis, as caspase cleavage of some viral proteins was shown to favor viral replication and spreading (36). For example, Aleutian mink disease virus promotes caspase activation during permissive infection and cleaves the NS1 protein to facilitate entry into the viral lytic cycle (37, 38). In addition, human papillomavirus (HPV) induces caspase 3-dependent apoptosis, and caspase 3 cleaves the HPV E1 protein enhancing viral amplification (36, 39).
The effects observed following transfection with the miR-BART15-3p mimic should be evaluated with care, because the level of transfected miR-BART15-3p was 7-fold higher than its physiological level detected in AGS-EBV cells. However, based on the fact that inhibition of miR-BART15-3p enhanced cell survival and reduced the sub-G1 population in AGS-EBV cells (Fig. 3), miR-BART15-3p seems to induce apoptosis under physiological conditions. EBV-infected cells would be able to withstand the detrimental effect of miR-BART15-3p, as there are many BART miRNAs that support cell proliferation (Fig. 1B). Thus, BART miRNA expression following EBV infection would potentiate cell survival rather than induce apoptosis in total.
Recently, several miRNAs were found to be secreted selectively via microvesicles, especially exosomes (40). Furthermore, secreted miRNAs can be transported to adjacent cells and function in repressing target mRNAs (40). This suggests that miRNAs could be used in communication between cells. EBV viral miRNAs are also secreted and transported to adjacent cells via exosomes (23, 40, 41). In EBV-positive nasopharyngeal cancer, several viral miRNAs, including miR-BART4, -1, -7, -16, -9, -12, and -13, were enriched in the exosomes and transported to adjacent endothelial cells (23). EBV-transformed lymphoblastoid B cells also secreted several viral miRNAs, including miR-BHRF1-1, miR-BHRF1-2, miR-BART1-3p, miR-BART1-5p, and miR-BART2-5p (24). While we were preparing this paper, NACHT, LRR, and PYD domain-containing protein 3 (NLRP3) was identified as a target of miR-BART15-3p. The authors reported that miR-BART15-3p can be secreted from EBV-infected B cells via exosomes, and a small but significant amount of EBV miR-BART15 was taken up by noninfected cells. Furthermore, the delivered miR-BART15-3p was able to inhibit the NLRP3 inflammasome in the PMA-differentiated macrophage cell line Thp-1 (41).
In this study, we observed that miR-BART15-3p increases apoptosis partially by inhibiting translation of BRUCE mRNA without affecting its stability. We also found that miR-BART15-3p exists in exosomes from an EBV-positive gastric cancer cell line and that this miRNA is enriched in the exosomes compared to the corresponding cell pellets. Because miR-BART15-3p inhibited BRUCE expression, its transfer to adjacent immune cells would induce their apoptosis. Our data suggest the possibility that exosomal miR-BART15-3p can provide a favorable microenvironment for the growth of EBV-associated tumors by being transmitted to neighboring immune cells. Further investigation of the communication of EBV-positive gastric cancer cells with adjacent immune cells is warranted.
ACKNOWLEDGMENTS
This research was supported by the Basic Science Research Program through the National Research Foundation of Korea (NRF) funded by the Ministry of Education, Science and Technology (2012R1A1A2008813) and by grants from the Gyeonggi Regional Research Center (GRRC) of the Catholic University of Korea [(GRRC Catholic 2012—B05) RNA-based development of biopharmaceutical lead molecules].
Footnotes
Published ahead of print 15 May 2013
REFERENCES
- 1. Bartel DP. 2004. MicroRNAs: genomics, biogenesis, mechanism, and function. Cell 116:281–297 [DOI] [PubMed] [Google Scholar]
- 2. Young LS, Rickinson AB. 2004. Epstein-Barr virus: 40 years on. Nat. Rev. Cancer 4:757–768 [DOI] [PubMed] [Google Scholar]
- 3. Young LS, Murray PG. 2003. Epstein-Barr virus and oncogenesis: from latent genes to tumours. Oncogene 22:5108–5121 [DOI] [PubMed] [Google Scholar]
- 4. Middeldorp JM, Brink AA, van den Brule AJ, Meijer CJ. 2003. Pathogenic roles for Epstein-Barr virus (EBV) gene products in EBV-associated proliferative disorders. Crit. Rev. Oncol. Hematol. 45:1–36 [DOI] [PubMed] [Google Scholar]
- 5. van Beek J, Brink AA, Vervoort MB, van Zijp MJ, Meijer CJ, van den Brule AJ, Middeldorp JM. 2003. In vivo transcription of the Epstein-Barr virus (EBV) BamHI-A region without associated in vivo BARF0 protein expression in multiple EBV-associated disorders. J. Gen. Virol. 84:2647–2659 [DOI] [PubMed] [Google Scholar]
- 6. Pfeffer S, Zavolan M, Grasser FA, Chien M, Russo JJ, Ju J, John B, Enright AJ, Marks D, Sander C, Tuschl T. 2004. Identification of virus-encoded microRNAs. Science 304:734–736 [DOI] [PubMed] [Google Scholar]
- 7. Grundhoff A, Sullivan CS, Ganem D. 2006. A combined computational and microarray-based approach identifies novel microRNAs encoded by human gamma-herpesviruses. RNA 12:733–750 [DOI] [PMC free article] [PubMed] [Google Scholar]
- 8. Cai X, Schafer A, Lu S, Bilello JP, Desrosiers RC, Edwards R, Raab-Traub N, Cullen BR. 2006. Epstein-Barr virus microRNAs are evolutionarily conserved and differentially expressed. PLoS Pathog. 2:e23. 10.1371/journal.ppat.0020023 [DOI] [PMC free article] [PubMed] [Google Scholar]
- 9. Zhu JY, Pfuhl T, Motsch N, Barth S, Nicholls J, Grasser F, Meister G. 2009. Identification of novel Epstein-Barr virus microRNA genes from nasopharyngeal carcinomas. J. Virol. 83:3333–3341 [DOI] [PMC free article] [PubMed] [Google Scholar]
- 10. Kim DN, Chae HS, Oh ST, Kang JH, Park CH, Park WS, Takada K, Lee JM, Lee WK, Lee SK. 2007. Expression of viral microRNAs in Epstein-Barr virus-associated gastric carcinoma. J. Virol. 81:1033–1036 [DOI] [PMC free article] [PubMed] [Google Scholar]
- 11. Jun SM, Hong YS, Seo JS, Ko YH, Yang CW, Lee SK. 2008. Viral microRNA profile in Epstein-Barr virus-associated peripheral T cell lymphoma. Br. J. Haematol. 142:320–323 [DOI] [PubMed] [Google Scholar]
- 12. Choy EY, Siu KL, Kok KH, Lung RW, Tsang CM, To KF, Kwong DL, Tsao SW, Jin DY. 2008. An Epstein-Barr virus-encoded microRNA targets PUMA to promote host cell survival. J. Exp. Med. 205:2551–2560 [DOI] [PMC free article] [PubMed] [Google Scholar]
- 13. Lo AK, To KF, Lo KW, Lung RW, Hui JW, Liao G, Hayward SD. 2007. Modulation of LMP1 protein expression by EBV-encoded microRNAs. Proc. Natl. Acad. Sci. U. S. A. 104:16164–16169 [DOI] [PMC free article] [PubMed] [Google Scholar]
- 14. Lung RW, Tong JH, Sung YM, Leung PS, Ng DC, Chau SL, Chan AW, Ng EK, Lo KW, To KF. 2009. Modulation of LMP2A expression by a newly identified Epstein-Barr virus-encoded microRNA miR-BART22. Neoplasia 11:1174–1184 [DOI] [PMC free article] [PubMed] [Google Scholar]
- 15. Barth S, Pfuhl T, Mamiani A, Ehses C, Roemer K, Kremmer E, Jaker C, Hock J, Meister G, Grasser FA. 2008. Epstein-Barr virus-encoded microRNA miR-BART2 down-regulates the viral DNA polymerase BALF5. Nucleic Acids Res. 36:666–675 [DOI] [PMC free article] [PubMed] [Google Scholar]
- 16. Nachmani D, Stern-Ginossar N, Sarid R, Mandelboim O. 2009. Diverse herpesvirus microRNAs target the stress-induced immune ligand MICB to escape recognition by natural killer cells. Cell Host Microbe 5:376–385 [DOI] [PubMed] [Google Scholar]
- 17. Iizasa H, Wulff BE, Alla NR, Maragkakis M, Megraw M, Hatzigeorgiou A, Iwakiri D, Takada K, Wiedmer A, Showe L, Lieberman P, Nishikura K. 2010. Editing of Epstein-Barr virus-encoded BART6 microRNAs controls their dicer targeting and consequently affects viral latency. J. Biol. Chem. 285:33358–33370 [DOI] [PMC free article] [PubMed] [Google Scholar]
- 18. Marquitz AR, Mathur A, Nam CS, Raab-Traub N. 2011. The Epstein-Barr virus BART microRNAs target the pro-apoptotic protein Bim. Virology 412:392–400 [DOI] [PMC free article] [PubMed] [Google Scholar]
- 19. Shin HJ, Kim do, Lee NSK. 2011. Association between Epstein-Barr virus infection and chemoresistance to docetaxel in gastric carcinoma. Mol. Cells 32:173–179 [DOI] [PMC free article] [PubMed] [Google Scholar]
- 20. Kim CW, Lee HM, Lee TH, Kang C, Kleinman HK, Gho YS. 2002. Extracellular membrane vesicles from tumor cells promote angiogenesis via sphingomyelin. Cancer Res. 62:6312–6317 [PubMed] [Google Scholar]
- 21. Choi DS, Park JO, Jang SC, Yoon YJ, Jung JW, Choi DY, Kim JW, Kang JS, Park J, Hwang D, Lee KH, Park SH, Kim YK, Desiderio DM, Kim KP, Gho YS. 2011. Proteomic analysis of microvesicles derived from human colorectal cancer ascites. Proteomics 11:2745–2751 [DOI] [PubMed] [Google Scholar]
- 22. Chen Z, Naito M, Hori S, Mashima T, Yamori T, Tsuruo T. 1999. A human IAP-family gene, apollon, expressed in human brain cancer cells. Biochem. Biophys. Res. Commun. 264:847–854 [DOI] [PubMed] [Google Scholar]
- 23. Pegtel DM, Cosmopoulos K, Thorley-Lawson DA, van Eijndhoven MA, Hopmans ES, Lindenberg JL, de Gruijl TD, Wurdinger T, Middeldorp JM. 2010. Functional delivery of viral miRNAs via exosomes. Proc. Natl. Acad. Sci. U. S. A. 107:6328–6333 [DOI] [PMC free article] [PubMed] [Google Scholar]
- 24. Meckes DG, Jr, Shair KH, Marquitz AR, Kung CP, Edwards RH, Raab-Traub N. 2010. Human tumor virus utilizes exosomes for intercellular communication. Proc. Natl. Acad. Sci. U. S. A. 107:20370–20375 [DOI] [PMC free article] [PubMed] [Google Scholar]
- 25. Bartel DP. 2009. MicroRNAs: target recognition and regulatory functions. Cell 136:215–233 [DOI] [PMC free article] [PubMed] [Google Scholar]
- 26. Riley KJ, Rabinowitz GS, Yario TA, Luna JM, Darnell RB, Steitz JA. 2012. EBV and human microRNAs co-target oncogenic and apoptotic viral and human genes during latency. EMBO J. 31:2207–2221 [DOI] [PMC free article] [PubMed] [Google Scholar]
- 27. Skalsky RL, Corcoran DL, Gottwein E, Frank CL, Kang D, Hafner M, Nusbaum JD, Feederle R, Delecluse HJ, Luftig MA, Tuschl T, Ohler U, Cullen BR. 2012. The viral and cellular microRNA targetome in lymphoblastoid cell lines. PLoS Pathog. 8:e1002484. 10.1371/journal.ppat.1002484 [DOI] [PMC free article] [PubMed] [Google Scholar]
- 28. Gottwein E, Corcoran DL, Mukherjee N, Skalsky RL, Hafner M, Nusbaum JD, Shamulailatpam P, Love CL, Dave SS, Tuschl T, Ohler U, Cullen BR. 2011. Viral microRNA targetome of KSHV-infected primary effusion lymphoma cell lines. Cell Host Microbe 10:515–526 [DOI] [PMC free article] [PubMed] [Google Scholar]
- 29. Verhagen AM, Coulson EJ, Vaux DL. 2001. Inhibitor of apoptosis proteins and their relatives: IAPs and other BIRPs. Genome Biol. 2:REVIEWS3009 [DOI] [PMC free article] [PubMed] [Google Scholar]
- 30. Hao Y, Sekine K, Kawabata A, Nakamura H, Ishioka T, Ohata H, Katayama R, Hashimoto C, Zhang X, Noda T, Tsuruo T, Naito M. 2004. Apollon ubiquitinates SMAC and caspase-9, and has an essential cytoprotection function. Nat. Cell Biol. 6:849–860 [DOI] [PubMed] [Google Scholar]
- 31. Cosmopoulos K, Pegtel M, Hawkins J, Moffett H, Novina C, Middeldorp J, Thorley-Lawson DA. 2009. Comprehensive profiling of Epstein-Barr virus microRNAs in nasopharyngeal carcinoma. J. Virol. 83:2357–2367 [DOI] [PMC free article] [PubMed] [Google Scholar]
- 32. Chen SJ, Chen GH, Chen YH, Liu CY, Chang KP, Chang YS, Chen HC. 2010. Characterization of Epstein-Barr virus miRNAome in nasopharyngeal carcinoma by deep sequencing. PLoS One 5:e12745. 10.1371/journal.pone.0012745 [DOI] [PMC free article] [PubMed] [Google Scholar]
- 33. Motsch N, Alles J, Imig J, Zhu J, Barth S, Reineke T, Tinguely M, Cogliatti S, Dueck A, Meister G, Renner C, Grasser FA. 2012. MicroRNA profiling of Epstein-Barr virus-associated NK/T-cell lymphomas by deep sequencing. PLoS One 7:e42193. 10.1371/journal.pone.0042193 [DOI] [PMC free article] [PubMed] [Google Scholar]
- 34. Imig J, Motsch N, Zhu JY, Barth S, Okoniewski M, Reineke T, Tinguely M, Faggioni A, Trivedi P, Meister G, Renner C, Grasser FA. 2011. MicroRNA profiling in Epstein-Barr virus-associated B-cell lymphoma. Nucleic Acids Res. 39:1880–1893 [DOI] [PMC free article] [PubMed] [Google Scholar]
- 35. Qiu J, Cosmopoulos K, Pegtel M, Hopmans E, Murray P, Middeldorp J, Shapiro M, Thorley-Lawson DA. 2011. A novel persistence associated EBV miRNA expression profile is disrupted in neoplasia. PLoS Pathog. 7:e1002193. 10.1371/journal.ppat.1002193 [DOI] [PMC free article] [PubMed] [Google Scholar]
- 36. Richard A, Tulasne D. 2012. Caspase cleavage of viral proteins, another way for viruses to make the best of apoptosis. Cell Death Dis. 3:e277. [DOI] [PMC free article] [PubMed] [Google Scholar]
- 37. Best SM, Wolfinbarger JB, Bloom ME. 2002. Caspase activation is required for permissive replication of Aleutian mink disease parvovirus in vitro. Virology 292:224–234 [DOI] [PubMed] [Google Scholar]
- 38. Best SM, Shelton JF, Pompey JM, Wolfinbarger JB, Bloom ME. 2003. Caspase cleavage of the nonstructural protein NS1 mediates replication of Aleutian mink disease parvovirus. J. Virol. 77:5305–5312 [DOI] [PMC free article] [PubMed] [Google Scholar]
- 39. Moody CA, Laimins LA. 2009. Human papillomaviruses activate the ATM DNA damage pathway for viral genome amplification upon differentiation. PLoS Pathog. 5:e1000605. 10.1371/journal.ppat.1000605 [DOI] [PMC free article] [PubMed] [Google Scholar]
- 40. Valadi H, Ekstrom K, Bossios A, Sjostrand M, Lee JJ, Lotvall JO. 2007. Exosome-mediated transfer of mRNAs and microRNAs is a novel mechanism of genetic exchange between cells. Nat. Cell Biol. 9:654–659 [DOI] [PubMed] [Google Scholar]
- 41. Haneklaus M, Gerlic M, Kurowska-Stolarska M, Rainey AA, Pich D, McInnes IB, Hammerschmidt W, O'Neill LA, Masters SL. 2012. Cutting edge: miR-223 and EBV miR-BART15 regulate the NLRP3 inflammasome and IL-1beta production. J. Immunol. 189:3795–3799 [DOI] [PubMed] [Google Scholar]


