Abstract
Human and small-animal positron emission tomography (PET) scanners with cylindrical geometry and conventional detectors exhibit a progressive reduction in radial spatial resolution with increasing radial distance from the geometric axis of the scanner. This “depth-of-interaction” (DOI) effect is sufficiently deleterious that many laboratories have devised novel schemes to reduce the magnitude of this effect and thereby yield PET images of greater quantitative accuracy. Here we examine experimentally the effects of a particular DOI correction method (dual-scintillator phoswich detectors with pulse shape discrimination) implemented in a small-animal PET scanner by comparing the same phantom and same mouse images with and without DOI correction. The results suggest that even this relatively coarse, two-level estimate of radial gamma ray interaction position significantly reduces the DOI parallax error. This study also confirms two less appreciated advantages of DOI correction: a reduction in radial distortion and radial source displacement as a source is moved toward the edge of the field of view and a resolution improvement detectable in the central field of view likely owing to improved spatial sampling.
Origin of the Depth-of-Interaction Effect
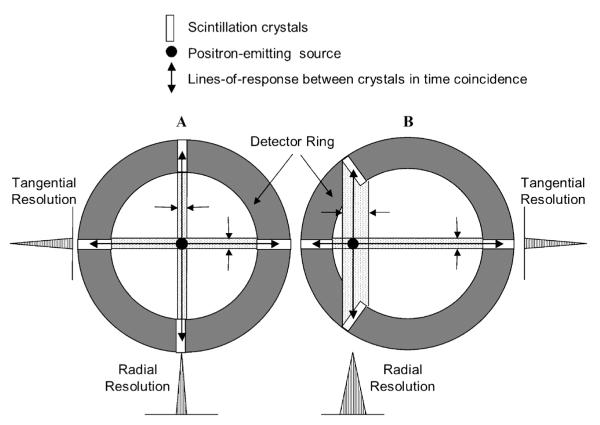
Positron emission tomography (PET) scanners with cylindrical geometry and without depth-of-interaction (DOI) correction exhibit a progressive reduction in radial spatial resolution with increasing distance from the center of the scanner field of view (FOV). That resolution loss is a geometric parallax effect that arises from the uncertainty in positioning a coincident event with respect to the line of response that joins the two crystals involved in the interaction (Figure 1). That effect is relatively small for sources located near the scanner’s central axis (see Figure 1A) because the difference in position between the true line of flight of the annihilation gamma rays and the assumed line of flight, that is, the line of response (LOR) between two crystals, is small. When a source is relatively far from the central axis (see Figure 1B), the difference in position between the true line of flight of the photon pair and the assumed LOR can be large because photons can now enter either crystal anywhere along their lengths and interact at different radial depths in either crystal. Since that depth is unknown in non-DOI correcting scanners, the DOI is often set at the midpoint of each crystal and the line connecting these two points defines the single LOR for all coincident events in this crystal pair. The difference between that assumed LOR and the true photon flight path causes radial spatial resolution to deteriorate increasingly with distance from the center of the FOV.
Figure 1.
A, For a point source near the center of the field of view (FOV), photons enter crystals in the detector array through their very small front faces and the difference between the lines-of-response (the assumed flight paths) and the true photon flight paths (anywhere within the dotted regions) is small, that is, “good” radial resolution. B, For off-axis sources, photons can enter crystals through their front faces and anywhere along their sides, so radial resolution is “poor.” Note that tangential resolution is not dependent on the DOI effect and is essentially constant across the FOV.
Three interrelated complications arise from the DOI effect. First, the spatial structure of the radioactivity distribution near the central axis of the scanner will be better resolved than the same distribution located peripherally in the FOV. As a result, the ability to identify small differences in that distribution will depend on radial position in the FOV. Second, the accuracy of estimates of organ activity concentration in small objects will change with radial position, potentially introducing systematic biases in concentration estimates between central and more peripheral imaging targets. For the same reason, if the same animal is studied on multiple occasions, estimates of activity concentration in the same small organ could depend on where in the radial FOV the animal or organ is located from session to session. Finally, the DOI effect can produce geometric distortions of radioactive objects with increasing radial position. As shown in Figure 1, the DOI effect increasingly blurs a radioactive object in the radial direction as the source is moved away from the center of the FOV. Tangential resolution, on the other hand, remains essentially constant with radial position, thereby giving rise to a differential degradation in resolution that preferentially stretches the shape of an object in the radial direction. In addition to that effect, the probability distribution function of radial gamma ray interaction sites in a crystal depends on radial source position. As a source is moved away from the center of the FOV, this distribution function becomes increasingly biased toward the front of the crystal because the probability of a gamma ray reaching the rear of the crystal decreases owing to the increasing thickness of intervening scintillator material along the flight path of the gamma ray pair. That phenomenon would introduce a radially increasing bias in event positioning that systematically locates events at greater radial positions than their actual radial position. Together, those effects result in radial distortion of both the shape and the position of a radioactive object.
Given those consequences, a number of detector designs have been proposed to reduce the magnitude of DOI-related errors.1–13 However, although the theoretical behavior of those methods has often been studied, few studies have reported measurements made with actual DOI-capable systems that directly demonstrate improvements.13 Accordingly, we designed a phantom study and a mouse study to compare directly images of these objects with and without DOI correction for a particular small-animal PET scanner (eXplore VISTA, GE Healthcare1, Waukesha, WI) and DOI correction method (dual-scintillator phoswich detector modules with pulse shape discrimination).
Methods and Materials
DOI Correction Method
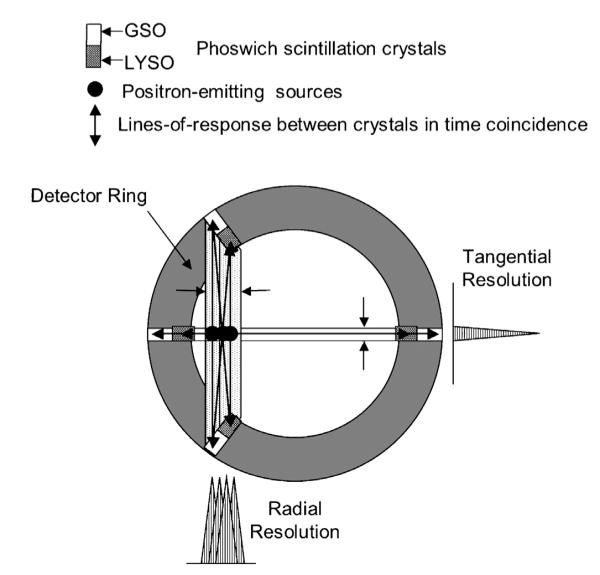
The present DOI correction method is illustrated in Figure 2. Here two different types of scintillation crystals are glued together end to end with an optically transparent epoxy to form a “phoswich” (phosphor sandwich). Each of those elements, optically isolated from its neighbors, is then bundled into an array and each array is optically coupled to a position-sensitive photomultiplier tube (PSPMT) to form a detector module.
Figure 2.
If the crystals in Figure 1 are divided into two separately identifiable pieces, radial resolution improves since flight paths and lines-of-response (LORs) are now more similar. Note that dividing the crystals in two also quadruples the number of LORs and increases the spatial sampling density compared to the non–DOI-correcting scanner shown in Figure 1. GSO = gadolinium orthosilicate:cerium; LYSO = lutetium yttrium orthosilicate:cerium.
Each of the modules is, in turn, arranged to form an 18-sided regular polygon surrounding the animal. The two phoswich scintillators are chosen based on the magnitudes of and difference between their characteristic scintillation light decay times. If the difference is great enough and the light decay time can be measured for each scintillation event, then the event can be assigned to either the front scintillator or the rear scintillator in the phoswich element, that is, assigned to a different radial depth, depending on which decay time is determined for that event. For a dual-scintillator phoswich, that assignment results in a relatively coarse, two-level estimate of the DOI. As suggested in Figure 2, that strategy has the effect of making a “long” crystal appear to be two “short” crystals that reduce the DOI effect by reducing the difference between the actual line of flight of the photon pair and the lines-of-response (LORs) that now join the four crystals involved in potential interactions between the two phoswich elements. Sensitivity is maintained with that scheme (because the phoswich element is “long” and detection probability high) while reducing the magnitude of the DOI effect, a tradeoff not available in machines with similar geometry but no DOI correction capability.
Implementation of DOI Correction on the eXplore VISTA Scanner
Phoswich elements in the VISTA machine are composed of lutetium yttrium orthosilicate:cerium (LYSO) and gadolinium orthosilicate:cerium (GSO) scintillation crystals optically glued together end to end. LYSO and GSO differ in their scintillation light decay times (40 ns and 60 ns, respectively) by 20 ns. Both crystals have the same cross-sectional dimensions (1.45 mm square) but differ in their lengths (7 mm LYSO and 8 mm GSO). Each element is surrounded on five sides by a specular reflector and is optically isolated from its neighbors. Square bundles of 13 × 13 phoswich elements (1.55 mm pitch) are optically coupled to a 2.54 cm square PSPMT to form the detector module. Light from a gamma ray interaction in the front LYSO portion of the phoswich passes (with reflections) from the LYSO segment through the GSO segment and onto the photocathode of the PSPMT. Similarly, light from a gamma ray interaction in the GSO segment passes through both crystals (with reflections) onto the photocathode of the PSPMT.
The PSPMT emits a signal for each event that recapitulates the time course of the intensity of the scintillation flash and, therefore, contains the timing information needed to assign the event to one or the other scintillator segments. The method used to make that discrimination has various names but is often referred to as “pulse shape discrimination.” The light decay time of a scintillator can be estimated from its exponentially falling signal (an approximation to the shape of the PSPMT signal in response to the decaying light output of the scintillation crystal after an event) with the equation
| (1) |
where τ is the light decay time of the scintillator and ITOTAL and IDELAY are the integrals of the total light signal and a delayed integral of the same light signal starting T nanoseconds after the pulse onset and running to infinity (or effectively longer than the total pulse duration).
Given that there are two scintillators with different values of τ in each phoswich element, the ratio of total to delayed integral will take on one of two different values for each event depending on the scintillator of interaction. According to equation (1), the larger value for that ratio will be associated with the “faster” scintillator (40 ns, LYSO), whereas the smaller value will be associated with the “slower” scintillator (60 ns, GSO). Given that “T” is fixed (at 100 ns on the VISTA), that difference in integral ratios identifies the scintillator of interaction. If the integral ratio is greater than a fixed threshold value set between the larger and smaller values, the event is assigned to the LYSO portion of the phoswich; if less than the threshold, the event is assigned to the GSO portion of the phoswich. In VISTA, that calculation is carried out in real time during data collection for each valid coincident scintillation event with an assignment accuracy of greater than 95%.1
Once the crystals-of-interaction are known for a coincident pair, the LOR for that event is uniquely identified and a counter for the number of these LORs occurring during the data collection is incremented by one unit. Data sets acquired by VISTA are thus composed of a long list of LOR “counters” (one for each of the more than 28 million possible LORs in the VISTA machine) that record the number of times a particular LOR is activated during a data collection.
Image Reconstruction with and without DOI Correction
The LOR data sets acquired in the phantom and mouse studies described below were first reconstructed into images using the normal VISTA DOI correction. That is, the light decay time information provided by equation (1) during data collection was used to assign an event to either the front LYSO crystal (length = 7 mm, average DOI = 3.5 mm) or to the back GSO crystal (length = 8 mm, average DOI from the front of the phoswich = 7 mm + 4 mm = 11 mm). This assignment scheme results in a set of three-dimensional LORs that contain the embedded DOI information. These LORs were then sorted into 61 two-dimensional sinograms (spatial bin width = 0.3875 mm) with the Fourier rebinning algorithm and reconstructed into (scatter-corrected) images with filtered backprojection and ramp filter cut off at the Nyquist frequency (1.29/mm).
To create images not corrected for DOI from these same phantom and mouse LOR data sets, new LOR data sets were created where all photons were assumed to interact in the scanner at the same radial depth, namely at a depth equal to half the total phoswich length, that is, 15 mm/2 = 7.5 mm. Transformation of the old to new data sets was accomplished in software by replacing the original LORs with new LORs that connected the centers of the pair of phoswich elements participating in the coincidence event regardless of which crystals in the phoswich actually participated in the coincidence event. These new LOR data sets were then reconstructed into images exactly as described above for the DOI-enabled data sets. Images obtained in this way simulate the situation that would exist in a geometrically identical small-animal PET scanner without DOI correction capability and with crystals the same total length and stopping power as those in VISTA.
Those two sets of images, reconstructed from exactly the same coincidence data sets and differing only in the DOI assignment within a phoswich element, were then compared to assess differences between the DOI-corrected and uncorrected images obtained in the resolution phantom and mouse studies described below.
Resolution Phantom Experiment
Relevant dimensions of the resolution phantom (Data Spectrum Corporation, Hillsborough, NC) are shown in Figure 3. This commercial, six-sector “hot rod” resolution phantom was positioned such that one edge of the phantom was very close to the (top) edge of the scanner FOV, where the DOI effect should be large. The phantom contained 450 μCi (16.6 MBq) of 18F at the start of imaging and was carefully aligned such that the radioactive rods were parallel to the geometric axis of the scanner. The phantom was first imaged for 40 minutes with the 1.6 mm rod sector at the 12 o’clock position, again (for 60 minutes) with the phantom rotated around its axis by 60°, placing the 1.6 mm sector at the 2 o’clock position, and again (for 90 minutes) with the phantom rotated an additional 60° (for a total of 120 degrees) around its axis, placing the 1.6 mm sector at the 4 o’clock position. All three data collections contained in excess of 400 M events.
Figure 3.
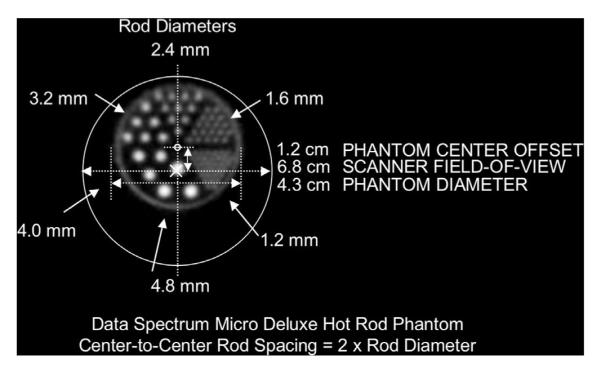
Pertinent dimensions of the “hot rod” resolution phantom. Note that the phantom axis is offset upward from the scanner axis by 1.2 cm to place the 12 o’clock sector of the phantom at the periphery of the scanner field of view.
The central 20 reconstructed transverse section images of the phantom (slices 21 through 40 of 61 total slices) from each data acquisition were summed to reduce statistical noise (this summing of slices is the reason for careful alignment between the axis of the phantom and the axis of the scanner). At the end of that process, three pairs of 20 pixel–thick transverse section images of the offset phantom were created, one pair for each rotation angle of the phantom. Each pair consisted of one image reconstructed using the phoswich center end point assignment and the second using the DOI end point assignment.
Mouse Imaging Experiment
To increase “throughput” in mouse imaging experiments, some investigators have adopted the side-by-side imaging strategy illustrated in Figure 4. Although that scheme improves throughput, it also potentially exacerbates DOI blurring of structures in these animals because both animals are now offset from the scanner axis and nearer the edge of the scanner FOV. In certain studies, for example, imaging tumors implanted on the flanks of side-by-side mice, these effects could be particularly large. This experimental arrangement thus provides a “real-world” opportunity to evaluate the effects of DOI correction in mice.
Figure 4.
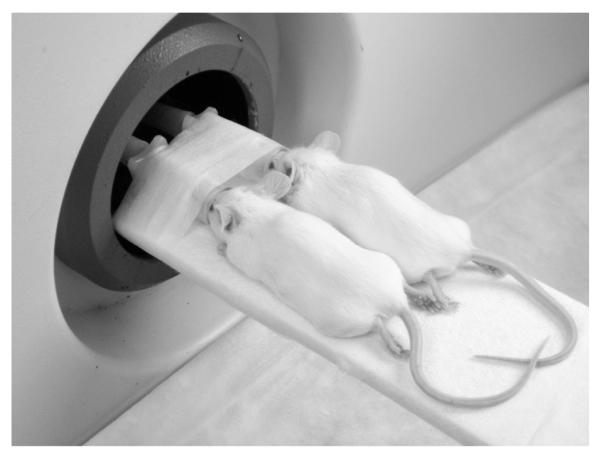
Illustration of simultaneous side-by-side imaging of two mice with the VISTA scanner. For size reference, the bore diameter of the VISTA machine is 8 cm.
To investigate the DOI consequences of that arrangement, two mice (32 and 28 g) were injected concurrently with 1.0 mCi (37 MBq) of 18F-fluoride, a high biologic-contrast skeletal imaging agent. The animals were placed for 3 hours in cages with absorbent bedding, sacrificed at the end of this period, and placed in the scanner as shown in Figure 4. The animals were sacrificed to ensure that no movement occurred during the extended imaging period that might confound image interpretation. The injected dose, 1.0 mCi/mouse (37 MBq/mouse), was chosen such that after 3 hours of skeletal uptake, biologic excretion of fluoride, and the physical decay of 18F, the total activity in both mice together would not exceed the recommended total maximum activity within the FOV of the VISTA scanner (about 450 μCi or 16.6 MBq) at the start of imaging.
The scanner was then configured to perform a four-bed position whole-body scan at 30 minutes per bed position with a six-slice overlap between bed positions and with an energy window of 250 to 700 keV. That extended imaging period was chosen such that the final whole-body study would allow comparison of one pixel–thick image slices with minimal statistical noise. The resulting whole-body scan of both mice together contained more than 430 M events. Those whole-body data were then reconstructed without and with DOI compensation as described above for the hot rod resolution phantom.
Results and Discussion
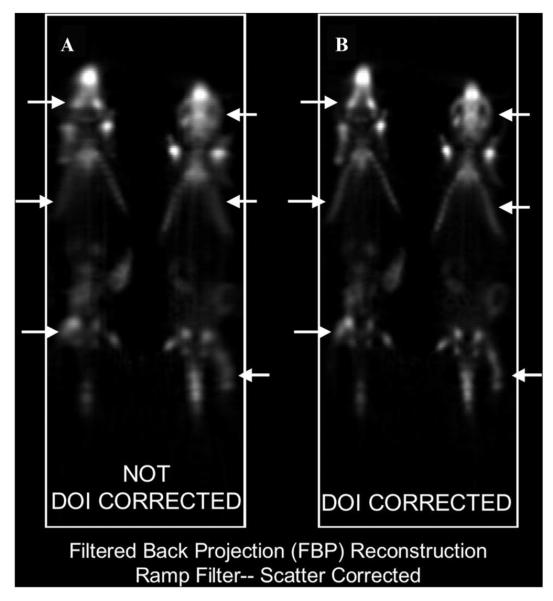
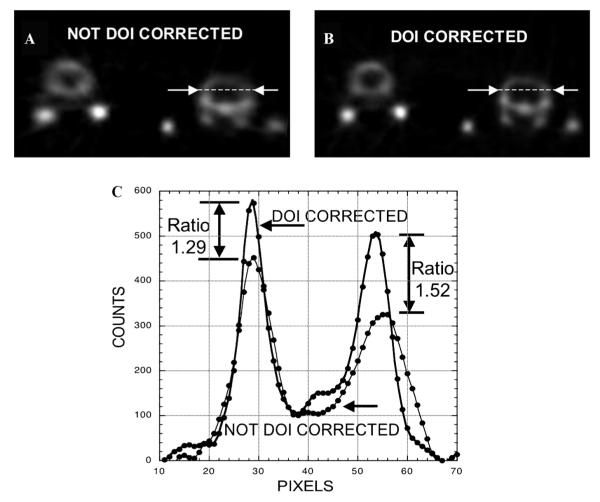
DOI-corrected and uncorrected images of the resolution phantom are compared in Figure 5. DOI-corrected and uncorrected mouse images are compared in Figure 6. Transaxial images through the skulls of the two side-by-side mice are compared in Figure 7.
Figure 5.
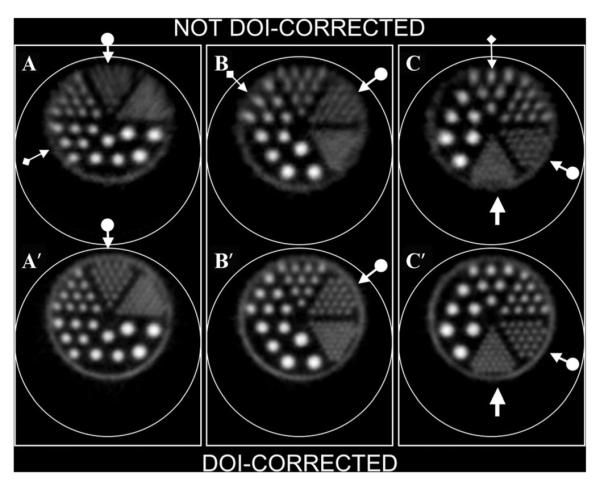
Transverse section images of the commercial six-sector “hot rod” phantom shown in Figure 3. Dot-arrows illustrate rotation of the 1.6 mm sector in 60° increments around the phantom axis from A to C. Note that rotation from the 12 o’clock position decreases the average radial distance of the 1.6 mm sector from the center of the scanner field of view (FOV) and improves resolution. The 1.6 mm rods cannot be clearly discerned as separate from one another in A but are individually identifiable in A’, indicating a significant reduction in DOI distortion near the edge of the FOV. Note also that the circular ring of activity completely surrounding the radioactive rods in all three DOI-corrected images is missing from the uncorrected images near the periphery of the FOV. Also, the 1.2 mm rods (regular arrows in C, C’) can be seen as separate in image C’, suggesting that spatial resolution is generally improved by DOI correction. Note radial elongation of rods in the uncorrected images (most evident in the 3.2 mm sector, diamond-arrows, images A, B, C).
Figure 6.
Coronal whole-body section through two side-by-side mice injected with 18F-fluoride reconstructed without DOI compensation (A) and same coronal section reconstructed with DOI compensation (B). Arrows in A and the corresponding arrows in B point to skeletal structures where the peripheral resolution differences between corrected and uncorrected images are particularly prominent. The corrected image (B) is also “sharper” everywhere, indicating globally improved spatial resolution.
Figure 7.
A, One pixel–thick transverse section image through the skulls of the two side-by-side animals shown in Figure 6 without DOI correction. B, Same one pixel–thick transverse section image but with DOI correction. C, Plot of counts versus distance along the (same) dotted line shown in A and B. Pixel dimensions in the transverse plane are 0.3875 mm × 0.3875 mm. “Ratio” is the peak height of the corrected curve divided by the peak height of the uncorrected curve, a measure of the difference in the magnitude of the partial-volume correction needed to obtain accurate estimates of skull tracer concentration. Note the slight outward radial shift of the peak of the uncorrected curve relative to the corrected curve for the two peaks nearest the periphery of the field of view (at the right).
Radial Resolution Uniformity
Careful inspection of the phantom images in Figure 5 suggests that the effect of DOI correction is substantial. In panel A-A’ of Figure 5, for example, the 1.6 mm radioactive rods (dot-arrows) cannot be reliably resolved individually in A but are clearly resolved in A’ after DOI correction. In addition, the thin ring of activity surrounding the radioactive rods, clearly seen as a complete circular border in the corrected images, is either not visualized or appears discontinuous in the uncorrected images, presumably owing to degraded resolution toward the periphery of the FOV.
Similar conclusions about the significance of DOI correction can be drawn from the animal images. Figure 6 and Figure 7 demonstrate that, for side-by-side mouse imaging, DOI correction yields almost equally sharp visualization of bilateral structures positioned toward the periphery and toward the center of the FOV; without DOI correction, the structures located toward the periphery appear more blurred than the contralateral structures positioned toward the center. Thus, DOI correction demonstrably improves the quality and, presumably, the quantitative accuracy of side-by-side imaging.
The qualitative differences described above can be quantified by measuring differences in the apparent size, location, and counts within structures with and without DOI correction. In Figure 7, counts are plotted along the same (dotted) line in the transverse section image of the skull of the right-hand animal of the pair shown in Figure 6 without (see Figure 7A) and with (see Figure 7B) DOI correction. As expected, each plot contains two peaks, one for each side of the skull.
The difference in full width at half maximum (FWHM) of the paired peaks is a rough measure of the resolution change with DOI correction. The FWHM of the innermost peak (nearest the center of the FOV) decreases, that is, improves, from 3.5 mm to 2.7 mm with correction, whereas the FWHM of the outermost peak (nearest the edge of the FOV) decreases from 5.4 mm to 3.5 mm with correction.
That difference in resolution is responsible for the difference in maximum counts between the corrected and uncorrected count profiles in both peaks. As each peak broadens with increasing loss of resolution, the peak maximum decreases. Given that loss of resolution increases with increasing radial position without DOI correction, the ratio of the maxima of the two curves nearest the center of the FOV is smaller (1.29) than the ratio of the maxima for the two profiles furthest from the scanner axis (1.52). Moreover, the change in magnitude of the two peaks in the same profile provides a measurement of uniformity over the transaxial FOV with and without DOI correction. From Figure 7C, peak magnitude changes by 14% between the left and right sides of the skull with DOI correction but by nearly twice as much (27%) without DOI correction. By those measures, therefore, images not corrected for DOI effects can underestimate peak target activity by a much larger amount (29% and 52%) compared to DOI-corrected images and do so with greater variation across the FOV (14%, DOI corrected vs 27%, not DOI corrected). Ultimately, the quantitative accuracy of activity concentration estimates in a small object depends directly on the magnitude of the associated partial-volume correction. That magnitude is, in turn, directly dependent on the resolution of the scanner. Given that DOI-corrected images exhibit better spatial resolution and a smaller variation in resolution with radial position, the magnitude of partial-volume corrections should be, in general, smaller and less variable for DOI-correcting machines such as VISTA and quantitative accuracy in estimating organ tracer content should be improved.
Radial Streaking and Displacement
The diamond-arrows in Figure 5 indicate locations in the uncorrected phantom images where radial streaking caused by radial resolution loss is particularly evident. A displacement of events toward the periphery is also evident in Figure 7, where the uncorrected plot of skull counts nearest the edge of the FOV is displaced outward relative to the corrected plot. Collectively, those results indicate that radial distortion is suppressed by DOI correction.
Central Resolution Improvement
Comparison of the DOI-corrected and uncorrected images in Figure 5(C-C’) shows that the 1.2 mm radioactive rods at the 6 o’clock position can be distinguished from one another in the DOI-corrected image (C’) but are barely, if at all, discernible from one another in the image not corrected for DOI distortion (C). That result is, at first glance, surprising because in panel C-C’, the 1.2 mm rod sector has been rotated into a position nearly at the center of the VISTA FOV, where parallax and radial distortion effects should be minimal. It would be expected, therefore, that the DOI-corrected and uncorrected images would be about the same in apparent resolution when in that position. Instead, resolution in the central region is better in the DOI-corrected image compared to its uncorrected counterpart.
That apparent improvement in resolution is likely due to the increase in spatial sampling density allowed by the phoswich arrays. There are, for example, four different LORs connecting any two noncollinear phoswich elements on opposite sides of the VISTA detector array (see Figure 2). In contrast, if these same phoswich elements are treated as regular (non-DOI) crystals, only one LOR (see Figure 1), rather than four LORs, connects this same pair.
As a result, conventional pixelated non–DOI-correcting scanners are inherently unable to meet the minimum sampling condition required by the Nyquist sampling theorem to achieve the maximum possible spatial resolution for that scanner design.14 A DOI-correcting scanner, on the other hand, makes many more spatially independent measurements of object activity along different LORS and so can, potentially, improve spatial sampling and come closer to satisfying or exceeding the Nyquist condition (two or more spatial samples per resolution element). The DOI resolution improvement shown in Figure 5C-C’ suggests that although spatial sampling in the central region may be relatively high in the non-DOI case, it is not high enough to satisfy the Nyquist condition over the entire central region, and only when the DOI correction is applied does the scanner approach or equal its maximum resolution limit.
The qualitative impression that VISTA images appear “sharper” than images from other non-DOI small-animal scanners may also be explained by this sampling effect because improved spatial sampling is not confined to the central region but occurs throughout the imaging volume. A similar improvement in image “sharpness” has also been observed by Yang and colleagues in “hot rod” phantom images similar to those shown in Figure 5 obtained with a prototype PET scanner with DOI capability.8
Finally, it is noteworthy that computational methods exist that can reduce the apparent differences observed in this study between DOI-corrected and uncorrected images15,16 and that can, within limits, improve apparent image quality in any scanner, including those already capable of hardware DOI correction, such as the VISTA machine.16 These model-based, iterative reconstruction methods, however, possess their own limitations, including extended computation time, potential artifact generation, and other practical complications, that have yet to be fully overcome. In the meantime, a number of laboratories have continued to work on hardware solutions to the DOI problem with the intent of increasing the resolution of DOI measurements.2,4–12 These hardware improvements, in combination with advanced computational methods, should yield small-animal PET images of exceptional quality.
Conclusions
The results of this study support three conclusions. First, two-level DOI correction significantly reduces radial resolution loss with increasing radial position and improves resolution uniformity compared to a geometrically equivalent machine without DOI correction. Second, radial streaking and radial displacement of source positions are suppressed by DOI correction and the geometric shapes and positions of sources near the periphery of the FOV are better preserved. Third, the increase in spatial sampling density associated with DOI correction may contribute to improved spatial resolution in the central FOV (and elsewhere) compared to a geometrically equivalent scanner without this capability.
Acknowledgments
The authors wish to express their gratitude to Mr. Srish Sinha (GE Healthcare) for his encouragement in initiating this work and for his helpful suggestions in study design. The authors also wish to thank Mr. James Fox (Johns Hopkins Medical Institutions) for his expert technical contributions.
Financial disclosure of authors: The authors wish to express their thanks to GE Healthcare for providing funding for this project. Trident Imaging has consulted for GE Healthcare and has an indirect financial interest in the VISTA machine.
Footnotes
Financial disclosure of reviewers: None reported.
References
- 1.Wang Y, Seidel J, Tsui BMW, et al. Performance evaluation of the GE Healthcare eXplore VISTA dual-ring small-animal PET scanner. J Nucl Med. 2006;47:1891–200. [PubMed] [Google Scholar]
- 2.Seidel J, Vaquero JJ, Siegel S, et al. Depth identification accuracy of a three layer phoswich PET detector module. IEEE Trans Nucl Sci. 1999;46:485–90. [Google Scholar]
- 3.Yang Y, Qi J, Wu Y, et al. Depth-of-interaction calibration of PET detectors with dual-ended readout by PSAPDs. Phys Med Biol. 2009;54:433–45. doi: 10.1088/0031-9155/54/2/017. [DOI] [PMC free article] [PubMed] [Google Scholar]
- 4.St. James S, Yang Y, Wu Y, et al. Experimental characterization and system simulations of depth-of-interaction PET detectors using 0.5-mm and 0.7-mm LSO arrays. Phys Med Biol. 2009;54:4605–19. doi: 10.1088/0031-9155/54/14/015. [DOI] [PMC free article] [PubMed] [Google Scholar]
- 5.Inadama N, Murayama H, Hamamoto M, et al. Eight-layer DOI encoding of three dimensional crystal array. IEEE Trans Nucl Sci. 2006;53:2523–8. [Google Scholar]
- 6.Tsuda T, Murayama H, Kitamura K, et al. A Four-layer depth-of-interaction detector block for small-animal PET. IEEE Trans Nucl Sci. 2004;51:2537–42. [Google Scholar]
- 7.Yamamoto S, Ishibashi H. A GSO depth-of-interaction detector for PET. IEEE Trans Nucl Sci. 1998;45:1078–82. [Google Scholar]
- 8.Yang Y, Wu Y, Qi J, et al. A prototype PET scanner with DOI-encoding detectors. J Nucl Med. 2008;49:1132–40. doi: 10.2967/jnumed.107.049791. [DOI] [PMC free article] [PubMed] [Google Scholar]
- 9.Salvador S, Huss D, Brasse D. Design of a high performance small-animal PET system with axial oriented crystals and DOI capability. IEEE Trans Nucl Sci. 2009;56:17–23. [Google Scholar]
- 10.Lerche CW, Benlloch JM, Sanchez F, et al. Depth of gamma ray interaction within continuous crystals from the width of its scintillation-light distribution. IEEE Trans Nucl Sci. 2005;52:560–72. [Google Scholar]
- 11.Yang Y, Wu Y, Cherry SR. Investigation of depth-of-interaction encoding for a pixelated LSO array with a single multi-channel PMT. IEEE Trans Nucl Sci. 2009;56:2594–9. doi: 10.1109/TNS.2009.2016094. [DOI] [PMC free article] [PubMed] [Google Scholar]
- 12.Tsuda T, Murayama H, Kitamura K, et al. Performance evaluation of a subset of a four-layer LSO detector for a small-animal DOI PET scanner: jPET-RD. IEEE Trans Nucl Sci. 2006;53:35–9. [Google Scholar]
- 13.Knoess C, Boellaard R, Lenox M, et al. Evaluation of the depth-of-interaction (DOI) for the high resolution research tomograph (HRRT)—a comparison between scanners with and without DOI. IEEE Nucl Scie Symp Conf Rec. 2002;3:1447–51. [Google Scholar]
- 14.Phelps ME, editor. PET: physics, instrumentation and scanners. Springer; New York: 2006. [Google Scholar]
- 15.Böning G, Pichler BJ, Rafecas M, et al. Implementation of Monte Carlo coincident aperture functions in image generation of a high-resolution animal positron tomograph. IEEE Trans Nucl Sci. 2001;48:805–10. [Google Scholar]
- 16.Herraiz JL, España S, Vaquero JJ, et al. First: fast iterative reconstruction software for (PET) tomography. Phys Med Biol. 2006;51:4547–65. doi: 10.1088/0031-9155/51/18/007. [DOI] [PubMed] [Google Scholar]


