

Abstract
Purpose.
Two methods were used to study the stages of macular telangiectasia (MacTel): Power-Doppler optical coherence tomography (PD-OCT), which allows imaging of the retinal circulation in three dimensions, and macular pigment optical density (MPOD), which quantifies the distribution of macular carotenoids.
Methods.
Among 49 patients with MacTel identified, 12 eyes (6 patients) with MacTel and 7 age-matched control eyes (7 patients) were imaged with a custom-built Fourier-domain OCT instrument to acquire PD-OCT images. MPOD was measured using heterochromatic flicker photometry in 10 eyes (5 patients) with MacTel and compared with 44 age-matched control eyes (44 patients). Clinical staging of MacTel was based on best-corrected visual acuity, fundus biomicroscopy, fluorescein angiography, and OCT.
Results.
Stage 1 eyes (n = 2) had subtle punctate vascular signal confined to the inner portion of the outer plexiform layer (OPL) on PD-OCT. Stage 2 (n = 2) showed larger oblique vascular signal extending into deeper OPL. Stage 3 (n = 5) had disruption of outer retinal layers with abnormal vasculature extending into the outer nuclear layer. Stage 4 (n = 3) showed diffuse blurring of the retinal layers with vascular channels extending the full thickness of the retina. MPOD values in four eyes with stage 1 or 2 MacTel correlated well with age-matched controls. Six eyes with stage 3 or 4 MacTel had loss of MPOD especially at the fovea.
Conclusions.
PD-OCT shows penetration of the retinal capillaries into the deeper retinal layers in early stages of MacTel, with full thickness vascular proliferation in advanced disease. MPOD is commonly depleted but may appear normal in early stage MacTel.
Keywords: idiopathic macular telangiectasia, retinal telangiectasia, Power-Doppler, optical coherence tomography, macular pigment, heterochromatic flicker photometry
Power-Doppler OCT can visualize vascular abnormalities in MacTel. Early stages are characterized by retinal capillaries penetrating into deeper layers, leading to full thickness retinal vascular changes in advanced disease. MPOD is depleted in advanced disease but may be normal in early stages.
Introduction
Macular telangiectasia (MacTel) is thought to be a relatively rare entity characterized by retinal telangiectasis confined to the juxtafoveal retina. Although vascular endothelial growth factor was recently implicated in its pathophysiology,1 the exact pathogenesis remains unknown. Patients diagnosed with MacTel usually present with gradually decreased vision in the fifth to seventh decades of life.2–4 By fundoscopy, MacTel is characterized by bilateral (although sometimes asymmetric) perifoveal telangiectatic changes. Based on limited histologic data, the telangiectatic changes are believed to originate in the deep retinal capillary plexus of the inner nuclear layer and to progress to involve the superficial retinal capillary plexus during the early nonproliferative stages.5 The condition clinically becomes proliferative when the vasogenic process extends under the retina forming detachments and retinal–retinal anastomosis, eventually leading to disciform scarring.5 Visual prognosis is worse when associated with intraretinal pigment clumping, parafoveal atrophy, and neovascularization.6 Gass and Blodi classified MacTel into five stages in 1993 based on histologic, slit-lamp biomicroscopic, and fluorescein angiographic (FA) findings. A summary of this progression and staging, which was further refined by Yannuzzi, can be found in Table 1.2,3
Table 1.
Modified Classification of MacTel Type 2*
|
Stage |
Pathophysiology |
Findings |
| Stage 1: nonproliferative deep capillary | Proliferation of deep capillary plexus in juxtafoveal area | Mild retinal thickening mostly in inner layers, on histology Very few cystic changes and only mild staining with fluorescein (not appreciable clinically) Subtle loss of retinal transparency in juxtafoveal area |
| Stage 2: superficial capillary | Early involvement of the superficial inner retinal capillary plexus Telangiectatic proliferation in the inner capillary plexus freely anastomosing with the deep capillary plexus |
Dilated telangiectatic capillaries associated with multilaminated endothelial layers, on histology Focal areas of juxtafoveal leakage within the walls of abnormal capillary vessels, sparing the fovea |
| Stage 3: subinternal limiting membrane and foveal area | Extension of capillary growth into the subinternal limiting membrane through the posterior aspects of the retina toward the pigment epithelium, and centripetally toward the perifoveal region | Involvement of the inner retinal and subinternal limiting membrane with distortion and contraction of the foveal zone, best seen on FA Minimal leakage into the perifoveal area with foveal cysts, on OCT More extensive vasogenic process involving the fovea, with prominent right-angle venules |
| Stage 4: proliferative | Extension of the intraretinal vasogenic process throughout all layers of the retina, including the subretinal space SRN secondary to extension below the retina Further loss of macular pigment, showing an inner lamellar cyst |
Telangiectatic intraretinal vascular change within the deep and superficial capillary layers, with extension toward the subinternal limiting membrane Arteriolar and venular vessels coursing from inner retinal capillary plexus into deep retina, and beyond into the subretinal space with anastomoses with the SRN |
| Stage 5: fibrovascular proliferation | Fibrovascular proliferation extends from the subretinal space through the retina in the central foveolar area Retina–retinal anastomoses Rarely, the choroidal circulation may contribute to the vascular complex |
Conglomerate of fibrous and vascular tissue, extending from the preretinal space through to the subretinal space Aggregations of reactive pigment epithelial hyperplasia Fibrovascular manifestations through the retina into the subretinal space with descending arterioles and venules perfusing the vascular complex from the retina |
The diagnosis of early MacTel can be challenging clinically because of subtle clinical findings. In fact, stage 1 disease may be underdiagnosed since it is classically diagnosed in a normal-appearing contralateral fundus of patients with stages 2 to 5 MacTel in one eye (Table 1).7 Other early findings of MacTel include loss of retinal transparency, which can be somewhat subjective, and fine telangiectatic vessels, which may be identifiable only by FA. Given the subtle clinical signs of early disease, Fourier-domain optical coherence tomography (Fd-OCT) is emerging as a useful adjunct to aid in diagnosis and staging.8–10 Characteristic microcystic changes within the retinal layers and patches of photoreceptor disruption have been described using Fd-OCT as similar to changes described for some forms of toxic maculopathy.11 However, these changes are mostly seen in later stages of the condition.
In this study, we used two modalities to characterize retinal changes associated with various stages of MacTel in order to improve our understanding of the pathogenesis of this condition, which remains controversial. A novel imaging technique described as Power-Doppler OCT (PD-OCT) was used to study the intraretinal vascular changes associated with stages of this condition in three-dimensions since there are limited histologic data available especially in the early stages of this disease. PD-OCT provides a three-dimensional image of the vasculature noninvasively in vivo by processing phase changes in the OCT output signal that are created by movement of blood through the retinal circulation. Phase changes, also known as Power-Doppler shift calculations, are seen in rapidly consecutive axial scans of Fd-OCT and can be used to map retinal blood vessels and in some cases to quantify retinal blood flow velocity.12,20 PD-OCT used in this study is similar to previously described “phase-variance” OCT in that both render images of the retinal capillary structure in three-dimensions without flow velocity information.18
In this study, macular pigment optical density (MPOD) was also measured using heterochromatic flicker photometry (HFP) in eyes at various stages of MacTel. HFP is the most widely used psychophysical method for measuring MPOD.13–15 Loss of macular pigment has been reported to be a common finding in this condition, but limited data are available on MPOD in early stages of this condition.6,16
Methods
This is a prospective observational case series of patients diagnosed with various stages of MacTel and age-matched normal subjects tested with PD-OCT and HFP for MPOD. The study was conducted according to a protocol approved by the Office of Human Research Protection of the University of California–Davis (UC Davis) School of Medicine and adhered to the tenets of the Declaration of Helsinki. The charts and electronic medical records were reviewed to identify all 49 patients diagnosed with “macular telangiectasia” seen at the UC Davis Eye Center between November 2003 and October 2011. Six subjects (12 eyes) who met the inclusion and exclusion criteria of the study agreed to participate. The inclusion criteria were diagnosis of MacTel confirmed by FA (stages 1–4), best-corrected visual acuity (BCVA) ≥20/100, and ability to perform PD-OCT imaging and commercial FD-OCT imaging (Cirrus OCT; Carl Zeiss Meditec, Dublin, CA). The severity of MacTel was graded based on clinical exam and imaging; however, the examiners were blinded to this clinical information when obtaining and interpreting the PD-OCT images. Exclusion criteria included any other concurrent ocular condition that may affect BCVA or macular findings. Informed consent was obtained at enrollment. Among subjects imaged with PD-OCT, five subjects (10 eyes) with BCVA ≥20/40 were evaluated further for MPOD using HFP.17 For comparison, seven age-matched normal eyes (seven subjects) were imaged with PD-OCT, and a separate cohort of 44 age-matched normal eyes (44 subjects) had MPOD measured by HFP after obtaining informed consent.
Power-Doppler Optical Coherence Tomography
A custom-built Fd-OCT system at the UC Davis Eye Center was used to obtain three-dimensional perfusion maps of the human retina. Extensive details of the Fd-OCT system and image processing are described elsewhere.18,19 Briefly, in vivo retinal images (dimensions, 1.5 mm × 1.5 mm) were acquired with fiber-based Fd-OCT using a broad-bandwidth superluminescent diode (Superlum Ltd., Cork, Ireland) having an 855 nm central wavelength (75 nm full-width half-maximum). The image resolution at the retinal plane was approximately 4.5 μm axially and 15 μm transversely. An imaging protocol consisted of 375 axial scans (A-scans) and 360 cross-sectional B-scans with 3 successive scans (BM-scan) over the same location. The beam entrance power at the subject's pupil was 700 μW for the imaging protocol, below the American National Standards Institute (ANSI) laser safety limit. The A-scan rate was 125,000 lines/s using 2048 pixels of a complementary metal-oxide semiconductor (CMOS) detector (spl4096-140km; Basler, Ahrensburg, Germany). This imaging speed is three times faster than commercial systems; one volumetric data set was acquired in approximately 3.5 seconds. Pupils were fully dilated before image acquisition.
To compensate for axial eye motion, three acquired B-scans in a BM-scan were aligned along the z-direction with cross-correlation between the consecutive B-scans of the OCT intensity data. Additionally, bulk motion associated with cardiac pulsations or microsaccades were corrected with phase values in order to minimize artifactual signal. After such alignments, the OCT reflectivity image was generated from the average of three B-scans in a single BM-scan, as shown in Figure 1A. Note that a yellow arrow in Figure 1A points to one example of shadow artifact that originates from superficial large caliber vessels (yellow dotted circle) and penetrates posteriorly even to the choroid layer. In OCT instruments, more retinal layers must be traversed by the imaging beam in order to visualize deeper structures. This causes well-known shadow artifacts in intensity OCT images (lower signal) beneath light-scattering or absorbing structures such as blood vessels and deposits. In the case of PD-OCT, the same effect (i.e., traversing multiple layers before reaching deeper in the B-scan) is responsible for creating phase artifacts below blood vessels in PD-OCT B-scans. Specifically, the portion of the light beam traveling through a vessel that was not absorbed or scattered experiences variation in optical media, which alters the overall phase of the light beam beneath the vessel. This is responsible for PD-OCT signal artifacts corresponding to the location of the classic shadow of OCT intensity imaging. This is more evident beneath the large vessels and bright structures including the inner segment/outer segment (IS/OS) junction and RPE because we applied OCT reflectivity-based intensity thresholding in order to reduce random-phase noise. Note that these shadow artifacts can also be differentiated from true signals by tracing the signals en face or by serial review of consecutive B-scans.20 A final composite OCT image as shown in Figure 1C yields details of structural and circulatory information from the averaged gray-scale OCT intensity (Fig. 1A) overlaid with red Power-Doppler imaging (Fig. 1B) using ImageJ software (National Institutes of Health [NIH], Bethesda, MD). Contrast and magnification were adjusted to maximize visualization.
Figure 1.
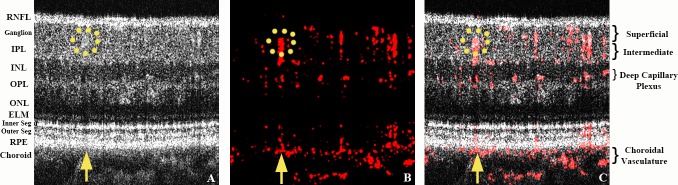
Power-Doppler OCT image acquisition of a normal macula. The yellow upward arrow points to a representative normal shadow artifact resulting from a larger superficial vessel highlighted with a yellow dotted circle. Most of the radial-oriented signals in this image represent shadow artifacts. They can be differentiated from true vascular signals by scanning the serial B-scans to determine whether they follow the course of the overlying vessel. (A) OCT reflectivity BM-scan image obtained from the average of three B-scans showing the various layers of the retina. (B) Calculated Power-Doppler values from an averaged BM-scan (red denotes the phase signal; i.e., retinal blood flow); (C) final composite image of first two images (A, B) superimposed over each other.
Macular Pigment Optical Density
We measured macular pigment optical density using an instrument from Macular Metrics (Providence, RI),17 which is equivalent to our previous laboratory-based systems.21,22 Briefly, the stimulus consisted of a 10°, 3.0-cd/m2, 470-nm adapting background. Superimposed on the background was one of five test stimuli: two test spots of 15-min and 30-min arc diameter, two circular rings of 1° and 1.75°, and a 2° circle for the peripheral measurement at 7°. The test stimuli were composed of two narrow-band lights (from light-emitting diodes) having dominant wavelengths of 460 nm and 550 nm that were alternated in square-wave counterphase. The flicker frequency was selected for each subject based on preliminary tests of flicker sensitivity. The subject's task was to eliminate or minimize the flicker by turning a dial that changed the intensity of the 460-nm light. The subject viewed the stimulus in free view from a chin and forehead rest and with habitual refractive correction. Prior to each session, the light intensity from each wavelength was calibrated with a photodiode. The radiance and MPOD levels at 7° eccentricity served as a reference area where macular pigment levels are assumed to be unchanging with further eccentricity.23 These findings were compared with those measured in the right eye of 44 age-matched normal subjects of diverse ethnicity.
Statistical Analysis
Statistical analyses were performed using the SAS Software (version 9.3; SAS Institute, Inc., Cary, NC) procedure PROC TTEST. Independent sample t-tests using pooled variance estimates were performed to test for differences in normal versus each stage of MacTel (1–4). Only one diseased patient had both eyes in the same stage. Therefore, in order to conform to the independence assumption required by the t-test, only one observation per patient was included in a given sample. For this patient, only the right eye was used, which was chosen merely because the right eye was used in the control sample. A P value of less than 0.05 was considered statistically significant.
Results
Twelve eyes from six patients with MacTel were imaged using Fd-OCT and PD-OCT. Demographics and clinical information are summarized in Table 2. Among these 12 eyes with MacTel, MPOD was obtained in 9 eyes with BCVA of 20/40 or better. The results are summarized in Table 3 and displayed graphically in Figures 2 through 5. MPOD was not significantly different in eyes with stages 1 and 2 MacTel (four eyes) compared with age-matched controls, except at 1.75° eccentricity in stage 1 disease. Significantly decreased MPOD levels were noted at all retinal eccentricities in stages 3 and 4 MacTel (six eyes) (Table 3). This difference was most pronounced centrally in these advanced MacTel eyes.
Table 2.
Demographic and Clinical Information of All Subjects With Macular Telangiectasia Imaged Using Power-Doppler OCT
|
Patient/Age/Sex |
BCVA OD |
BCVA OS |
Pertinent Past Medical History |
Past Ocular History |
MacTel Staging OD |
MacTel Staging OS |
| 1/56/F | 20/20 | 20/20 | None | None | 1 | 2 |
| 2/84/F | 20/20 | 20/20 | HL, DVT, PE | Mild ARMD; PC IOL OU | 1 | 3 |
| 3/63/M | 20/25 | 20/20 | None | Mild ERM OU | 2 | 3 |
| 4/54/F | 20/40 | 20/40 | Asthma | Mild ERM OU | 3 | 3 |
| 5/48/F | 20/25 | 20/40 | HTN, HL | Ocular HTN OU | 3 | 4 |
| 6/57/F | 20/40 | 20/80 | HTN, DM, asthma, cervical cancer | None | 4 | 4 |
BCVA, best-corrected visual acuity at the time of imaging; HL, hyperlipidemia; DVT, deep vein thrombosis; PE, pulmonary emboli; ARMD, early age-related macular degeneration without central macular involvement; PC IOL, posterior chamber intraocular lens implantation; OU, both eyes; ERM, mild epiretinal membrane without evidence of macular traction by OCT; HTN, hypertension; DM, diabetes mellitus.
Table 3.
Macular Pigment Optical Density at Tested Retinal Eccentricities Among Age-Matched Normal Individuals (N = 44) Versus Eyes With MacTel (N = 10)
|
Disease Stage |
Number of Eyes |
Mean MPOD Measurement at Various Eccentricities* |
|||||||
|
0.25° |
P
Value |
0.50° |
P
Value |
1.00° |
P
Value |
1.75° |
P
Value |
||
| Control | 44 | 0.6064 | N/A | 0.5073 | N/A | 0.3282 | N/A | 0.1518 | N/A |
| Stage 1 | 2 | 0.3800 | 0.1714 | 0.3000 | 0.1788 | 0.1400 | 0.0932 | −0.0300 | 0.0072 |
| Stage 2 | 2 | 0.5550 | 0.7496 | 0.4650 | 0.7782 | 0.2850 | 0.6905 | 0.1050 | 0.4602 |
| Stage 3 | 4 | 0.0825 | <0.0001 | 0.0575 | 0.0001 | 0.0575 | 0.0009 | 0.0150 | 0.0037 |
| Stage 4 | 1 | −0.0800 | 0.0041 | −0.0800 | 0.0077 | 0.0000 | 0.0366 | −0.0400 | 0.0359 |
P value comparing control versus diseased eyes of various stages at each retinal eccentricity. Values less than 0.05 were considered statistically significant and are highlighted in bold.
Figure 2.

Stage 1 MacTel disease. (A) Fundus photography of right eye of patient No. 2 is unremarkable except for some hard macular drusen with faint graying or hypopigmentation just temporal to the fovea. (B) Late view fluorescein angiography showing barely visible punctate hyperfluorescence and fine telangiectatic vessels temporal to the foveal avascular zone. (C) Fd-OCT showing subtle focal outer layer hyporeflective irregularities (yellow arrow) between the outer plexiform layer and outer nuclear layer temporal to the fovea. (D) PD-OCT image through the temporal perifoveal zone denoted by yellow dotted line in (B) showing retinal blood flow originating at the outer plexiform layer and diving abnormally deep into the outer nuclear layer (yellow arrow). (E) MPOD levels at various levels of eccentricity compared with age-matched controls show a similar slope.
Figure 5.

Stage 4 MacTel disease. (A) Fundus photography of the right eye of patient No. 6 shows graying and depigmentation of the temporal perifoveal region with a small dark pigmented plaque. (B) Late view of fluorescein angiography showing prominent leakage temporal to the fovea. (C) Fd-OCT showing patch of diffuse disruption of the retinal layers with a possible small pigment epithelial detachment (yellow arrow). (D) PD-OCT B-scan image of the temporal perifoveal region depicted by dotted yellow line in (B) showing apparent vascular signals extending the entire thickness of the retina and connecting the inner and outer retinal layers, adjacent to outer retinal cysts and photoreceptor atrophy, with possible anastomoses into the subretinal/choroidal space. (E) MPOD levels at various levels of eccentricity compared with age-matched controls show reduced levels throughout.
Figure 1 shows a typical B-scan image of the retinal vasculature relative to the retinal layers in the macula obtained using PD-OCT from a healthy control subject. The normal branches of larger retinal vessels forming three capillary beds are noted histologically: (1) the superficial capillary plexus located in the ganglion cell layer; (2) the intermediate plexus also known as the inner deeper plexus located at the inner edge of the inner nuclear layer; and (3) the outer deeper capillary plexus located at the outer edge of the inner nuclear layer.24 In normal eyes, no detectable retinal vessels extend into the outer plexiform layer (OPL) or outer nuclear (ONL) layer except for some shadowing artifacts (Fig. 1, yellow arrows).25 Shadowing artifact from superficial hyperintense signals, such as from large-caliber blood vessels, is evident in normal Fd-OCT intensity images (Fig. 1A); however, by scanning serial B-scan images and tracing the signals, we can differentiate shadowing artifacts from two vascular channels superimposed over each other on a single B-scan image. Our observations using PD-OCT imaging of the normal vasculature were confirmed by reference to histologic information.
In stage 1 MacTel eyes (n = 2), funduscopy was essentially normal except for faint depigmentation of the temporal perifoveal zone (Fig. 2A). The diagnosis was made based on the fellow eye (Table 2). Fluorescein angiography showed barely detectable perifoveal telangiectatic changes with minimal leakage (Fig. 2B). The Fd-OCT scans were relatively unremarkable except for mild focal hyporeflective/hyperreflective irregularities between the OPL and ONL temporal to the fovea (denoted by the yellow arrow in Fig. 2C) in the region of the perifoveal vascular changes noted on FA. B-scan PD-OCT images of this perifoveal region showed subtle vascular signal extending into the outer aspect of the OPL with some focal extension into the superficial outer nuclear layer (Fig. 2D, yellow arrow). MPOD was measured in the two eyes diagnosed with this stage of MacTel. Figure 2E shows that the slope of the MPOD measurements of both eyes was similar to normal age-matched controls, although the values in one eye (i.e., patient No. 2 OD) showed a negative shift relative to age-matched controls. The mean MPOD in stage 1 MacTel was not statistically different compared with age-matched controls (P value range, 0.0932–0.1714), except at 1.75° eccentricity (P = 0.0072). BCVA was 20/20 in this group.
In stage 2 MacTel eyes (n = 2), slight graying and loss of transparency of the parafoveolar retina were seen on funduscopy (Fig. 3A) with a right-angle venule noted in one eye. Mild telangiectatic and microaneurysmal changes were seen by FA adjacent to the fovea with mild late leakage (Fig. 3B). Fd-OCT showed no photoreceptor changes (i.e., both the external limiting membrane [ELM] and the photoreceptor IS/OS junction were intact). PD-OCT B-scan images showed larger caliber oblique vascular signal abnormally extending into deeper retinal layers (i.e., OPL; denoted by the yellow arrow in Fig. 3D). MPOD measurements were normal compared with controls (P value range, 0.1050–0.555, at all eccentricities; Fig. 3E). BCVA was 20/25 or better in this group.
Figure 3.

Stage 2 MacTel disease. (A) Fundus photography of the left eye of patient No. 1 is unremarkable except for possible trace hypopigmentation of the superior and temporal perifoveal region and a right-angle venule temporal to the fovea. (B) Late view of fluorescein angiography showing trace leakage with mild telangiectatic vessels in superior and temporal perifoveal region. (C) Fd-OCT shows no intraretinal cysts or photoreceptor layer abnormalities. (D) PD-OCT B-scan image of the superonasal perifoveal region (yellow dotted line in [B] demonstrates the higher caliber vascular flow in the outer plexiform layer and diving deeper into the outer nuclear layer. (E) MPOD levels at various levels of eccentricity compared with age-matched controls showing normal macular pigment relative to age-matched controls for both tested eyes in this stage of MacTel.
In stage 3 MacTel eyes (n = 5), dilated and blunted right-angle venules were noted on funduscopy, along with perifoveal telangiectasis visible on funduscopy and FA in all eyes (Figs. 4A, 4B). Fine intraretinal hyperreflective deposits were more consistently noted on Fd-OCT. In addition, Fd-OCT showed small intraretinal cysts and apparent patches of photoreceptor loss as evident by focal collapse of the ONL and/or focal loss of the IS/OS junction (Fig. 4C, yellow arrow). PD-OCT B-scan images confirmed the progressive focal disruption and/or atrophy of outer retinal layers noted on Fd-OCT with retinal vascular signals being noted in the deeper OPL (Fig. 4D, asterisk) and penetrating into the deeper ONL focally in the area of apparent outer retinal atrophy (Fig. 4D, yellow arrow). Hyporeflective spaces were seen adjacent to these abnormally diving retinal vascular signals suggestive of focal cystic changes or focal retinal detachment. MPOD measurements (Fig. 4E) were abnormally low compared with age-matched controls (P < 0.01 at all retinal eccentricities but most pronounced foveally). BCVA ranged from 20/20 to 20/40 for eyes in this group.
Figure 4.

Stage 3 MacTel disease. (A) Fundus photography of right eye of patient No. 5 shows a mildly blunted foveal reflex with right-angle venule temporal to fovea. There is some loss of the macular pigment temporally. (B) Late view of fluorescein angiography shows prominent leakage temporal to the fovea associated with fine telangiectatic vessels. (C) Fd-OCT shows photoreceptor loss temporal to the fovea (yellow arrow), with fine cystic changes within the retina. (D) PD-OCT B-scan image shows intraretinal vascular signal within the outer plexiform layer (yellow asterisk), which appears to dive into the deeper outer nuclear layer in regions of disruption of photoreceptor IS/OS junction (yellow arrow). (E) MPOD levels at various levels of eccentricity compared with age-matched controls show decreased MPOD for all eyes and eccentricities tested in this stage of MacTel. The decrease is most pronounced centrally.
In stage 4 MacTel eyes (n = 3), right-angle venules, retinal crystals, and telangiectasis were all apparent on fundus biomicroscopy (Fig. 5A). Ischemia and marked late leakage in the temporal perifovea were evident on FA (Fig. 5B). Both deep and superficial intraretinal hyperreflective deposits and cysts were noted on Fd-OCT with focal diffuse blurring of the retinal layers. Concurrent with the focal blurring of the retinal layers was a focal loss or disruption of the photoreceptor IS/OS layer. A focal area of hyperreflectivity contiguous with the adjacent RPE was noted in one eye, which may represent a small pigment epithelial detachment (Fig. 5C, yellow arrow). PD-OCT B-scan images of the affected temporal perifoveal region showed advanced photoreceptor disruption with large retinal vascular signals connecting the superficial and deep retinal layers suggestive of retinal–retinal anastomoses. Some of the retinal vascular signals appear to extend into the subretinal space, suggestive of retinal–subretinal anastomoses (denoted by the yellow arrow in Fig. 5D) and superficially through the nerve fiber layer. More marked intraretinal and subretinal cystoid changes were also seen adjacent to abnormal vasculature. MPOD was measured in only one eye in this group because of poor BCVA in the remaining eyes. This was abnormally decreased compared with age-matched controls (Fig. 5E; P < 0.05 at all levels of eccentricity). BCVA was 20/40 to 20/80 among eyes diagnosed in this group.
Discussion
PD-OCT and HFP were used to examine retinal vascular and macular pigment changes associated with various stages of MacTel (i.e., idiopathic perifoveal telangiectasia type 2). The study was conducted in order to improve our understanding of the pathogenesis of this condition, which remains controversial.
Power-Doppler Optical Coherence Tomography
PD-OCT composite images highlight microvasculature (red color) in three-dimensions noninvasively, similar to phase-resolved motion detection methods used in phase-variance OCT.26 By combining a PD-OCT image with an Fd-OCT structural image, retinal vascular changes and the associated retinal morphologic changes can be studied simultaneously; this technique was a valuable tool for this study. The relative depth of the retinal vascular changes and their proximity to and association with retinal morphologic changes noted with Fd-OCT also can be studied unlike the two-dimensional en face image of the retinal vascular flow obtained with FA. This new technique allows visualization of retinal microcapillaries in the human retina as small as 5 to 10 μm in diameter. A previous study using an analogous phase-variance OCT showed that the size of the foveal avascular zone measured using this type of technology was similar to that obtained using FA in normal eyes and eyes with diabetic retinopathy.26
PD-OCT, the more current prototype of this technology, was used in this study to identify the progressive perifoveal retinal vascular changes associated with various stages of MacTel. Three-dimensional retinal vascular imaging in vivo with this condition has not been reported previously. The currently theorized pathogenesis of this condition is based on only limited available histologic data, OCT morphologic findings, and clinical findings.2,3
In our study, PD-OCT provided new insights to the pathogenesis of MacTel in vivo. In early stages of this disease (i.e., stages 1 and 2), where minimal changes are noted on funduscopy, OCT, MPOD, and FA, detectable abnormality in the retinal vasculature can be seen on PD-OCT as the retinal vessels that normally perfuse the superficial layers are seen abnormally diving into the deeper OPL. In later stages of the disease, these abnormal vessels appear to dive even deeper into the ONL, which itself may become affected by progressive atrophy of the outer retina associated with this condition. PD-OCT detected the eventual formation of full thickness retinal vascular channels with possible retinal–retinal or even retinal–subretinal anastomoses, which was theorized to characterize stage 4 MacTel. We recognize that it is sometimes difficult to distinguish deeper retinal layers in two-dimensional photos owing to overlying shadow artifact; however, characterization can still be made by observing vasculature without overlying vessels, by looking for oblique vessels, and by scanning serial B-scan images to follow the course of overlying vascular channels. Eventually these advanced vascular changes may lead to disciform scarring and severe vision loss characteristic of stage 5 disease, perhaps after the development of subretinal neovascular membrane. Our study did not include any eyes with stage 5 disease but demonstrates that the progression of retinal vascular changes and the associated concurrent retinal morphologic changes can be studied concurrently and in unprecedented detail using PD-OCT.
The retinal vasculature changes associated with various stages of MacTel noted in our study appear similar to that proposed by Gass and Blodi,2 except we did not detect significant proliferation of the capillaries into the subinternal limiting layer in the early stages of this condition as proposed. Early disease tends to involve proliferation into the OPL, with further penetration of these vessels into the ONL with more moderate disease. These vascular changes occur concurrently with disruption of the various affected retinal layers and development of small intraretinal cysts and hyperreflective deposits, which are readily seen on Fd-OCT imaging.27 Although there is no histologic correlate for the microcystoid spaces and the hyperreflective deposits seen on Fd-OCT,28 they tend to be near abnormal retinal vascular signals and may represent formerly dilated vessels that have involuted or Müller-cell degeneration.8,31 Similar microcystic changes and patches of photoreceptor atrophy or disruption have been described using Fd-OCT in eyes with toxic maculopathy from tamoxifen in the absence of any retinal vasculature abnormality on FA,11 suggesting that they may result from direct damage to retinal cells rather than from retinal vascular abnormality.
With more advanced disease, focal perifoveal diffuse blurring of the retinal layers with disruption of the ELM and photoreceptor IS/OS junction become more apparent on Fd-OCT. Concurrent with these full-thickness changes on Fd-OCT is full-thickness retinal vascular proliferation extending perhaps from the subinternal limiting space to the subretinal space as proposed by Gass and Blodi2,3 (stage 4; Fig. 5). These changes are somewhat analogous to changes theorized with retinal angiomatous proliferation (RAP) lesions, a form of neovascular age-related macular degeneration.3,29,30 The major difference between the two is that retinal–choroidal anastomoses with progression to choroidal neovascularization is not commonly seen in MacTel patients as it is in patients with RAP, although disciform scarring can occur with both conditions. In addition, drugs that inhibit VEGF appear to have minimal short-term effect in eyes with MacTel unlike eyes with RAP.31,32
One major limitation of our study using this technology is that we have no histologic confirmation of our PD-OCT findings. Artificial flow signals can occur in both normal and MacTel eyes from shadow artifact and “non-zero phase differences.” These artifacts can be differentiated from true vascular signals in our study by following the vascular signal through serial B-scans and relying upon oblique retinal vessel orientation, which have no superficial artifact signal (see Fig. 3D).
Macular Pigment Optical Density
MPOD, consisting primarily of lutein and zeaxanthin, is concentrated in the Henle fiber layer of the fovea and is believed to serve several physiologic functions.33 MP peaks in the central 1° to 2° eccentricity and declines to negligible levels by approximately 5° to 10° eccentricity.22,34 Among the various methods to measure MP, the most widely used is HFP.17,22 This psychophysical method is inexpensive and reliable, but data collection is time-consuming, and variable results may be obtained among subjects with low MPOD or those with poor fixation.35,36 Thus, this study was only performed in eyes with BCVA of 20/40 or better in our case series.
The loss of foveal MP associated with MacTel has been described by several groups using various techniques including HFP.6,36,38 The largest recent report by Esposti et al.36 found an abnormal paracentral distribution of MP in a majority of MacTel eyes by autofluorescence but found a normal foveal peak MP in a few eyes at various stages of MacTel ranging from 1 to 4. The report included very few eyes with early-stage MacTel. In our small series, MPOD measurement was either decreased or normal but tended to be more normal in early stages of the disease. In more advanced disease, stages 3 and 4, a more diffuse loss of MPOD was evident (P < 0.05), similar to that described previously.6,38
Thus, loss of foveal MP does not appear to be a reliable marker of this condition in the early stages. While the exact pathogenesis of MacTel is still controversial, our results suggest that MP changes may occur later and possibly secondarily to other changes in the retinal vasculature or retinal neurons. In fact, abnormally low MP levels have been noted in eyes with diabetic retinopathy, and this finding is consistent with the hypothesis that abnormal MPOD in MacTel could be secondary to retinal vasculopathy.37 Our PD-OCT study shows that retinal vascular abnormalities near the fovea can be noted in early stages of the disease even when MPOD is relatively normal.
Based on FA findings, Gass initially suggested a primary role of the leaky retinal capillaries with subsequent chronic nutritional damage to Müller cells in eyes with MacTel.2 Later, Gass commented that this disorder is primarily an abnormality of the parafoveolar retinal neural or Müller cells.38 Defective trafficking of lutein and zeaxanthin, owing to dysfunctional RPE, neuronal, vascular, glial, or Müller cells leading to abnormal MP distribution, was implicated to lead to macular degenerative changes with retinal vascular alterations as a secondary phenomenon.6 This latter theory is not consistent with our findings of normal MPOD distribution in early-stage disease where subtle retinal vascular abnormalities can already be detected. Further research is warranted to determine if abnormal trafficking and storage of MP may be involved in the underlying pathophysiology of MacTel.
In summary, we utilized both PD-OCT and MPOD to better characterize various stages of MacTel. Our results showed that early retinal vascular changes can be detected using PD-OCT in eyes with early stages of this condition and normal MPOD. The earliest changes appeared to be penetration of superficial retinal capillaries into deeper retinal layers, leading eventually to retinal–retinal or retinal–subretinal anastomosis in advanced disease. Concurrent with these retinal vascular changes was patchy disruption and atrophy of the outer retinal layers, in particular the photoreceptor layer. Whether this condition is primarily a retinal vascular disease or retinal degenerative disease is unclear. Nonetheless, our MPOD studies suggest that loss of MP is unlikely to be the initial insult leading to the changes in the retinal vasculature and/or retinal neurons. The obvious limitation of this study was the small number. Future larger studies using PD-OCT and studies using newer retinal imaging modalities such as adaptive optics–OCT imaging39 may help improve our understanding of the pathogenesis of this condition such that an effective treatment can be developed.
Acknowledgments
The authors thank Susan M. Garcia of the Vision Science and Advanced Retinal Imaging Laboratory for her assistance with imaging and macular pigment optical density measurements.
Presented in part as a paper at the annual meeting of the Association for Research in Vision and Ophthalmology, Fort Lauderdale, Florida, May 2012, and at the 36th Annual Macula Society Meeting, Dana Point, California, February 27, 2013.
Supported in part by the National Eye Institute Grant 014743 (JSW); a Research to Prevent Blindness Unrestricted Departmental Grant; and the National Center for Advancing Translational Sciences (NIH) Grant UL1 TR0000002 (MW).
Disclosure: E.K. Chin, None; D.Y. Kim, None; A.A. Hunter III, None; S. Pilli, None; M. Wilson, None; R.J. Zawadzki, None; J.S. Werner, None; S.S. Park, None
References
- 1. Charbel Issa P, Holz FG, Scholl HPN Findings in fluorescein angiography and optical coherence tomography after intravitreal bevacizumab in type 2 idiopathic macular telangiectasia. Ophthalmology. 2007; 114: 1736–1742 [DOI] [PubMed] [Google Scholar]
- 2. Gass JD, Blodi BA. Idiopathic juxtafoveolar retinal telangiectasis. Update of classification and follow-up study. Ophthalmology. 1993; 100: 1536–1546 [PubMed] [Google Scholar]
- 3. Yannuzzi LA, Bardal AM, Freund KB, et al. Idiopathic macular telangiectasia. Arch Ophthalmol. 2006; 124; 450–460 [DOI] [PubMed] [Google Scholar]
- 4. Gass JD, Oyakawa RT. Idiopathic juxtafoveolar retinal telangiectasis. Arch Ophthalmol. 1982; 100: 769–780 [DOI] [PubMed] [Google Scholar]
- 5. Yannuzzi LA. The Retinal Atlas. Oxford, UK: Saunders Elsevier; 2010: 422–429 [Google Scholar]
- 6. Helb HM, Charbel Issa P, Van Der Veen RLP, et al. Abnormal macular pigment distribution in type 2 idiopathic macular telangiectasia. Retina. 2008; 28: 808–816 [DOI] [PubMed] [Google Scholar]
- 7. Cohen SM, Cohen ML, El-Jabali F, Pautler SE. Optical coherence tomography findings in nonproliferative group 2a idiopathic juxtafoveal retinal telangiectasis. Retina. 2007; 27: 59–66 [DOI] [PubMed] [Google Scholar]
- 8. Surguch V, Gamulescu MA, Gabel VP. Optical coherence tomography findings in idiopathic juxtafoveal retinal telangiectasis. Graefes Arch Clin Exp Ophthalmol. 2007; 245: 783–788 [DOI] [PubMed] [Google Scholar]
- 9. Gaudric A, Ducos de Lahitte G, Cohen SY, Massin P, Haouchine B. Optical coherence tomography in group 2A idiopathic juxtafoveolar retinal telangiectasis. Arch Ophthalmol. 2006; 124: 1410–1419 [DOI] [PubMed] [Google Scholar]
- 10. Paunescu LA, Ko TH, Duker JS, et al. Idiopathic juxtafoveal retinal telangiectasis: new findings by ultrahigh-resolution optical coherence tomography. Ophthalmology. 2006; 113: 48–57 [DOI] [PMC free article] [PubMed] [Google Scholar]
- 11. Park SS, Zawadzki RJ, Truong SN, Choi SS, Werner JS. Microcystoid maculopathy associated with tamoxifen use diagnosed by high-resolution Fourier-domain optical coherence tomography. Retin Cases Brief Rep. 2009; 3: 33–35 [DOI] [PMC free article] [PubMed] [Google Scholar]
- 12. Chen Z, Milner TE, Srinivas S, et al. Noninvasive imaging of in vivo blood flow velocity using optical Doppler tomography. Opt Lett. 1997; 22: 1119–1121 [DOI] [PubMed] [Google Scholar]
- 13. Hammond BR, Wooten BR, Snodderly DM. Individual variations in the spatial profile of human macular pigment. J Opt Soc Am A. 1997; 14: 1187–1196 [DOI] [PubMed] [Google Scholar]
- 14. Landrum JT, Bone RA, Joa H, et al. A one year study of the macular pigment: the effect of 140 days of a lutein supplement. Exp Eye Res. 1997; 65: 57–62 [DOI] [PubMed] [Google Scholar]
- 15. Werner JS, Bieber ML, Schefrin BE. Senescence of foveal and parafoveal cone sensitivities and their relations to macular pigment density. J Opt Soc Am A. 2000; 17: 1918–1932 [DOI] [PMC free article] [PubMed] [Google Scholar]
- 16. Charbel Issa P, van der Veen RLP, Stijfs A, et al. Quantification of reduced macular pigment optical density in the central retina in macular telangiectasia type 2. Exp Eye Res. 2009; 89: 25–31 [DOI] [PubMed] [Google Scholar]
- 17. Wooten BR, Hammond BR Jr, Land RI, Snodderly DM. A practical method for measuring macular pigment optical density. Invest Ophthalmol Vis Sci. 1999; 40: 2481–2489 [PubMed] [Google Scholar]
- 18. Kim DY, Fingler J, Werner JS, et al. In vivo volumetric imaging of human retinal circulation with phase-variance optical coherence tomography. Biomed Opt Express. 2011; 2: 1504–1513 [DOI] [PMC free article] [PubMed] [Google Scholar]
- 19. Fingler J, Zawadzki RJ, Werner JS, et al. Volumetric microvascular imaging of human retina using optical coherence tomography with a novel motion contrast technique. Opt Express. 2009; 17: 22190–22200 [DOI] [PMC free article] [PubMed] [Google Scholar]
- 20. Makita S, Hong Y, Yamanari M, et al. Optical coherence angiography. Opt Express. 2006; 14: 7821–7840 [DOI] [PubMed] [Google Scholar]
- 21. Werner JS, Wooten BR. Opponent chromatic response functions for an average observer. Percept Psychophys. 1979; 25: 371–374 [DOI] [PubMed] [Google Scholar]
- 22. Werner JS, Donnelly SK, Kliegl R. Aging and human macular pigment density. Appended with translations from the work of Max Schultze and Ewald Hering. Vision Res. 1987; 27: 257–268 [DOI] [PubMed] [Google Scholar]
- 23. Landrum JT, Bone RA. Lutein, zeaxanthin, and the macular pigment. Arch Biochem Biophys. 2001; 385: 28–40 [DOI] [PubMed] [Google Scholar]
- 24. Fruttiger M. Development of the retinal vasculature. Angiogenesis. 2007; 10: 77–88 [DOI] [PubMed] [Google Scholar]
- 25. Provis JM. Development of the primate retinal vasculature. Prog Retin Eye Res. 2001; 20: 799–821 [DOI] [PubMed] [Google Scholar]
- 26. Kim DY, Fingler J, Zawadzki RJ, et al. Noninvasive imaging of the foveal avascular zone with high-speed, phase-variance optical coherence tomography. Invest Ophthalmol Vis Sci. 2012; 53: 85–92 [DOI] [PMC free article] [PubMed] [Google Scholar]
- 27. Moisseiev J, Lewis H, Batov E, et al. Superficial retinal refractile deposits in juxtafoveal telangiectasis. Am J Ophthalmol. 1990; 109: 604–60 5 [DOI] [PubMed] [Google Scholar]
- 28. Schmitz-Valckenberg S, Fan K, Nugent A, et al. Correlation of functional impairment and morphological alterations in patients with group 2A idiopathic juxtafoveal retinal telangiectasia. Arch Ophthalmol. 2008; 126: 330–335 [DOI] [PubMed] [Google Scholar]
- 29. Heckenlively JR, Hawes NL, Friedlander M, et al. Mouse model of subretinal neovascularization with choroidal anastomosis. Retina. 2003; 23: 518–523 [DOI] [PubMed] [Google Scholar]
- 30. Yannuzzi LA, Negrao S, Iida T, et al. Retinal angiomatous proliferation in age-related macular degeneration. Retina. 2001; 21: 416–434 [DOI] [PubMed] [Google Scholar]
- 31. Kovach JL, Rosenfeld PJ. Bevacizumab (Avastin) therapy for idiopathic macular telangiectasia type II. Retina. 2009; 29: 27–32 [DOI] [PubMed] [Google Scholar]
- 32. Truong SN, Alam S, Zawadzki RJ, et al. High resolution Fourier-domain optical coherence tomography of retinal angiomatous proliferation. Retina. 2007; 27: 915–925 [DOI] [PMC free article] [PubMed] [Google Scholar]
- 33. Whitehead AJ, Mares JA, Danis RP. Macular pigment: a review of current knowledge. Arch Ophthalmol. 2006; 124: 1038–1045 [DOI] [PubMed] [Google Scholar]
- 34. Bone RA, Landrum JT, Friedes LM, et al. Distribution of lutein and zeaxanthin stereoisomers in the human retina. Exp Eye Res. 1997; 64: 211–218 [DOI] [PubMed] [Google Scholar]
- 35. Snodderly DM, Hammond BR. In-vivo psychophysical assessment of nutritional and environmental influences on human and ocular tissues: lens and macular pigment. In: Taylor A. ed Nutritional and Environmental Influences on the Eye. Boca Raton, FL: CRC Press; 1999: 252–273 [Google Scholar]
- 36. Esposti SD, Egan C, Bunce C, et al. Macular pigment parameters in patients with macular telangiectasia (MacTel) and normal subjects: implications of a novel analysis. Invest Ophthalmol Vis Sci. 2012; 53: 6568–6575 [DOI] [PubMed] [Google Scholar]
- 37. Lima VC, Rosen RB, Maia M, et al. Macular pigment optical density measured by dual-wavelength autofluorescence imaging in diabetic and nondiabetic patients: a comparative study. Invest Ophthalmol Vis Sci. 2010; 51: 5840–5845 [DOI] [PubMed] [Google Scholar]
- 38. Gass JDM. Histopathologic study of presumed parafoveal telangiectasis. Retina. 2000; 20: 226–227 [DOI] [PubMed] [Google Scholar]
- 39. Zawadzki RJ, Cense B, Zhang Y, et al. Ultrahigh-resolution optical coherence tomography with monochromatic and chromatic aberration correction. Opt Express. 2008; 16: 8126–8143 [DOI] [PMC free article] [PubMed] [Google Scholar]