

Abstract
Central administration of glucagon-like peptide-1 (GLP-1) causes a dose-dependent reduction in food intake, but the role of endogenous CNS GLP-1 in the regulation of energy balance remains unclear. Here, we tested the hypothesis that CNS GLP-1 activity is required for normal energy balance by using two independent methods to achieve chronic CNS GLP-1 loss of function in rats. Specifically, lentiviral-mediated expression of RNA interference was used to knock down nucleus of the solitary tract (NTS) preproglucagon (PPG), and chronic intracerebroventricular (ICV) infusion of the GLP-1 receptor (GLP-1r) antagonist exendin (9-39) (Ex9) was used to block CNS GLP-1r. NTS PPG knockdown caused hyperphagia and exacerbated high-fat diet (HFD)-induced fat accumulation and glucose intolerance. Moreover, in control virus-treated rats fed the HFD, NTS PPG expression levels correlated positively with fat mass. Chronic ICV Ex9 also caused hyperphagia; however, increased fat accumulation and glucose intolerance occurred regardless of diet. Collectively, these data provide the strongest evidence to date that CNS GLP-1 plays a physiologic role in the long-term regulation of energy balance. Moreover, they suggest that this role is distinct from that of circulating GLP-1 as a short-term satiation signal. Therefore, it may be possible to tailor GLP-1-based therapies for the prevention and/or treatment of obesity.
Introduction
The regulation of energy balance requires bidirectional communication between peripheral tissues and the CNS, an essential component of which is the gut-brain axis. During eating, hormonal, neural and nutritional signals from the gastrointestinal tract inform the CNS of nutrient availability, leading to activation of compensatory pathways that facilitate appropriate nutrient disposal and maintenance of energy balance (Berthoud, 2008). Of these signals, the preproglucagon (PPG)-derived peptide glucagon-like peptide-1 (GLP-1) lies at both ends of the gut-brain axis, being produced in intestinal L-cells (Varndell et al., 1985) as well as the nucleus of the solitary tract (NTS) (Merchenthaler et al., 1999). Moreover, GLP-1 is a physiologic regulator of numerous processes, including glucose homeostasis and food intake (Baggio and Drucker, 2007).
GLP-1 is released from intestinal L-cells after meals, and recent evidence suggests that, similar to the gut hormone cholecystokinin (CCK), GLP-1 acts as a short-term satiation signal, limiting meal size and prolonging intermeal interval (Williams et al., 2009). In contrast, numerous studies support a role for CNS GLP-1 in long-term energy balance regulation. GLP-1 receptors (GLP-1rs) are expressed in hypothalamic nuclei known to regulate energy balance (Merchenthaler et al., 1999), and hindbrain PPG neurons project to these areas (Vrang et al., 2007). Central administration of GLP-1 reduces food intake and body weight, whereas GLP-1r antagonists do the opposite (Meeran et al., 1999). Leptin activates NTS PPG neurons and increases hypothalamic GLP-1 content in food-restricted mice and rats (Elias et al., 2000; Goldstone et al., 2000). Finally, hindbrain PPG mRNA is elevated in obese Zucker rats, suggesting that CNS GLP-1 activity may be altered in obesity or states of leptin resistance (Vrang et al., 2008).
Although a strong case can be made for the involvement of CNS GLP-1 in the long-term regulation of energy balance, other reports challenge this hypothesis. NTS PPG neurons are activated by noxious stimuli but not a large meal (Rinaman, 1999a). Moreover, central administration of GLP-1 induces visceral illness and activates the HPA axis (Seeley et al., 2000; Kinzig et al., 2003), suggesting that CNS GLP-1 mediates illness- or stress-induced anorexia rather than regulation of energy balance per se. Finally, GLP-1r knock-out mice have normal food intake and body weight, raising further questions about a primary role for CNS GLP-1 in the regulation of energy balance (Scrocchi et al., 1996; Scrocchi and Drucker, 1998).
At present, the data regarding a physiologic role for CNS GLP-1 in long-term energy balance regulation are equivocal, due in part to experimental limitations. GLP-1r knock-out mice are subject to developmental compensations and lack CNS specificity for loss of function. Moreover, the use of chronic CNS GLP-1r blockade (Knauf et al., 2008) assumes that CNS GLP-1rs are activated solely by NTS GLP-1 and not by intestinal GLP-1. Here we address these limitations by comparing RNA interference(RNAi)-mediated knockdown of NTS PPG and chronic CNS GLP-1r blockade to test the hypothesis that CNS GLP-1 signaling is required for normal energy balance. Furthermore, we assess the effects of these two treatments under conditions of diet-induced obesity.
Materials and Methods
Animals
Adult male Long–Evans rats (Harlan) were housed individually in plastic shoebox cages and maintained on a 12 h light/dark cycle with ad libitum access to food and water. Rats were fed either a low-fat pelleted chow (chow: 3.41 kcal/g, ∼5% fat by kcal, Harlan Teklad) or a pelleted high-fat diet (HFD: 4.54 kcal/g, 40% butter fat by kcal, Research Diets, Inc.). All animal procedures were approved by the University of Cincinnati Institutional Animal Care and Use Committee.
Body composition
Fat mass and lean mass were measured in conscious rats using a nuclear magnetic resonance whole-body composition analyzer (Echo Medical Systems).
Conditioned taste aversion
Conditioned taste aversion (CTA) to intraperitoneal 0.15 m lithium chloride (LiCl), administered at a volume in milliliters equivalent to 1% of the rat's body weight in grams, was assessed as previously described (Cota et al., 2006).
Meal patterns, energy expenditure, and locomotor activity
Rats from each group were placed in a continuous monitoring system (TSE Systems) for 72 h to assess meal patterns, energy expenditure and locomotor activity. The first 24 h were considered adaptation and the data from the next 48 h were analyzed. Data for indirect calorimetry analysis were sampled every 45 min. Data for food intake and meal pattern analysis were sampled every 15 min and accumulated in 6 h blocks.
Glucose tolerance
Intraperitoneal glucose tolerance tests were performed to isolate the effects of the CNS GLP-1 system and to avoid stimulation of GLP-1 release from the gastrointestinal tract. Briefly, overnight-fasted rats were injected intraperitoneally with 25% dextrose at a dose of 1.5 g/kg. Blood samples taken at 0, 15, 30, 45, 60, and 120 min were assessed for glucose using glucometers and glucose strips (Accu-Chek).
NTS PPG knockdown studies
Lentiviral vectors.
Low-titer (>1.0 × 10⁶ IU/ml) and high-titer (>1.0 × 10⁹ IU/ml) lentiviral vectors dissolved in PBS were obtained from America Pharma Source. These viral vectors expressed either a scrambled (control) short-hairpin RNA (shRNA) or a shRNA directed against rat and mouse PPG under the control of the human U6 promoter, in addition to an independent enhanced green fluorescent protein (GFP) cassette for detection of transduced neurons. The PPG shRNA oligonucleotide sequences were as follows: 5′-GATCCAGCATGCTGAAGGGACCTTTACTTCAAGAGAGTAAAGGTCCCTTCAGCATGCTTTTTGG-3′ and 5′-AATTCCAAAAAGCATGCTGAAGGGACCTTTACTCTCTTGAAGTAAAGGTCCCTTCAGCATGCTG-3′. PPG-specific nucleotides are represented in boldfaced type.
Tissue culture studies.
Rat pancreatic islet INS-1 cells were maintained in culture media consisting of RPMI 1640 supplemented with 10% heat-inactivated FBS, 50 μm β-mercaptoethanol, 100 U/ml penicillin and 100 μg/ml streptomycin and grown in a 37°C incubator in an atmosphere of 5% CO2 and 95% air and 100% humidity. On day 1, cells were seeded in 24-well plates at a density such that they would be 40–50% confluent the following day. On day 2, culture media was replaced by 200 μl of low-titer virus stock per well, and cells were incubated overnight. On day 3, virus stock was replaced with fresh culture media for an additional 48 h, at which time cells were harvested and stored at −80°C for RNA isolation.
Quantitative reverse transcriptase-PCR.
Total RNA was isolated using TriReagent according to the manufacturer's instructions. Complementary DNA (cDNA) was reverse-transcribed from 1.0 μg of total RNA using the iScript cDNA synthesis kit (Bio-Rad) and amplified using an iCycler (Bio-Rad) and the iQ SYBR Green Supermix (Bio-Rad). Primer sequences were as follows: L32 forward, 5′-CAG ACG CAC CAT CGA AGT TA-3′; reverse, 5′-AGC CAC AAA GGA CGT GTT TC-3′ at 61.2°C; PPG forward, 5′-GGT TGA TGA ACA CCA AGA GGA-3′; reverse, 5′-CCT GGC CCT CCA AGT AAG A-3′ at 55°C (Integrated DNA Technologies). Primers were optimized as previously described (Kim et al., 2008), and all samples were run in triplicate. PPG expression was normalized to that of the constitutively expressed ribosomal protein L32, and relative expression was quantified as previously described (Kim et al., 2008).
Viral delivery.
Rats were anesthetized with ketamine/xylazine and placed into a stereotaxic frame (David Kopf Instruments). To target the NTS, a 26-gauge bilateral guide cannula (Plastics One) was slowly lowered and allowed to rest for 5 min at the following coordinates: anteroposterior (AP), −5.3 mm from the interaural line; mediolateral (ML), ±0.6 mm; and dorsoventral (DV), −7.4 mm from skull (Paxinos and Watson, 1998). Using a micro-infusion pump (Harvard Apparatus), high-titer lentiviral vectors were infused via Hamilton syringes attached to a 30-gauge bilateral internal cannula (Plastics One) projecting 1.0 mm below the tip of the guide cannula. For each rat, 2.0 μl of virus stock was infused on each side over 20 min, and 5 min later, the guide and internal cannulas were slowly removed and the skin sutured.
Experiment 1.
Before surgery, body composition was measured, and chow-fed rats were divided into two groups (control or PPG, n = 11 per group) matched for body weight, fat mass and lean mass. Following viral delivery, body weight and food intake were measured daily for 12 d. On the day of death, rats were deeply anesthetized with sodium pentobarbital and perfused transcardially with DEPC-treated 0.1 m PBS (DEPC PBS) followed by 4.0% paraformaldehyde/PBS. Brains were postfixed at 4°C for 24 h in 4.0% paraformaldehyde/PBS and stored at 4°C in 30.0% sucrose/DEPC PBS. Serial coronal forebrain and hindbrain sections were collected at 25 μm using a freezing microtome and stored at −20°C in DEPC-treated cryoprotectant.
Experiment 2.
Before surgery, body composition was measured, and chow-fed rats were divided into two groups (control or PPG, n = 20 per group) matched for body weight, fat mass and lean mass. Following viral delivery, body weight and food intake were measured daily for 2 weeks and weekly thereafter. CTA was performed at 3 weeks, body composition was reassessed at 5 weeks, and at 6 weeks, rats were killed and their brains processed for histology as described in experiment 1.
Experiment 3.
Before surgery, body composition was measured, and chow-fed rats were divided into two groups (control or PPG, n = 20 per group) matched for body weight, fat mass and lean mass. Following viral delivery, body weight and food intake were measured daily for 2 weeks and weekly thereafter. Rats were maintained on chow for 6 weeks followed by HFD for 4 weeks. While on chow, body composition was measured at 2 and 6 weeks, cumulative food intake over 24 h was measured at 3 weeks, and glucose tolerance was assessed at 5 weeks. At 7 weeks, rats were switched to HFD and placed in the TSE continuous metabolic monitoring system for 72 h. At 9 weeks, glucose tolerance was assessed, and at 10 weeks body composition was measured and rats killed by CO2 asphyxiation. At death, whole brains were harvested, and the caudal medulla was dissected, flash-frozen in isopentane on dry ice and stored at −80°C. To determine the relationship between hindbrain PPG expression and fat mass, tissue from control rats was processed for quantitative PCR as described above.
PPG in situ hybridization.
In situ hybridization and quantification of NTS PPG expression were performed on hindbrain sections as previously described (Choi et al., 2007) using a previously characterized antisense rat PPG riboprobe (Zhang et al., 2009).
GFP immunofluorescence.
After washing with PBS, free-floating hindbrain sections were incubated at room temperature (RT) in 0.3% glycine/PBS for 20 min followed by 0.03% SDS/PBS for 10 min. Sections were blocked for 2 h at RT in 3.0% normal donkey serum/0.25% Triton X-100/PBS and incubated overnight at RT in blocking solution containing chicken anti-GFP (1:1000, Abcam). The next morning, sections were incubated for 2 h at RT in blocking solution containing biotinylated donkey anti-chicken IgG (1:1000, Jackson ImmunoResearch) followed by 2 h at RT in blocking solution containing Alexa Fluor 488-conjugated streptavidin (1:200, Invitrogen). Finally, sections were washed with PBS, mounted on gelatin-coated slides, and thoroughly washed with PBS.
GLP-1 immunofluorescence.
GLP-1 immunofluorescence and quantification of paraventricular hypothalamic nucleus (PVN) GLP-1 fiber density were performed on hypothalamic sections as previously described (Zhang et al., 2009) using a primary antibody directed against enteroglucagon C-terminal octapeptide (Collie et al., 1994), obtained from David A. D'Alessio (University of Cincinnati, Cincinnati, OH).
Chronic intracerebroventricular exendin (9-39) studies
Intracerebroventricular minipump implantation.
Under ketamine/xylazine anesthesia, rats were implanted with lateral ventricular cannulas connected via PVC tubing to osmotic pumps (Alzet) that delivered either saline or the GLP-1r antagonist exendin (9-39) (Ex9) (100 μg/d, 21st Century Biochemicals). Pump duration was 6 weeks (model 2006) for experiment 1 and 4 weeks (model 2004) for experiment 2. Before surgery, pumps were filled with either Ex9 or saline vehicle, connected to a lateral ventricular cannula with 5 cm of solution-filled tubing and primed at 37°C for 48 h. The cannula tip was placed at the following coordinates: AP, −0.85 mm from bregma; ML, ±1.5 mm; DV, −3.5 mm from skull (Paxinos and Watson, 1998). The osmotic pump was then placed interscapularly, the cannula was secured to the skull with anchor screws and dental acrylic, and the skin was sutured.
Experiment 1.
Rats were fed chow or HFD for 4 weeks. Before surgery, body composition was measured, and within each diet group, rats were partitioned into two groups (chow–saline, chow–Ex9, HFD–saline, HFD–Ex9, n = 10 per group) matched for body weight, fat mass and lean mass. Body weight and food intake were measured daily for 1 week postsurgery and weekly thereafter. Glucose tolerance was assessed at 4 weeks postsurgery. To account for large differences in fat mass between groups at the time of testing, glucose was administered intraperitoneally at a fixed dose of 0.75 g. At 5 weeks, body composition was reassessed, and rats were killed via CO2 asphyxiation. Whole brains were harvested, flash-frozen in isopentane on dry ice and stored at −80°C. Trunk blood was collected and plasma harvested and stored at −80°C.
Experiment 2.
Before surgery, body composition was measured, and chow-fed rats were divided into four groups (saline, Ex9–AL, Ex9–PF, and Ex9–SC, n = 10 per group) matched for body weight, fat mass and lean mass. Rats in the saline and Ex9–AL groups were fed ad libitum, and Ex9–PF rats were pair-fed to match the intake of the saline rats. An additional group of rats receiving the same dose of Ex9 given subcutaneously (Ex9–SC) was included to rule out the possibility of intracerebroventricular (ICV) Ex9 blocking peripheral GLP-1R. Body weight and food intake were measured daily for 1 week postsurgery and weekly thereafter. Body composition and glucose tolerance were measured at 4 weeks, and 2 d later rats were killed as described above.
Statistical analysis
All values are reported as Mean ± SEM. Data were analyzed using Student's t test, one- or two-way ANOVA or two- or three-way repeated-measures ANOVA. Post hoc multiple comparisons were made using Tukey's post hoc test. Significance was set at p < 0.05 for all analyses.
Results
RNAi against PPG significantly decreases PPG expression in vitro and in vivo
To validate the efficacy of our PPG shRNA-expressing lentivirus, we first assessed the ability of the virus to knock down PPG expression in the rat pancreatic islet cell line INS-1, which has been reported to express PPG (Bollheimer et al., 2005). At 48 h, PPG mRNA was significantly decreased (92%) in PPG- versus control-infected cells, indicating successful knockdown (Fig. 1A, p = 0.0019). Next, we assessed the ability of the virus to knock down PPG expression in rat brain. Figure 1B depicts GFP immunofluorescence in the caudal NTS 12 d postinfection, and a schematic of this area is depicted in Figure 1C. PPG rats expressed significantly (47%) less PPG mRNA than control rats in the NTS (Fig. 1A, p < 0.0001), whereas no reduction was observed in the ventrolateral medulla (Fig. 1A). Representative images of control versus PPG rats are depicted in Figure 1, D and E, respectively. PPG rats also exhibited significantly less GLP-1 fiber density than control rats in the PVN (Fig. 1A, p = 0.0373), indicating effective knockdown at the protein level. Representative images of control versus PPG rats are depicted in Figure 1, F and G, respectively. Together, these data indicate that the PPG shRNA-expressing lentivirus effectively knocks down PPG expression in vitro and in vivo. Moreover, they confirm that our stereotactic targeting was specific for the NTS.
Figure 1.
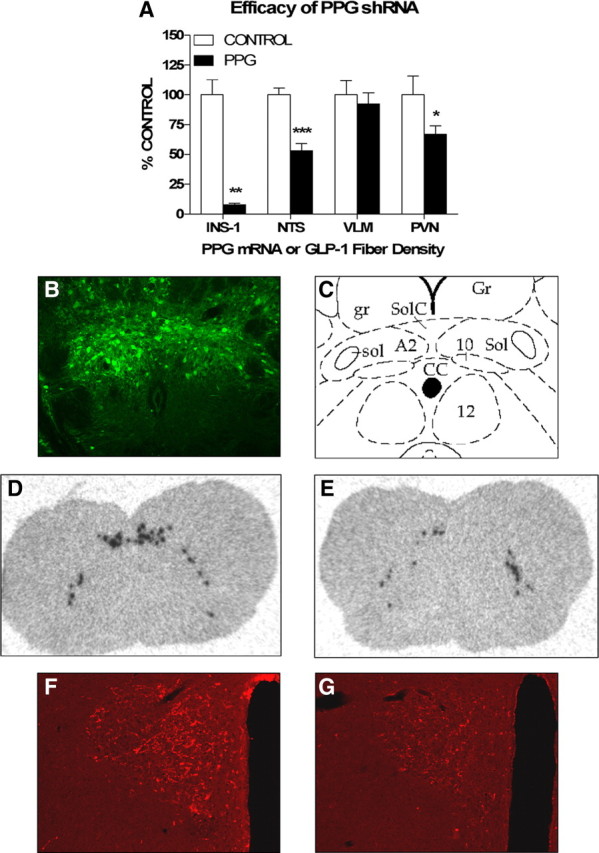
RNAi against PPG significantly decreases PPG expression in vitro and in vivo. A, Quantification of PPG mRNA and GLP-1 fiber density after infection with a lentivirus encoding a scrambled (control) or PPG-specific (PPG) shRNA. PPG mRNA levels in INS-1 cells (INS-1) were measured by quantitative reverse transcriptase-PCR 48 h after infection. PPG mRNA levels in rat NTS and ventrolateral medulla (VLM) were measured by in situ hybridization, and GLP-1 fiber density in rat PVN was measured by immunofluorescence 12 d after intra-NTS lentivirus infusion. B, Representative image of GFP immunoreactivity 12 d after intra-NTS lentivirus infusion. C, Schematic depicting the area shown in B (Paxinos and Watson, 1998). Gr, Gracile nucleus; gr, gracile fasciculus; SolC, commissural nucleus of the solitary tract; Sol, nucleus of the solitary tract; sol, solitary tract; A2, A2 noradrenergic cells; 10, dorsal motor nucleus of the vagus; CC, central canal; 12, hypoglossal nucleus. D–G, Representative images of NTS and VLM PPG mRNA (D, E) and PVN GLP-1 fiber density (F, G) 12 d after intra-NTS infusion of control (D, F) or PPG (E, G) lentivirus. Data are represented as mean ± SEM (n = 11 rats per group). *p < 0.05, **p < 0.01, ***p < 0.001 vs control.
NTS PPG knockdown leads to increased food intake and body weight and selective changes in body composition
Control and PPG rats did not differ significantly in body weight (343.09 ± 3.15 g vs 345.19 ± 2.41 g), fat mass (24.22 ± 0.77 g vs 24.14 ± 0.79 g) or lean mass (230.51 ± 3.44 g vs 227.24 ± 3.27 g) at the outset of the study. During week 1 following viral infection, control and PPG rats exhibited comparable anorexia and weight loss. However, during week 2 the groups diverged such that by 9 d PPG rats weighed significantly more than control rats (Fig. 2A, p = 0.032) and by 8 d they were significantly hyperphagic (Fig. 2B, p = 0.024). These differences persisted throughout the experiment (Figs. 2C,D, p = 0.001 and 0.045, respectively, at 6 weeks) and were associated with significant preservation of fat (Fig. 2E, p < 0.001) and lean (Fig. 2F, p = 0.003) mass at 2 weeks. However, beyond 2 weeks the differences in body weight and food intake remained constant, and no significant differences in the amount of fat or lean mass gained were observed thereafter.
Figure 2.

NTS PPG knockdown results in hyperphagia and increased body weight in chow-fed rats. A, B, Cumulative body weight change (A) and daily food intake (B) during the first 2 weeks of the study. C, D, Cumulative body weight change (C) and average daily food intake (D) for the 6-week duration of the study. E, F, Changes in fat mass (E) and lean mass (F) over time. Data are represented as mean ± SEM (n = 20 rats per group). *p < 0.05, **p < 0.01, ***p < 0.001 vs control.
Because NTS PPG neurons are activated by stimuli associated with visceral illness (Rinaman, 1999a), and because CNS GLP-1r antagonism blocks the response to toxins that cause visceral illness (Rinaman, 1999b; Seeley et al., 2000), we assessed the ability of control versus PPG rats to form a CTA to intraperitoneal LiCl. Surprisingly, both groups exhibited preference ratios for 0.1% saccharin significantly <0.5 (0.17 and 0.14, respectively), indicating that there was no significant difference in their ability to form a CTA to intraperitoneal LiCl (data not shown).
Consistent with our first experiment, at 6 weeks postinfection, PPG rats expressed significantly (53%) less PPG mRNA than control rats in the NTS (p = 0.0004, data not shown). These data indicate that the knockdown of PPG expression induced by the PPG shRNA-expressing lentivirus is persistent.
NTS PPG knockdown exacerbates HFD-induced obesity and glucose intolerance
Previous studies have reported that hindbrain PPG expression is significantly increased in obese Zucker rats and HFD-fed mice (Knauf et al., 2008; Vrang et al., 2008). In addition, HFD-fed mice given twice-daily injections of the GLP-1r agonist exendin-4 were relatively protected against HFD-induced fat accumulation (Lamont and Drucker, 2008). Based on these observations, we predicted that NTS PPG knockdown would enhance fat accumulation in response to high-fat feeding. To this end, we infected rats and maintained them on chow for 6 weeks followed by HFD for 4 weeks and assessed changes in body weight, body composition and food intake.
Control and PPG rats did not differ significantly with respect to body weight (372.21 ± 3.34 g vs 373.22 ± 3.60 g), fat mass (28.25 ± 1.16 g vs 27.68 ± 1.46 g) or lean mass (313.45 ± 2.72 g vs 313.28 ± 2.37 g) at the outset of the study. Consistent with the above results, PPG rats were significantly heavier (∼25 g) than control rats at 2 weeks postinfection (Fig. 3A, p = 0.006), and this difference remained constant while the animals were maintained on chow. After 4 weeks of high-fat feeding, the weight difference between PPG and control rats had increased to ∼40 g (p < 0.001). Body composition analysis revealed that at 2 weeks PPG rats had significantly more lean mass (Fig. 3F, p < 0.001) and a trend toward more fat mass than control rats, and from 2 to 6 weeks there were parallel changes in both lean and fat mass between the two groups. After 4 weeks of high-fat feeding, PPG rats had gained significantly more fat mass (Fig. 3E, p < 0.001) than control rats, whereas changes in lean mass between the two groups were not significantly different. Finally, PPG rats were significantly hyperphagic relative to control rats throughout the entire study (Fig. 3B, p < 0.001).
Figure 3.
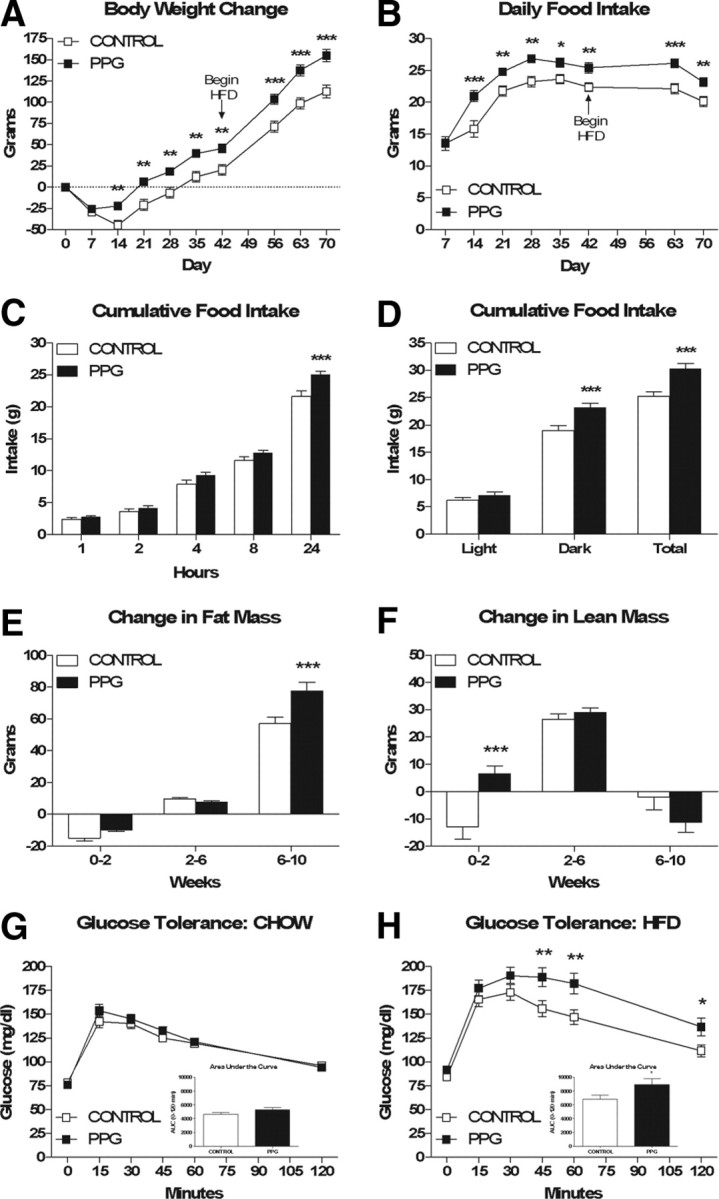
NTS PPG knockdown results in exacerbation of HFD-induced obesity and glucose intolerance. A, B, Cumulative body weight change (A) and average daily food intake (B). C, Cumulative food intake at various time points across a 24 h period, measured during week 3 of the study. D, Average light phase, dark phase and 24 h food intake during a 48 h measurement period while housed in the TSE continuous metabolic monitoring system during week 7 of the study. E, F, Changes in fat mass (E) and lean mass (F) over time. G, H, intraperitoneal glucose tolerance while maintained on chow (G) and HFD (H). Data are represented as mean ± SEM (n = 20 rats per group). *p < 0.05, **p < 0.01, ***p < 0.001 vs control.
Because recent evidence suggests that the CNS GLP-1 system plays a direct role in the regulation of peripheral glucose homeostasis (Knauf et al., 2005, 2008; Sandoval et al., 2008), we assessed intraperitoneal glucose tolerance under chow-fed and HFD-fed conditions. There was no significant difference in glucose tolerance between PPG and control rats while maintained on chow (Fig. 3G); however, after 4 weeks of high-fat feeding, PPG rats were glucose intolerant relative to control rats. Specifically, PPG rats had significantly higher blood glucose levels than control rats at 45, 60 and 120 min, and the area under the curve over baseline was significantly increased in PPG versus control rats (Fig. 3H, p = 0.0356).
Hyperphagia following NTS PPG knockdown is the result of an accumulation of slight overeating that occurs throughout the dark phase
Consistent with its putative role as a satiation signal, recent studies using the GLP-1r agonist exendin-4 (Ex4) suggest that peripheral GLP-1 reduces food intake by decreasing meal size and duration and increasing intermeal interval (Scott and Moran, 2007; Williams et al., 2009). Because the effect of CNS GLP-1 on satiation is poorly understood, we compared control versus PPG rats with respect to cumulative food intake at various time points across a 24 h period as well as meal patterns across a 48 h period. PPG rats ate significantly more than control rats within a 24 h period (Fig. 3C, p < 0.001), but this difference was not apparent at 1, 2, 4 and 8 h into the dark phase. However, hyperphagia induced by NTS PPG knockdown was largely the result of increased dark phase food intake (Fig. 3D, p = 0.0007). PPG rats exhibited a significantly higher rate of consumption than control rats (0.36 ± 0.002 vs 0.30 ± 0.001 g/min, p = 0.0260, data not shown), yet there were no significant differences between PPG vs control rats with respect to meal size (2.006 ± 0.13 vs 1.802 ± 0.13 g, data not shown), duration (329.9 ± 18.44 vs 353.8 ± 20.20 s, data not shown) or number (32.65 ± 2.26 vs 30.21 ± 1.90, data not shown).
NTS PPG knockdown does not alter energy expenditure, respiratory quotient, or locomotor activity
Whereas central GLP-1's effect on food intake is well established, its effect on energy expenditure remains unclear. Increased energy expenditure and locomotor activity were observed in both GLP-1r knock-out mice (Hansotia et al., 2007) as well as WT HFD-fed mice receiving chronic ICV Ex9 (Knauf et al., 2008), suggesting that endogenous CNS GLP-1 exerts a tonic inhibitory effect on these parameters. However, more recent data propose that CNS GLP-1 may limit fat accumulation by increasing sympathetic outflow to white adipose tissue (Nogueiras et al., 2009). Because PPG rats grew at a rate parallel to that of control rats beyond 2 weeks despite ongoing hyperphagia, we hypothesized that this phenomenon was secondary to a compensatory increase in energy expenditure and/or locomotor activity. Contrary to this hypothesis, PPG and control rats did not differ significantly with respect to energy expenditure, respiratory quotient, or locomotor activity (Fig. 4A,B,C, respectively).
Figure 4.
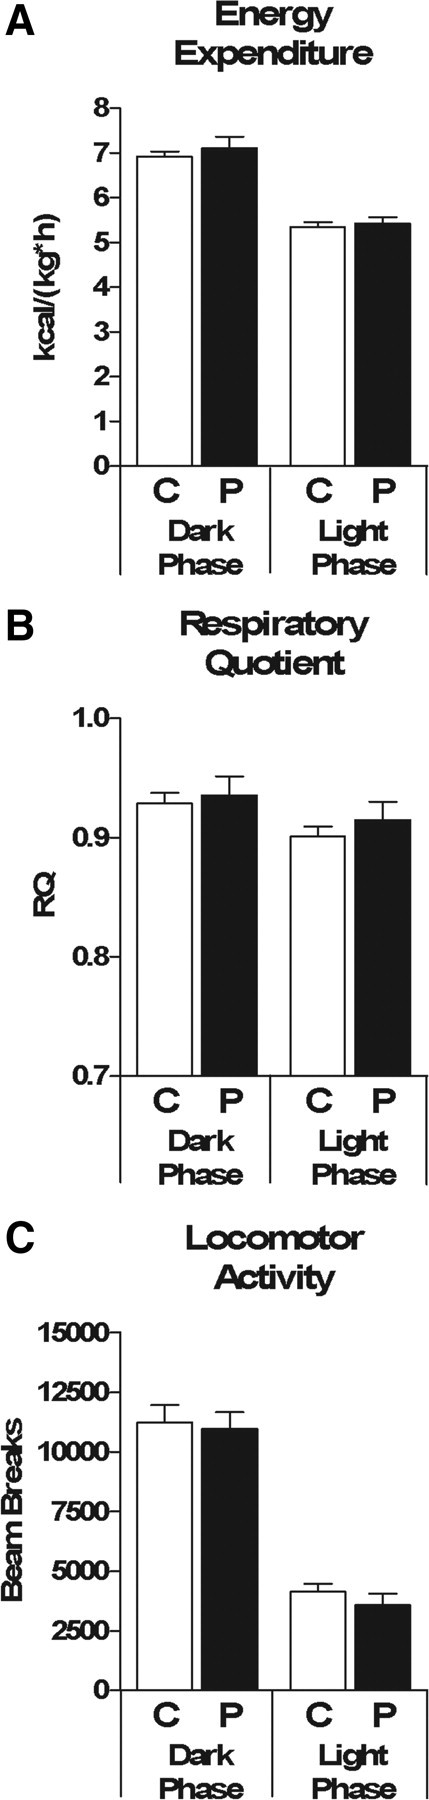
NTS PPG knockdown does not alter energy expenditure, respiratory quotient or locomotor activity. A–C, Average dark phase and light phase energy expenditure (A), respiratory quotient (B) and total locomotor activity (C) during a 48 h measurement period while housed in the TSE continuous metabolic monitoring system during week 7 of the study. Data are represented as mean ± SEM (n = 20 rats per group).
Hindbrain PPG expression correlates positively with fat mass in HFD-fed rats
The above data, combined with previous observations associating increased hindbrain PPG expression with obesity and high-fat feeding (Knauf et al., 2008; Vrang et al., 2008), suggest that the activity of the CNS GLP-1 system may covary with energy balance. To better understand this putative relationship, we correlated hindbrain PPG mRNA with terminal body weight and body composition parameters in the above control shRNA-infected rats. There was a significant positive correlation between PPG mRNA and body weight (Fig. 5A, r = 0.5384, p = 0.0174). Upon closer examination, PPG mRNA correlated even more strongly with fat mass (Fig. 5B, r = 0.7207, p = 0.0005), whereas there was no significant correlation with lean mass (Fig. 5C, r = −0.009578).
Figure 5.
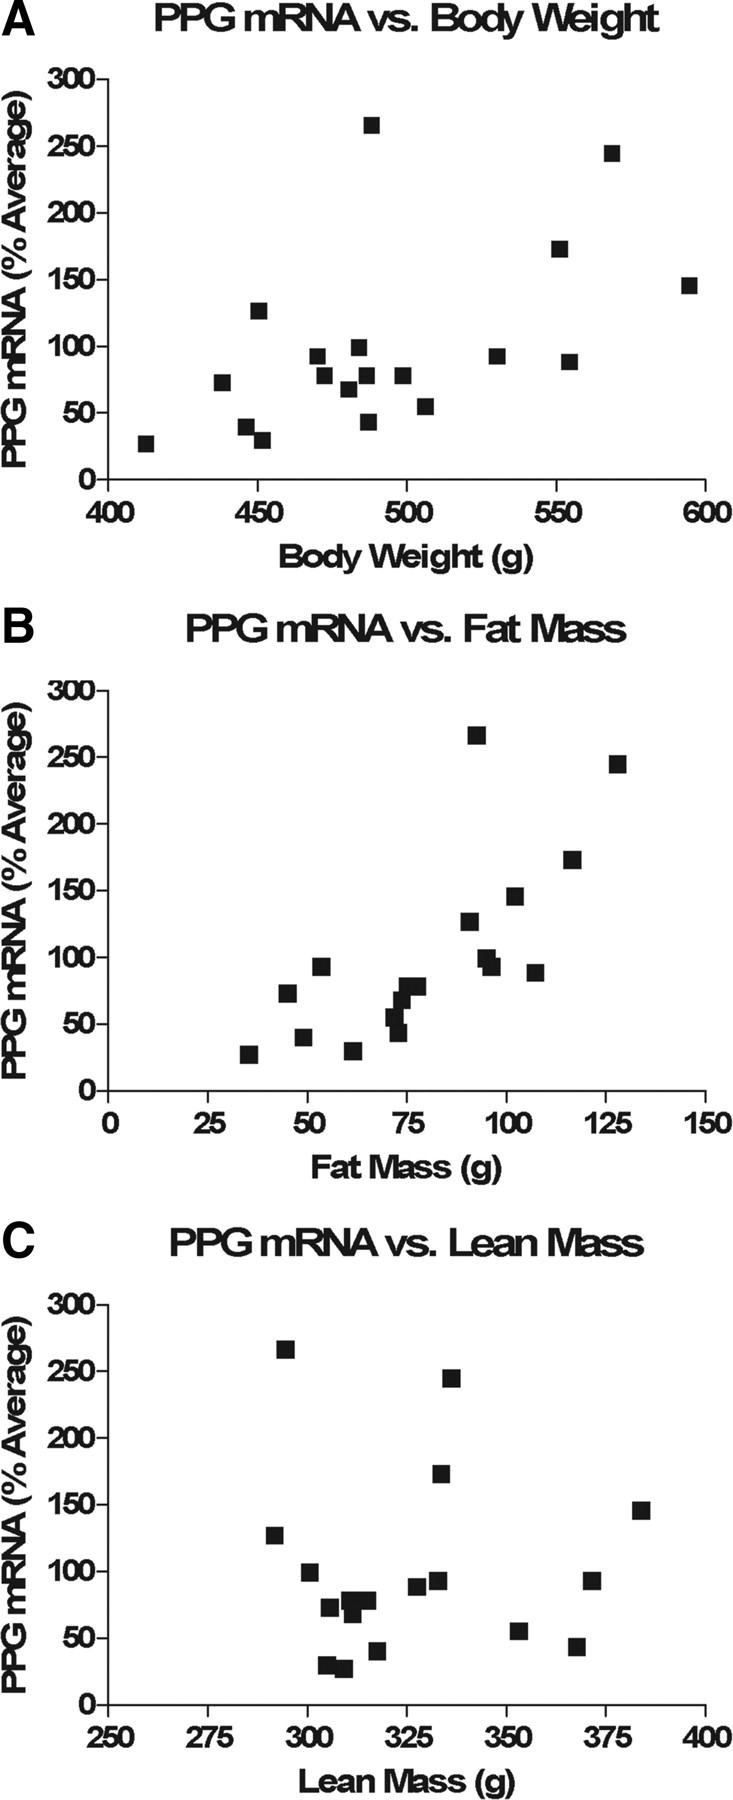
Hindbrain PPG expression correlates positively with fat mass. A–C, PPG mRNA levels of HFD-fed control rats (n = 18) correlated significantly with body weight (A, r = 0.5384, p = 0.0174) and even more so with fat mass (B, r = 0.7207, p = 0.0005) but not with lean mass (C, r = −0.009578).
Chronic ICV Ex9 increases body weight, food intake, and fat mass and leads to glucose intolerance in chow- and HFD-fed rats
The data from the NTS PPG knockdown studies support the hypothesis that the activity of the CNS GLP-1 system is upregulated in diet-induced obesity in an effort to prevent excess fat accumulation. Based on this hypothesis, we predicted that, relative to chow-fed rats, HFD-fed rats would be more sensitive to chronic CNS GLP-1r blockade and would therefore have a greater degree of hyperphagia and fat accumulation. At the outset of the study, saline- and Ex9-treated rats within each diet group did not differ significantly with respect to body weight (chow—407.72 ± 4.09 g vs 412.10 ± 6.76 g; HFD—461.04 ± 6.50 g vs 461.16 ± 5.55 g), fat mass (chow—34.49 ± 2.62 g vs 30.19 ± 1.52 g; HFD—73.06 ± 6.42 g vs 70.19 ± 4.78 g) or lean mass (chow—301.82 ± 4.53 g vs 302.06 ± 4.16 g; HFD—306.91 ± 5.19 g vs 312.96 ± 5.01 g). Contrary to our prediction, chronic ICV Ex9-treated chow- and HFD-fed rats gained significantly more weight (Fig. 6A, F(drug) = 77.29, p < 0.001) and ate significantly more food (Fig. 6B, F(drug) = 41.94, p < 0.001) than their saline-treated controls, yet the degree of weight gain and hyperphagia was not significantly different between the two diets (for weight gain, F(diet × drug) = 2.05, p = 0.16; for cumulative food intake, F(diet × drug) = 2.34, p = 0.14). There was also a significant main effect of diet for both weight gain (F = 40.53, p < 0.001) and cumulative food intake (F = 33.86, p < 0.001).
Figure 6.

Chronic ICV Ex9 results in hyperphagia, increased fat accumulation and glucose intolerance in chow- and HFD-fed rats. A, B, Cumulative body weight change (A) and food intake (B). C, D, Changes in fat mass (C) and lean mass (D). E, F, Intraperitoneal glucose tolerance. Data are represented as mean ± SEM (n = 10 rats per group). *p < 0.05, ***p < 0.001, Ex9 vs saline within chow or HFD.
Weight gain in response to chronic ICV Ex9 was primarily the result of a selective increase in fat mass (Fig. 6C, F(drug) = 26.18, p < 0.001) and not lean mass (Fig. 6D). For change in fat mass, there was also a significant main effect of diet (F = 18.11, p < 0.001) but not a significant diet × drug interaction (F = 1.75, p = 0.20). Consistent with their increased fat mass, chronic ICV Ex9-treated chow- and HFD-fed rats were glucose intolerant relative to saline-treated controls (Fig. 6E,F; F(drug) = 11.00, p = 0.0021 for area under the curve). For area under the curve, there was neither a significant main effect of diet (F = 2.69, p = 0.11) nor a significant diet × drug interaction (F = 0.0004, p = 0.99).
Chronic ICV Ex9-induced weight gain and glucose intolerance are secondary to hyperphagia and increased fat mass, respectively
To better understand the mechanism underlying chronic ICV Ex9-induced weight gain and glucose intolerance, we assessed the ability of chronic ICV Ex9 to increase body weight and impair glucose tolerance independent of hyperphagia and increased fat mass. To this end, we included a group of rats receiving chronic ICV Ex9 that were pair-fed to saline-treated controls. In addition, we included a group of rats receiving the same dose of chronic Ex9, this time administered subcutaneously, to assess the specificity of chronic ICV Ex9 for CNS versus peripheral GLP-1r.
At the outset of the study, saline, Ex9–AL, Ex9–PF, and Ex9–SC rats did not differ significantly with respect to body weight (339.43 ± 4.12 g vs 339.63 ± 4.59 g vs 349.63 ± 4.38 g vs 339.14 ± 4.17 g), fat mass (27.93 ± 1.54 g vs 28.64 ± 1.54 g vs 26.90 ± 1.40 g vs 27.40 ± 1.17 g) or lean mass (238.57 ± 5.37 g vs 235.40 ± 5.48 g vs 242.35 ± 4.77 g vs 234.54 ± 3.39 g). Consistent with the above data, ad libitum-fed chronic ICV Ex9-treated rats gained significantly more weight (Fig. 7A, p < 0.001) and ate significantly more food (Fig. 7B, p < 0.001) than saline-treated controls, whereas these effects were mitigated in pair-fed chronic ICV Ex9-treated rats. Similarly, ad libitum-fed chronic ICV Ex9-treated rats gained significantly more fat mass than saline-treated controls (Fig. 7C, p = 0.003), whereas changes in lean mass were not significantly different (Fig. 7D). Interestingly, pair-fed Ex9-treated rats gained significantly more fat mass than subcutaneous Ex9-treated rats (Fig. 7C, p = 0.038) and exhibited a trend toward increased fat accumulation relative to saline-treated controls (Fig. 7C, p = 0.120). Glucose tolerance was not significantly different between groups (Fig. 7E,F). Finally, there were no differences in weight gain or food intake between chronic subcutaneous Ex9-treated rats and saline-treated controls.
Figure 7.

Chronic ICV Ex9-induced weight gain and glucose intolerance are secondary to hyperphagia and increased fat mass, respectively. A, B, Cumulative body weight change (A) and food intake (B). C, D, Changes in fat mass (C) and lean mass (D). E, F, Intraperitoneal glucose tolerance. Data are represented as mean ± SEM (n = 10 rats per group). **p < 0.01, ***p < 0.001 Ex9–AL vs saline. ##p < 0.01, ###p < 0.001 Ex9–AL vs Ex9–PF. $p < 0.05, $$p < 0.01, $$$p < 0.001 Ex9–AL vs Ex9–SC. @p < 0.05 Ex9–PF vs Ex9–SC.
Discussion
To date, the role of endogenous CNS GLP-1 in the regulation of energy balance has remained elusive, largely because of discrepancies between genetic and pharmacological studies (Scrocchi et al., 1996; Meeran et al., 1999). In addition, the current models of GLP-1r knock-out mice and pharmacological GLP-1r blockade are limited in that they fail to directly target hindbrain-derived GLP-1. Here, for the first time, we address this limitation by using RNAi against NTS PPG in adult rats. Using this method, we aimed to downregulate the presumed sole source of ligand for GLP-1r throughout the CNS by directly targeting the majority of GLP-1-producing neurons. We compared this novel method to direct blockade of GLP-1r throughout the CNS with chronic ICV Ex9. NTS PPG knockdown resulted in hyperphagia and exacerbation of HFD-induced obesity, whereas chronic ICV Ex9 increased food intake and fat accumulation regardless of diet. Together, these data support the hypothesis that CNS GLP-1 activity modulates food intake to achieve a target body weight and level of adiposity.
Traditional models have held that GLP-1 acts primarily as a short-term satiation signal. Consistent with this view, recent studies indicate that gut-derived GLP-1 acts as a physiological satiation signal similar to CCK (Williams et al., 2009) and that hindbrain GLP-1r signaling mediates nutrient- and gastric distension-induced satiation (Hayes et al., 2009). Together, these data support the hypothesis that both peripheral and hindbrain GLP-1r activity limit meal size. The present data now extend these findings to support a model whereby GLP-1 regulates both short- and long-term energy balance.
Interestingly, NTS PPG knockdown failed to alter meal size, duration or number but did increase rate of consumption. These data, combined with those comparing intake of PPG versus control rats across a 24 h period, suggest that hyperphagia induced by NTS PPG knockdown is the result of an accumulation of slight overeating throughout the dark phase. Nonetheless, a role for CNS GLP-1 in meal pattern regulation remains likely, as increased rate of consumption necessitates some change in meal size, duration or number that was perhaps not detected because of our monitoring system parameters, insufficient statistical power or incomplete NTS PPG knockdown. Regardless, most pertinent is the fact that both NTS PPG knockdown and chronic ICV Ex9 increased not only food intake, but also fat mass, revealing a novel role for CNS GLP-1 in the long-term regulation of energy balance.
Although the two models both produced hyperphagia and weight gain, several discrepancies exist between them. Specifically, intra-NTS lentivirus infusion caused considerable weight loss, primarily of lean mass, and this response was significantly attenuated in PPG rats. PPG rats then grew in parallel to control rats while maintained on chow yet when switched to HFD gained significantly more fat mass. In contrast, ICV minipump implantation caused considerably less weight loss, and chronic ICV Ex9 increased the rate of weight gain throughout the duration of treatment. This weight gain was of comparable magnitude in chow- and HFD-fed rats, was largely accounted for by increased fat mass and was blocked by pair-feeding, suggesting that the effect was mediated primarily by hyperphagia. However, the visible trend toward increased fat mass in pair-fed Ex9-treated rats suggests that CNS GLP-1 may limit fat accumulation via other mechanisms such as direct control of peripheral lipid metabolism (Nogueiras et al., 2009).
Regarding the above discrepancies, several explanations are possible. First, the models differ with respect to experimental design parameters, including size and body composition of rats used and specific timing of treatments relative to surgery and diet exposure. Second, the models target different components of the CNS GLP-1 system—NTS PPG versus CNS GLP-1r. Although it is often assumed that only hindbrain-derived GLP-1 activates CNS GLP-1r because of the short circulating half-life of gut-derived GLP-1 (Mentlein et al., 1993), it is possible that both sources activate CNS GLP-1r. In addition, NTS PPG knockdown targets all PPG-derived peptides, which limits our ability to attribute the observed phenotype to reduced activity of GLP-1 alone versus other PPG-derived peptides. In contrast, Ex9 is thought to be GLP-1r-specific, although its ability to block other PPG-derived peptides and its specificity as a competitive GLP-1r antagonist remains debatable (Serre et al., 1998; Tang-Christensen et al., 2000; Lovshin et al., 2001). Finally, the models likely downregulate CNS GLP-1 activity to differing degrees, which may in turn elicit unique compensatory responses including alterations in production and/or secretion of NTS PPG-derived peptides as well as expression and/or sensitivity of CNS GLP-1r. Moreover, the NTS PPG knockdown model is anatomically incomplete because it fails to downregulate PPG in the ventrolateral medulla, an area that may contribute to effects of CNS GLP-1 or other PPG-derived peptides on energy balance.
Hindbrain GLP-1-producing neurons are activated by numerous stimuli, including CCK, LiCl, LPS, artificial gastric distension and leptin (Rinaman, 1999a; Elias et al., 2000; Vrang et al., 2003), many of which are associated with interoceptive stress. As such, it is noteworthy that in the NTS PPG knockdown model, the initial divergence in food intake and body weight occurred within the context of significant postsurgical weight loss. Thus, it is possible that the surgery and viral infection served as interoceptive stressors that differentially stimulated NTS PPG, leading to relative protection from postsurgical anorexia and weight loss in PPG versus control rats, followed by normal growth in both groups. In addition, HFD-induced obesity is associated with hyperleptinemia and metabolic endotoxemia (Frederich et al., 1995; Cani et al., 2007). Therefore, it is possible that as fat mass and plasma leptin and LPS levels increase in response to HFD, so too does NTS PPG, and the increased adiposity observed in HFD-fed PPG rats may reflect a failure to effectively upregulate CNS GLP-1 activity to mitigate HFD-induced fat accumulation.
The above interpretation supports a model whereby NTS PPG neurons are selectively activated by a variety of interoceptive stressors, including illness and surgery as well as HFD-induced obesity. However, this model may not encompass the full range of central GLP-1 effects, as chronic ICV Ex9 increased food intake and weight gain largely in the absence of stress and regardless of diet. This distinction raises the possibility that chronic ICV Ex9 may not solely block hindbrain-derived GLP-1, but it may also block putative central actions of gut-derived GLP-1. Consistent with this hypothesis, a high degree of GLP-1 binding occurs in circumventricular organs where circulating factors can directly activate CNS neurons (Göke et al., 1995; Orskov et al., 1996). Therefore, it is possible that chronic ICV Ex9 blocks not only stress-related GLP-1r activity initiated by hindbrain-derived GLP-1, but also satiation-related GLP-1r activity initiated by gut-derived GLP-1.
Collectively, the present data support the hypothesis that endogenous CNS GLP-1 activity is required for normal regulation of energy balance. However, they fail to reflect previously established roles of CNS GLP-1, including mediation of the response to visceral illness (Rinaman, 1999b; Seeley et al., 2000) as well as direct regulation of energy expenditure parameters and glucose homeostasis (Knauf et al., 2005, 2008; Sandoval et al., 2008). Specifically, NTS PPG knockdown failed to impair formation of a CTA to intraperitoneal LiCl or to alter energy expenditure, RQ or locomotor activity. Moreover, neither NTS PPG knockdown nor chronic ICV Ex9 impaired glucose tolerance independent of changes in fat mass.
We acknowledge the limited interpretability of our negative data, as the above-mentioned effects may have required more complete PPG knockdown and/or GLP-1r blockade to detect. This explanation may very well explain the lack of impaired CTA formation in the NTS PPG knockdown model, as recent data revealed LPS-induced activation of PPG neurons in the dorsal medullary reticular nucleus—an area not targeted by our virus injections (Gaykema et al., 2009). The above-mentioned effects also may have been obscured and/or overcome by compensatory changes occurring in the setting of chronic versus acute CNS GLP-1 loss of function or by nonspecific effects of the virus or infusion process. However, because the efficacy of the NTS PPG knockdown and chronic ICV Ex9 models is validated by the significant effects of each on food intake, body weight and body composition, the possibility of true negative findings, at least within the context of our adult male Long–Evans rat model, must be entertained. Moreover, key differences between our model and that of Knauf et al. (2005, 2008), most notably animal species and diet composition, limit the ability to definitively explain discrepancies in glucose homeostasis data, and future studies are necessary to better understand this putative role of CNS GLP-1.
In conclusion, the present data indicate that both knockdown of NTS PPG and chronic CNS GLP-1r blockade cause hyperphagia and increased fat accumulation, implying that the endogenous CNS GLP-1 system plays a critical role in the long-term regulation of energy balance. In addition, our data reveal a positive correlation between NTS PPG expression and fat mass, raising the possibility that CNS GLP-1 activity is modulated by whole-body energy status. These findings are significant in that they broaden the understanding of GLP-1 function beyond that of a short-term satiation signal, thereby making it a potential target for the prevention and/or treatment of obesity.
Footnotes
This work was supported by National Institutes of Health Grant RO1 DK54890 to R.J.S. and American Diabetes Association Physician Scientist Training Award 7-06-PST-02 to J.G.B. We thank Bailing Li, Benjamin Packard, and Paul Pfluger for their expert technical assistance.
References
- Baggio LL, Drucker DJ. Biology of incretins: GLP-1 and GIP. Gastroenterology. 2007;132:2131–2157. doi: 10.1053/j.gastro.2007.03.054. [DOI] [PubMed] [Google Scholar]
- Berthoud HR. Vagal and hormonal gut-brain communication: from satiation to satisfaction. Neurogastroenterol Motil. 2008;20(Suppl 1):64–72. doi: 10.1111/j.1365-2982.2008.01104.x. [DOI] [PMC free article] [PubMed] [Google Scholar]
- Bollheimer LC, Wrede CE, Rockmann F, Ottinger I, Schölmerich J, Buettner R. Glucagon production of the rat insulinoma cell line INS-1-A quantitative comparison with primary rat pancreatic islets. Biochem Biophys Res Commun. 2005;330:327–332. doi: 10.1016/j.bbrc.2005.01.168. [DOI] [PubMed] [Google Scholar]
- Cani PD, Amar J, Iglesias MA, Poggi M, Knauf C, Bastelica D, Neyrinck AM, Fava F, Tuohy KM, Chabo C, Waget A, Delmée E, Cousin B, Sulpice T, Chamontin B, Ferrières J, Tanti JF, Gibson GR, Casteilla L, Delzenne NM, et al. Metabolic endotoxemia initiates obesity and insulin resistance. Diabetes. 2007;56:1761–1772. doi: 10.2337/db06-1491. [DOI] [PubMed] [Google Scholar]
- Choi DC, Furay AR, Evanson NK, Ostrander MM, Ulrich-Lai YM, Herman JP. Bed nucleus of the stria terminalis subregions differentially regulate hypothalamic-pituitary-adrenal axis activity: implications for the integration of limbic inputs. J Neurosci. 2007;27:2025–2034. doi: 10.1523/JNEUROSCI.4301-06.2007. [DOI] [PMC free article] [PubMed] [Google Scholar]
- Collie NL, Walsh JH, Wong HC, Shively JE, Davis MT, Lee TD, Reeve JR., Jr Purification and sequence of rat oxyntomodulin. Proc Natl Acad Sci U S A. 1994;91:9362–9366. doi: 10.1073/pnas.91.20.9362. [DOI] [PMC free article] [PubMed] [Google Scholar]
- Cota D, Proulx K, Smith KA, Kozma SC, Thomas G, Woods SC, Seeley RJ. Hypothalamic mTOR signaling regulates food intake. Science. 2006;312:927–930. doi: 10.1126/science.1124147. [DOI] [PubMed] [Google Scholar]
- Elias CF, Kelly JF, Lee CE, Ahima RS, Drucker DJ, Saper CB, Elmquist JK. Chemical characterization of leptin-activated neurons in the rat brain. J Comp Neurol. 2000;423:261–281. [PubMed] [Google Scholar]
- Frederich RC, Hamann A, Anderson S, Löllmann B, Lowell BB, Flier JS. Leptin levels reflect body lipid content in mice: evidence for diet-induced resistance to leptin action. Nat Med. 1995;1:1311–1314. doi: 10.1038/nm1295-1311. [DOI] [PubMed] [Google Scholar]
- Gaykema RP, Daniels TE, Shapiro NJ, Thacker GC, Park SM, Goehler LE. Immune challenge and satiety-related activation of both distinct and overlapping neuronal populations in the brainstem indicate parallel pathways for viscerosensory signaling. Brain Res. 2009;1294:61–79. doi: 10.1016/j.brainres.2009.07.076. [DOI] [PMC free article] [PubMed] [Google Scholar]
- Göke R, Larsen PJ, Mikkelsen JD, Sheikh SP. Distribution of GLP-1 binding sites in the rat brain: evidence that exendin-4 is a ligand of brain GLP-1 binding sites. Eur J Neurosci. 1995;7:2294–2300. doi: 10.1111/j.1460-9568.1995.tb00650.x. [DOI] [PubMed] [Google Scholar]
- Goldstone AP, Morgan I, Mercer JG, Morgan DG, Moar KM, Ghatei MA, Bloom SR. Effect of leptin on hypothalamic GLP-1 peptide and brain-stem pre-proglucagon mRNA. Biochem Biophys Res Commun. 2000;269:331–335. doi: 10.1006/bbrc.2000.2288. [DOI] [PubMed] [Google Scholar]
- Hansotia T, Maida A, Flock G, Yamada Y, Tsukiyama K, Seino Y, Drucker DJ. Extrapancreatic incretin receptors modulate glucose homeostasis, body weight, and energy expenditure. J Clin Invest. 2007;117:143–152. doi: 10.1172/JCI25483. [DOI] [PMC free article] [PubMed] [Google Scholar]
- Hayes MR, Bradley L, Grill HJ. Endogenous hindbrain glucagon-like peptide-1 receptor activation contributes to the control of food intake by mediating gastric satiation signaling. Endocrinology. 2009;150:2654–2659. doi: 10.1210/en.2008-1479. [DOI] [PMC free article] [PubMed] [Google Scholar]
- Kim DH, Sandoval D, Reed JA, Matter EK, Tolod EG, Woods SC, Seeley RJ. The role of GM-CSF in adipose tissue inflammation. Am J Physiol Endocrinol Metab. 2008;295:E1038–E1046. doi: 10.1152/ajpendo.00061.2008. [DOI] [PMC free article] [PubMed] [Google Scholar]
- Kinzig KP, D'Alessio DA, Herman JP, Sakai RR, Vahl TP, Figueiredo HF, Murphy EK, Seeley RJ. CNS glucagon-like peptide-1 receptors mediate endocrine and anxiety responses to interoceptive and psychogenic stressors. J Neurosci. 2003;23:6163–6170. doi: 10.1523/JNEUROSCI.23-15-06163.2003. [DOI] [PMC free article] [PubMed] [Google Scholar]
- Knauf C, Cani PD, Perrin C, Iglesias MA, Maury JF, Bernard E, Benhamed F, Grémeaux T, Drucker DJ, Kahn CR, Girard J, Tanti JF, Delzenne NM, Postic C, Burcelin R. Brain glucagon-like peptide-1 increases insulin secretion and muscle insulin resistance to favor hepatic glycogen storage. J Clin Invest. 2005;115:3554–3563. doi: 10.1172/JCI25764. [DOI] [PMC free article] [PubMed] [Google Scholar]
- Knauf C, Cani PD, Ait-Belgnaoui A, Benani A, Dray C, Cabou C, Colom A, Uldry M, Rastrelli S, Sabatier E, Godet N, Waget A, Pénicaud L, Valet P, Burcelin R. Brain glucagon-like peptide 1 signaling controls the onset of high-fat diet-induced insulin resistance and reduces energy expenditure. Endocrinology. 2008;149:4768–4777. doi: 10.1210/en.2008-0180. [DOI] [PubMed] [Google Scholar]
- Lamont BJ, Drucker DJ. Differential antidiabetic efficacy of incretin agonists versus DPP-4 inhibition in high fat diet fed mice. Diabetes. 2008;57:190–198. doi: 10.2337/db07-1202. [DOI] [PubMed] [Google Scholar]
- Lovshin J, Estall J, Yusta B, Brown TJ, Drucker DJ. Glucagon-like peptide (GLP)-2 action in the murine central nervous system is enhanced by elimination of GLP-1 receptor signaling. J Biol Chem. 2001;276:21489–21499. doi: 10.1074/jbc.M009382200. [DOI] [PubMed] [Google Scholar]
- Meeran K, O'Shea D, Edwards CM, Turton MD, Heath MM, Gunn I, Abusnana S, Rossi M, Small CJ, Goldstone AP, Taylor GM, Sunter D, Steere J, Choi SJ, Ghatei MA, Bloom SR. Repeated intracerebroventricular administration of glucagon-like peptide-1-(7-36) amide or exendin-(9-39) alters body weight in the rat. Endocrinology. 1999;140:244–250. doi: 10.1210/endo.140.1.6421. [DOI] [PubMed] [Google Scholar]
- Mentlein R, Gallwitz B, Schmidt WE. Dipeptidyl-peptidase IV hydrolyses gastric inhibitory polypeptide, glucagon-like peptide-1 (7-36) amide, petide histidine methionine and is responsible for their degradation in human serum. Eur J Biochem. 1993;214:829–835. doi: 10.1111/j.1432-1033.1993.tb17986.x. [DOI] [PubMed] [Google Scholar]
- Merchenthaler I, Lane M, Shughrue P. Distribution of pre-pro-glucagon and glucagon-like peptide-1 receptor messenger RNAs in the rat central nervous system. J Comp Neurol. 1999;403:261–280. doi: 10.1002/(sici)1096-9861(19990111)403:2<261::aid-cne8>3.0.co;2-5. [DOI] [PubMed] [Google Scholar]
- Nogueiras R, Pérez-Tilve D, Veyrat-Durebex C, Morgan DA, Varela L, Haynes WG, Patterson JT, Disse E, Pfluger PT, López M, Woods SC, DiMarchi R, Diéguez C, Rahmouni K, Rohner-Jeanrenaud F, Tschöp MH. Direct control of peripheral lipid deposition by CNS GLP-1 receptor signaling is mediated by the sympathetic nervous system and blunted in diet-induced obesity. J Neurosci. 2009;29:5916–5925. doi: 10.1523/JNEUROSCI.5977-08.2009. [DOI] [PMC free article] [PubMed] [Google Scholar]
- Orskov C, Poulsen SS, Møller M, Holst JJ. Glucagon-like peptide 1 receptors in the subformical organ and the area postrema are accessible to circulating glucagon-like peptide 1. Diabetes. 1996;45:832–835. doi: 10.2337/diab.45.6.832. [DOI] [PubMed] [Google Scholar]
- Paxinos G, Watson C. The rat brain in stereotaxic coordinates. Ed 4. San Diego: Academic; 1998. [DOI] [PubMed] [Google Scholar]
- Rinaman L. Interoceptive stress activates glucagon-like peptide-1 neurons that project to the hypothalamus. Am J Physiol. 1999a;277:R582–R590. doi: 10.1152/ajpregu.1999.277.2.R582. [DOI] [PubMed] [Google Scholar]
- Rinaman L. A functional role for central glucagon-like peptide-1 receptors in lithium chloride-induced anorexia. Am J Physiol. 1999b;277:R1537–R1540. doi: 10.1152/ajpregu.1999.277.5.R1537. [DOI] [PubMed] [Google Scholar]
- Sandoval DA, Bagnol D, Woods SC, D'Alessio DA, Seeley RJ. Arcuate glucagon-like pepetide-1 receptors regulate glucose homeostasis but not food intake. Diabetes. 2008;57:2046–2054. doi: 10.2337/db07-1824. [DOI] [PMC free article] [PubMed] [Google Scholar]
- Scott KA, Moran TH. The GLP-1 agonist exendin-4 reduces food intake in nonhuman primates through changes in meal size. Am J Physiol Regul Integr Comp Physiol. 2007;293:R983–R987. doi: 10.1152/ajpregu.00323.2007. [DOI] [PubMed] [Google Scholar]
- Scrocchi LA, Drucker DJ. Effects of aging and a high fat diet on body weight and glucose tolerance in glucagon-like peptide-1 receptor −/− mice. Endocrinology. 1998;139:3127–3132. doi: 10.1210/endo.139.7.6092. [DOI] [PubMed] [Google Scholar]
- Scrocchi LA, Brown TJ, Maclusky N, Brubaker PL, Auerbach AB, Joyner AL, Drucker DJ. Glucose intolerance but normal satiety in mice with a null mutation in the glucagon-like peptide 1 receptor gene. Nat Med. 1996;2:1254–1258. doi: 10.1038/nm1196-1254. [DOI] [PubMed] [Google Scholar]
- Seeley RJ, Blake K, Rushing PA, Benoit S, Eng J, Woods SC, D'Alessio D. The role of CNS GLP-1-(7-36) amide receptors in mediating the visceral illness effects of lithium chloride. J Neurosci. 2000;20:1616–1621. doi: 10.1523/JNEUROSCI.20-04-01616.2000. [DOI] [PMC free article] [PubMed] [Google Scholar]
- Serre V, Dolci W, Schaerer E, Scrocchi L, Drucker D, Efrat S, Thorens B. Exendin-(9-39) is an inverse agonist of the murine glucagon-like peptide-1 receptor: implications for basal intracellular cyclic adenosine 3′,5′-monophosphate levels and beta-cell glucose competence. Endocrinology. 1998;139:4448–4454. doi: 10.1210/endo.139.11.6295. [DOI] [PubMed] [Google Scholar]
- Tang-Christensen M, Larsen PJ, Thulesen J, Rømer J, Vrang N. The proglucagon-derived peptide, glucagon-like peptide-2, is a neurotransmitter involved in the regulation of food intake. Nat Med. 2000;6:802–807. doi: 10.1038/77535. [DOI] [PubMed] [Google Scholar]
- Varndell IM, Bishop AE, Sikri KL, Uttenthal LO, Bloom SR, Polak JM. Localization of glucagon-like peptide (GLP) immunoreactants in human gut and pancreas using light and electron microscopic immunocytochemistry. J Histochem Cytochem. 1985;33:1080–1086. doi: 10.1177/33.10.3900195. [DOI] [PubMed] [Google Scholar]
- Vrang N, Phifer CB, Corkern MM, Berthoud HR. Gastric distension induces c-Fos in medullary GLP-1/2-containing neurons. Am J Physiol Regul Integr Comp Physiol. 2003;285:R470–R478. doi: 10.1152/ajpregu.00732.2002. [DOI] [PubMed] [Google Scholar]
- Vrang N, Hansen M, Larsen PJ, Tang-Christensen M. Characterization of brainstem preproglucagon projections to the paraventricular and dorsomedial hypothalamic nuclei. Brain Res. 2007;1149:118–126. doi: 10.1016/j.brainres.2007.02.043. [DOI] [PubMed] [Google Scholar]
- Vrang N, Larsen PJ, Jensen PB, Lykkegaard K, Artmann A, Larsen LK, Tang-Christensen M. Upregulation of the brainstem preproglucagon system in the obese Zucker rat. Brain Res. 2008;1187:116–124. doi: 10.1016/j.brainres.2007.10.026. [DOI] [PubMed] [Google Scholar]
- Williams DL, Baskin DG, Schwartz MW. Evidence that intestinal glucagon-like peptide-1 plays a physiological role in satiety. Endocrinology. 2009;150:1680–1687. doi: 10.1210/en.2008-1045. [DOI] [PMC free article] [PubMed] [Google Scholar]
- Zhang R, Packard BA, Tauchi M, D'Alessio DA, Herman JP. Glucocorticoid regulation of preproglucagon transcription and RNA stability during stress. Proc Natl Acad Sci U S A. 2009;106:5913–5918. doi: 10.1073/pnas.0808716106. [DOI] [PMC free article] [PubMed] [Google Scholar]