

Abstract
This research investigated the thermodynamic favorability and resulting structures for chemical adsorption of trichloroethylene (TCE) to metallic iron using periodic density functional theory (DFT). Three initial TCE positions having the plane defined by HCC atoms parallel to the iron surface resulted in formation of three different chemisorption complexes between carbon atoms in TCE and the iron surface. The Cl-bridge initial configuration with the HCC plane of the TCE molecule perpendicular to the iron surface did not result in C–Fe bond formation. The most energetically favorable complex formed at the C-bridge site where the initial configuration had the C=C bond in TCE at a bridge site between adjacent iron atoms. In the C-bridge complex one C atom formed two sigma bonds to different Fe atoms while the second C atom formed a sigma bond with a second Fe atom. Surface complexation at the C-bridge site resulted in scission of all three C–Cl bonds, and also resulted in a shortening of the C=C bond to a distance intermediate between a double and a triple bond. Initial configurations with the C=C bond adsorbed at top or hollow sites on the iron surface resulted in formation of C–Fe sigma bonds between a single C and two adjacent Fe atoms, and the scission of only two C–Cl bonds. Bond angles and bond lengths indicated that there were no changes in bond order of the C=C bond for top and hollow adsorption. Chemisorption at the C-bridge site had an early transition state in which all three C–Cl bonds were activated from ~1.7 to ~2.2 Å, with an activation energy of 49 kJ/mol. The early transition state and the loss of all three Cl atoms upon chemisorption are consistent with most experimental observations that TCE undergoes complete dechlorination in one interaction with the iron surface. The absence of chemisorption and scission of only two C–Cl bonds at the Cl-bridge site is consistent with experimental observations that trace amounts of chloroacetylene may also be produced from reactions of TCE with iron.
Introduction
The common practice of using zerovalent iron as a reactive medium for treating solvent contaminated groundwater has promoted considerable research into the reactions of chlorinated solvents with iron metal. Reductive dechlorination of chlorinated solvents by iron was first reported by Sweeny (1). Later, Gillham and others proposed exploiting these reactions for in situ remediation of groundwater contaminated by chlorinated solvents (2, 3, 4, 5). Although reaction rates and reaction byproducts of most one and two carbon chlorinated compounds with iron have been measured, little is known about the reaction mechanisms.
Chloroalkane dechlorination has been observed to produce stable intermediates containing one fewer Cl atom than the parent compound (6, 7). For reduction of carbon tetrachloride to chloroform, prior investigators reported that the reaction mechanism involves the outer-sphere transfer of electrons to a carbon tetrachloride molecule physically adsorbed at the iron surface (8). In outer-sphere electron transfer reactions, reduction occurs via electron tunneling and no bonds between the surface and the oxidant are formed (9). The weak nature of physical adsorption results in only short-term contact between the reactant and the surface, allowing desorption to occur after only one Cl atom has been removed.
In contrast to the sequential dechlorination observed for chloroalkanes, reduction of chloroalkenes produces only trace quantities of chlorinated intermediates (3, 4, 5, 7). The near absence of chlorinated intermediates between trichloroethylene (TCE) and ethene was first observed by Orth and Gillham (3) who proposed that strong interactions between pi-electrons in TCE and the iron facilitated a sufficiently long association with the surface to allow a 6 electron transfer before desorption occurs. In contrast to the pi-interactions proposed by Orth and Gillham, Arnold and Roberts proposed chloroethenes form di-sigma C–Fe bonds with the iron surface (10). These hypotheses that chemical adsorption may be involved in choroalkene reduction are consistent with data showing that reduction rates of TCE are not controlled by an outer-sphere electron transfer reaction (8). Other indirect evidence for a catalytic role of the iron surface in chloroalkene reduction is the observation that alkyl halides, such as 1,2-dichloroethane, are much less reactive than vinyl halides, such as 1,2-dichloroethene, despite having a more positive reduction potential for one and two electron reduction reactions (10). Although there is some indirect evidence, actual chemisorption of chloroalkenes may be difficult to confirm using spectroscopic methods due to the fact that reactions with the iron metal occur beneath the oxide layer coating the iron surfaces (11). This difficulty makes quantum mechanical modeling approaches attractive for studying the importance of surface bound intermediates in dechlorination reactions.
Density functional theory (DFT) is a quantum mechanical modeling approach based on expressing the total energy of a system as a functional of the electron density (12, 13, 14). The accuracy of DFT is comparable with correlated molecular orbital methods, but requires substantially less computational effort (15). Because of its computational advantages, DFT has evolved as the most important quantum mechanical approach in solid-state physics (16, 15), and can handle large, periodic systems that are intractable by correlated molecular orbital methods (17, 18). In DFT, the energy is decomposed into contributions from the kinetic energy, the Coulomb energy, and the exchange-correlation energy. Although this decomposition is exact, its implementation requires approximations since the actual functionals for the many body exchange and correlation energies are unknown (15).
The goal of this investigation was to determine the thermodynamic favorability and resulting structures for chemisorption of TCE to the (100) surface of metallic iron. A more thorough understanding of the mechanisms controlling reductive dechlorination may help to resolve some apparent contradictions in the literature, and may aid in the development of more effective reduction catalysts. Towards that end, DFT calculations were performed to investigate the possible binding modes of TCE to metallic iron.
Materials and Methods
The iron was modeled using a periodic four-layer slab containing 6 iron atoms in each layer. The slab was generated by cutting a periodic iron crystal from the Accelrys Materials Studio library (19) through its (100) plane. The top two layers of iron atoms were flexible while the bottom two layers were held rigid. This resulted in Fe–Fe distances of 2.610 Å in the surface layer, 2.629 Å in the second layer and 2.482 Å in the third and fourth layers. In order to prevent interactions between the adsorbate molecule and the image of the surface, the slab was separated from its image perpendicular to the iron surface by a 20 Å vacuum space.
DFT calculations were performed using the DMol3 (20) package in the Accelrys Materials Studio modeling suite using a personal computer operating with a 2.8 GHz Pentium 4 processor. All simulations used double-numeric with polarization (DNP) basis sets (20, 21) and the nonlocal Perdew-Burke-Enzerhof (PBE) (22, 23, 24) functional for exchange and correlation. The nuclei and core electrons were described by DFT semi-local pseudopotentials (25) and the Brillouin-zone integrations were performed on a 2 × 3 × 1 Monkhorst-Pack (26) grid of k-points. The transition state search was performed using the quadratic synchronous transit (QST) method. The energy optimized structures and transition state were verified by frequency calculations. Imaginary frequencies with wave numbers smaller than 10 cm−1 were considered to be numerical artifacts of the integration grid and convergence criteria (27).
A geometry optimization and a vibrational frequency analysis were performed on a gas phase TCE molecule to verify applicability of the PBE functional and to generate an initial structure for TCE. Vibrational frequencies were calculated using the harmonic approximation and corrected for anharmonicity using scaling factors (28). Figure 1 shows the four different initial configurations that were used in the DFT calculations. Three of the initial configurations placed the HCC plane of the TCE molecule parallel to the Fe (100) surface at bridge, top and hollow sites. In the fourth initial structure, the HCC plane of the TCE molecule was perpendicular to the Fe (100) surface with two Cl atoms at bridge sites between adjacent Fe atoms.
Figure 1.

Four initial configurations for TCE on the Fe (100) surface. Iron atoms in the first layer are denoted by red spheres and in the second layer by blue crosses. The distance between TCE C atoms and the nearest Fe atom(s) are 1.80 Å in the C-bridge and top configurations and 2.0 Å in the hollow configuration. The distance between the nearest Cl atoms in TCE and the nearest Fe atoms are 1.90 Å in the Cl-bridge configuration.
Results and Discussion
Table 1 summarizes the optimized geometry parameters and vibrational frequencies for the gas phase TCE molecule and compares them to experimental results. The calculated results are in good agreement with experimental values for both the geometry parameters and vibrational frequencies. This indicates that the PBE functional gives reasonable results for TCE.
Table 1.
Comparison of experimental and calculated bond lengths, bond angles and vibrational frequencies (expressed as wave numbers) for gas phase TCE. A scaling factor of 0.9725 was used to correct the harmonic oscillator frequencies for anharmonicity (28).
| Properties | Calculated | Experimental (46) |
|---|---|---|
| C(1) – C(2) bond (Å) | 1.342 | 1.337 |
| C(1) – Cl(1) bond (Å) | 1.717 | 1.713 |
| C(1)–Cl(2) | 1.730 | 1.720 |
| C(2)–Cl(3) | 1.715 | 1.713 |
| C – H bond (Å) frequencies (cm−1) | 1.086 | 1.080 |
| 204 | 215 | |
| 437 | 451 | |
| 789 | 780 | |
| 166 | 178 | |
| 261 | 277 | |
| 369 | 384 | |
| 595 | 630 | |
| 811 | 840 | |
| 886 | 931 | |
| 1249 | 1247 | |
| 1512 | 1586 | |
| 3148 | 3082 |
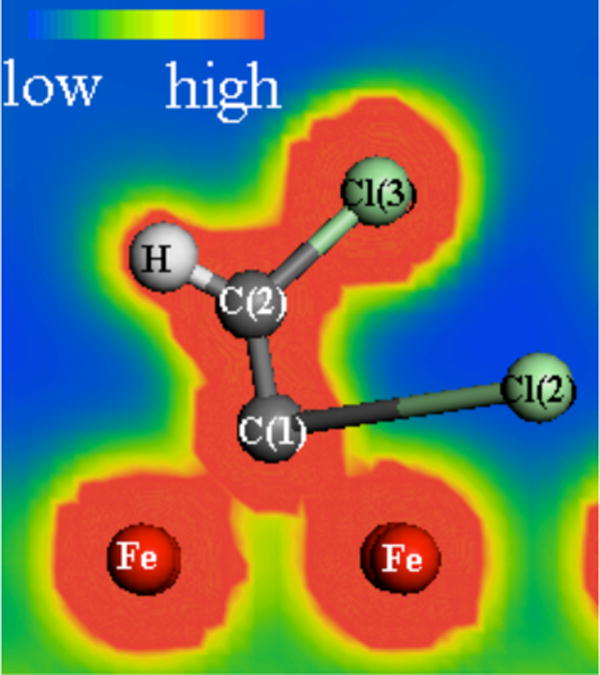
Figure 2a shows the structure resulting from complex formation at the C-bridge site. The overlap population given as Table S1 in the supporting information can be used to determine the bonding between atoms. The large overlap between the 2s, 2px, and 2pz orbitals in C(1) and C(2), and the minimal overlap with the 2py orbitals indicate that both C atoms retained their sp2 hybridization. The large overlap between the 2py orbitals in C(1) and C(2) indicate that the C atoms also retained their pi bond. In addition to the overlap matrix in Table S1, the electrostatic potentials indicated by the coloring in Figure 2 illustrate the bonding between atoms. Sigma bonds were formed between C(1) and two Fe atoms, while C(2) formed a single sigma bond with only one Fe atom. The C–Fe bond distances of 1.895 to 2.063 Å are close to the value of 1.991 Å measured for ethene complexes with metallic iron (29). Upon chemisorption at the C-bridge site, the C=C bond length decreased from 1.343 Å to 1.299 Å and the ∠HCC bond angle increased from 120.9° to 150.7°. These bond parameters are intermediate between those for a double and triple bond. This change is opposite to the decrease in carbon-carbon bond order to values between 1.4 and 1.6 when ethylene forms pi-complexes on iron surfaces (30).
Figure 2.

a) TCE complex formed at the C-bridge site. The electrostatic potentials are indicated by the color scaling and illustrate areas of overlapping electron density between atoms. b) Electrostatic potentials showing Cl(3) adsorbed at a hollow site between 2 Fe atoms.
Complex formation at the C-bridge site resulted in elongation of all three C–Cl bonds in TCE from ~1.7 Å to ~3.3 Å. The extent of C–Cl bond scission associated with elongation to 3.3 Å can be roughly estimated by examining the C–Cl bond energy as a function of the bond length for gas phase TCE. Figure 3 shows the energy changes associated with varying the C(1)–Cl bond length in gas phase TCE from its minimum energy value of 1.7 Å. Bond elongation from 1.7 to 3.3 Å is associated with a loss of more than 90% of the bond energy. Thus, the bond lengths – 3.3 Å in the chemisorbed structure indicate that all three Cl atoms were nearly completely dissociated from the C atoms. The electrostatic potentials in Figure 2a show that there is very little overlap in electron density between the C and Cl atoms. Scission of the three C–Cl bonds was accompanied by formation of Fe–Cl bonds where each Cl atom is bound to two neighboring iron atoms, as illustrated by the electrostatic potential diagram in Figure 2b. The Fe–Cl bond lengths of ~2.3 Å were close to the value of 2.31 Å observed in crystalline FeCl3 (31), which is consistent with chemical bond formation between the Fe and Cl atoms.
Figure 3.

C(1)–Cl(1) bond energy as a function of the C(1)–Cl(1) bond distance for gas phase TCE. Energy zero is referenced to the minimum energy C–Cl bond length. All other atoms were held fixed as the length of C(1)–Cl(1) bond was stretched.
The simulation results for the C-bridge site were not affected by the size of the unit cell. Calculations performed using nonperiodic clusters containing 36 through 144 atoms yielded nearly identical results. This indicates that the unit cell was sufficiently large to avoid artifacts resulting from image interactions associated with the periodic structure.
Figure 4 shows the final structure resulting from chemical adsorption of TCE at the top site. Chemisorption at the top site resulted in a sigma bonded complex between C(1) and two different Fe atoms. The C(1)–Fe bond lengths of 1.943 and 1.976 Å are very close to the value of 1.991 Å measured for ethene-iron complexes (29). In contrast to the C-bridge complex which had near complete scission of all three C–Cl bonds, only the two C–Cl bonds on the C atom nearest the surface became elongated in the top site structure. However, the amount of C–Cl bond elongation was ~0.6 Å greater in the top as compared to the C-bridge structure. This indicates a more complete breakage of the C–Cl bonds in the top structure. As in the C-bridge structure, the dissociated Cl atoms each formed two bonds with adjacent iron atoms. The near complete scission of two C–Cl bonds combined with formation of two C–Fe bonds resulted in maintaining the bond order of the C=C bond and forming a planar structure CHClCFe2. The ∠HCC bond angle of 128.1° and the C=C bond length of 1.348 Å were only slightly increased over their values of 120.9° and 1.343 Å in gas phase TCE. This indicates that there was little change in bond order for the C=C bond.
Figure 4.
Structure for TCE adsorbed at the C-top site. The electrostatic potentials are indicated by the color scaling and illustrate areas of overlapping electron density between atoms.
Figure 5 shows the complex that formed from TCE placed at the hollow site. The C=C bond length increased from 1.343 to 1.355 Å and the ∠HCC bond angle decreased by 9° as compared to gas phase TCE. These small changes indicate that the carbon atoms largely retained their sp2 hybridization after complex formation. As illustrated in Figure 5, complex formation also resulted in the formation of two bonds between C(2) and two adjacent Fe atoms with bond lengths of 2.035 and 2.212 Å. The C–Cl bond length increases in Table 2 indicate that there was near complete breakage of the C(1)–Cl(2) and C(2)–Cl(3) bonds, but only a small activation of the C(1)–Cl(1) bond.
Figure 5.

a) Structure for TCE adsorbed at the C-hollow site. b) Electrostatic potentials showing C(2) and Cl(3) adsorbed at hollow sites between adjacent Fe atoms.
Table 2.
Equilibrium bond lengths (Å) and bond angles (°) for gas phase and chemically adsorbed TCE. Also listed are the geometry parameters for TCE physically adsorbed at the C-bridge site and for the transition state for the C-bridge site. The C–Fe and Cl–Fe bond lengths are for the two nearest Fe atoms.
| Mode | C(1)–Cl(1) | C(1)–Cl(2) | C(2)–Cl(3) | C(2)–H | C(1)–C(2) |
|---|---|---|---|---|---|
| gas phase TCE | 1.717 | 1.730 | 1.715 | 1.086 | 1.342 |
| C-bridge complex | 3.332 | 3.262 | 3.418 | 1.082 | 1.299 |
| top complex | 3.929 | 3.899 | 1.835 | 1.092 | 1.348 |
| hollow complex | 1.973 | 3.387 | 3.733 | 1.113 | 1.355 |
| Cl-bridge complex | 3.565 | 1.649 | 3.725 | 1.076 | 1.236 |
| physical C-bridge | 1.769 | 1.769 | 1.790 | 1.091 | 1.359 |
| transition C-bridge | 2.168 | 2.169 | 2.238 | 1.099 | 1.305 |
| Mode | C(1)–Fe | C(2)–Fe | Cl(1)–Fe | Cl(2)–Fe | Cl(3)–Fe | ∠HC(2)C(1) |
|---|---|---|---|---|---|---|
| gas phase TCE | 120.9 | |||||
| C-bridge | 1.895 | 2.036 | 2.256 | 2.243 | 2.350 | 150.7 |
| 2.063 | 3.173 | 2.566 | 3.561 | 2.398 | ||
| top | 1.943 | 2.996 | 2.362 | 2.369 | 3.975 | 128.1 |
| 1.976 | 3.150 | 2.365 | 2.375 | 4.856 | ||
| hollow | 2.947 | 2.035 | 2.322 | 2.285 | 2.367 | 111.7 |
| 3.210 | 2.212 | 3.691 | 2.519 | 2.367 | ||
| Cl-bridge | 5.695 | 5.156 | 2.244 | 6.132 | 2.379 | 172.6 |
| 5.737 | 5.728 | 3.630 | 6.706 | 2.399 |
Figure 6 shows the complex that formed from TCE at the Cl-bridge site. In contrast to the other complexes, no C–Fe bonds were formed. Complete scission of two C–Cl bonds resulted in an increase in bond order from 2 to 3 for the carbon-carbon bond. The C(1)–Cl(2) bond length decreased from 1.733 to 1.649 Å, which is almost same as the C–Cl bond length of 1.647 Å in dichloroacetylene (C2Cl2) (32). The C(2)-H bond length decreased from 1.088 to 1.076 Å, which is almost same as the C–H bond length of 1.074 Å found in acetylene (C2H2) (32). As shown in Table 2, the C–C bond length decreased from 1.343 to 1.236 Å, which is a value very close to the carbon-carbon triple bond length of 1.22 Å found in C2H2 (32). The increase in the ∠HCC bond angle from 120.9 to 172.6° is also consistent with transitioning from a double to a triple bond.
Figure 6.
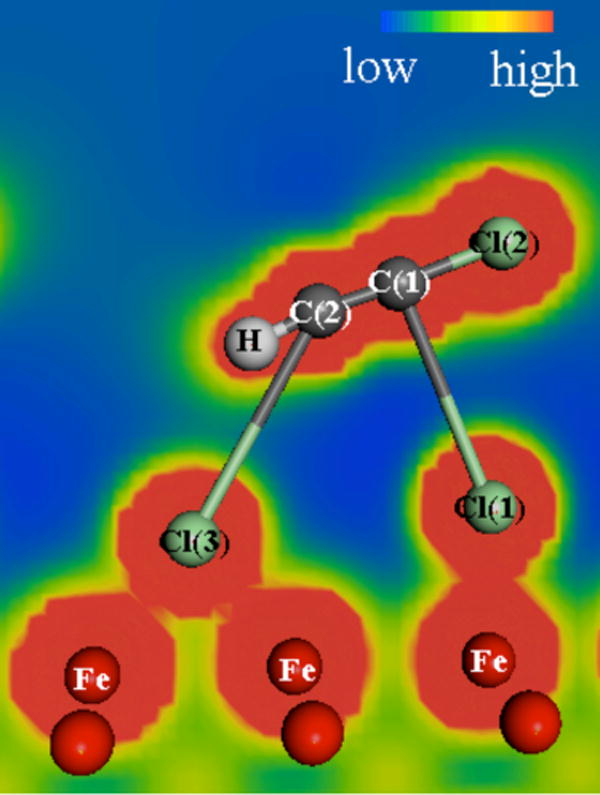
Structure for TCE at the Cl-bridge site. The electrostatic potentials are indicated by the color scaling and illustrate areas of overlapping electron density between atoms.
The binding energies for each complex can be calculated from the energy of the complex less the energies of the isolated iron slab and isolated TCE molecule. The most energetically favorable complex was formed at the C-bridge site, which had a binding energy of −691 kJ/mol. Complexes formed at the top and hollow sites had binding energies of −604 and −522 kJ/mol, respectively. Although no C–Fe bonds were formed at the Cl-bridge site, the formation of chloroacetylene and two Fe–Cl bonds for each Cl atom was associated with a binding energy of −370 kJ/mol. At all sites, the binding energies were highly exergonic and thereby energetically favorable. However, due to absence of water molecules in the simulations, these binding energies should not be taken as representative of those in aqueous systems. Although vacuum slab models can reproduce the electronic structure of clean metals in solution at their potential of zero charge (33, 34), the absence of water molecules in these simulations likely limits the extent to which the reactions proceed. For example, scission of the C–Cl bonds in TCE would likely produce solvated Cl− ions rather than Cl atoms chemisorbed to metallic iron.
For complex formation to play an important role in TCE dechlorination, the activation energy must be sufficiently low so that the binding reaction can proceed at useful rates at ambient temperatures. The activation energy for complex formation was determined for the most energetically favorable binding mode by determining the transition state for the C-bridge complex using the QST method. Figure 7 shows the stationary point structure for physically adsorbed TCE and the transition state structure for the C-bridge complex. The activation energy between physically adsorbed TCE and the transition state is 49 kJ/mol. This value is close to range of 32 to 39 kJ/mol that has been experimentally observed for TCE reduction by iron filings (35). The transition state is an early one in that it more closely resembles the initial structure than the final structure. As shown in Table 2, all three C–Cl bonds become activated in the transition state, which is consistent with scission of all three C–Cl bonds in the final complex.
Figure 7.

Comparison of the physically adsorbed stationary structure (a) and the transition state structure (b) for the C-bridge complex.
For all four TCE complexes, changes in C=C bond length and HCC bond angle are consistent with maintaining the C=C double bond or transitioning to a C≡C triple bond. This behavior contrasts with that observed for TCE complexes on noble metal catalysts. For example, on Pd catalysts, TCE chemisorption elongates the C=C bond by 0.12 Å to a distance that is intermediate between a single and double bond (36); while on Pt catalysts, the C=C bond length increases from 1.34 to 1.54 Å, which is the average bond length for a C–C single bond (37).
The different direction of the C=C bond order changes with iron versus noble metal catalysts is consistent with the greater degree of molecular fragmentation observed for the TCE complexes with iron. The C–Cl bond elongations of more than 1.5 Å in the iron complexes were much greater than those calculated for TCE chemisorption on Pd alloys (38), but are consistent with those calculated for TCE reactions with an Fe(II) bearing clay mineral, where a maximum elongation of 1.6 Å was observed (39). The greater degree of molecular fragmentation resulting from the chemisorption reaction on iron as compared to noble metals may be attributed to the fact that in addition to catalyzing the reduction reactions, the iron also serves as the electron donor. Because of the higher electronic chemical potential (40) of Fe (−4.02 eV), as compared to a noble metal, such as Pd (−4.75 eV), equalization of the electronic chemical potentials between the adsorbate and the metal result in greater charge transfer in the iron complexes as compared to those with noble metals (33). DFT calculations of di-sigma TCE complexes on a Pd-Cu alloy show that the maximum activation in the C–Cl bonds is only 0.17 Å, and that the three Cl atoms are removed sequentially. This modeling result is consistent with the experimental observation that significant amounts of dichloroethene and vinyl chloride are produced from TCE reactions with Pd catalysts (41).
These modeling results support prior hypotheses that chemical adsorption is involved in reductive dechlorination of TCE on iron surfaces. Chemical adsorption catalyzes the reactions and may explain why reaction rates for reduction of chloroethenes are greater than those predicted by linear free energy relationships based on data for chloroalkanes (42). The chemisorbed structures observed in this study are consistent with the observed reaction products. Activation of all C–Cl bonds to their breaking points in sigma bonded TCE structures is consistent with completely dechlorinated reaction products that have been observed in most studies (3, 4, 7, 8, 43). Activation of two C–Cl bonds on C atoms in the top and hollow sites is consistent with observations that trace levels of chloroacetylene are formed from reduction of TCE (10). Activation of multiple C–Cl bonds upon chemisorption suggests that the hydrogenolysis pathway that yields products containing 1 fewer Cl atom than the parent compound (5, 44, 45) may result from a mechanism that does not involve complex formation, such as reaction with Fe2+ in the oxide layer. Mechanisms producing slower reacting chlorinated intermediates may therefore become increasingly important over time as oxide buildup decreases chloroethene access to the zerovalent iron surface.
Supplementary Material
Acknowledgments
Thanks to Eric Case for computer support. This research has been supported by the United States Environmental Protection Agency (U.S. EPA) Office of Research and Development through Grant R-825223-01-0 and by grant number 2P42ES04940-11 from the National Institutes for Environmental Health Sciences of the National Institutes for Health, with funds from the U.S. EPA.
Literature Cited
- 1.Sweeny KH. The reductive treatment of industrial wastewaters: II. process description. AIChE Symposium Ser. 1980;77(209):72–78. [Google Scholar]
- 2.Gillham RW, O’Hannesin SF. Enhanced degradation of halogenated aliphatics by zero-valent iron. Ground Water. 1994;32(6):958–967. [Google Scholar]
- 3.Orth WS, Gillham RW. Dechlorination of trichloroethene in aqueous solution using Fe0. Environ Sci Technol. 1996;30(1):66–71. [Google Scholar]
- 4.Campbell TJ, Burris DR, Roberts AL, Wells JR. Trichloroethylene and tetrachloroethylene reduction in a metallic iron-water-vapor batch system. Environ Toxicol Chem. 1997;16(4):625–630. [Google Scholar]
- 5.Liang LY, Korte N, Goodlaxson JD, Clausen J, Fernando Q, Muftikian R. Byproduct formation during the reduction of TCE by zero-valence iron and palladized iron. Ground Water Monit Rem. 1997;17(1):122–127. [Google Scholar]
- 6.Matheson LJ, Tratnyek PG. Reductive dehalogenation of chlorinated methanes by iron metal. Environ Sci Technol. 1994;28(12):2045–2053. doi: 10.1021/es00061a012. [DOI] [PubMed] [Google Scholar]
- 7.Tratnyek PG, Johnson TL, Scherer MM, Eykholt GR. Remediating ground water with zero-valent metals: chemical considerations in barrier design. Ground Water Monit Rem. 1997;17(4):108–114. [Google Scholar]
- 8.Li T, Farrell J. Electrochemical investigation of the rate-limiting mechanisms for trichloroethylene and carbon tetrachloride reduction at iron surfaces. Environ Sci Technol. 2001;35(17):3560–3565. doi: 10.1021/es0019878. [DOI] [PubMed] [Google Scholar]
- 9.Bockris JO’M, Reddy AK. Modern Electrochemistry; an Introduction to an Interdisciplinary Area. Plenum Press; New York: 1970. [Google Scholar]
- 10.Arnold WA, Roberts AL. Pathways and kinetics of chlorinated ethylene and chlorinated acetylene reaction with Fe(0) particles. Environ Sci Technol. 2000;34(9):1794–1805. [Google Scholar]
- 11.Wang J, Farrell J. Investigating the role of atomic hydrogen on chloroethene reactions with iron using Tafel analysis and electrochemical impedance spectroscopy. Environ Sci Technol. 2003;37(17):3891–3896. doi: 10.1021/es0264605. [DOI] [PubMed] [Google Scholar]
- 12.Thomas LH. The calculation of atomic field. Proc Camb Philos Soc. 1927;23:542–548. [Google Scholar]
- 13.Hohenberg P, Kohn W. Inhomogeneous electron gas. Phys Rev B. 1964;136(3B):864–871. [Google Scholar]
- 14.Kohn W, Sham L. Self-consistent equations including exchange and correlation effects. J Phys Rev A. 1965;140(4A):1133–1138. [Google Scholar]
- 15.Wimmer E. Computational materials design and processing: perspectives for atomistic approaches. Mater Sci Eng B. 1996;37:72–82. [Google Scholar]
- 16.Politzer P, Seminario JM, Concha MC, Murray JS. Some applications of local density functional theory to the calculation of reaction energetics. Theor Chim Acta. 1993;85:127–136. [Google Scholar]
- 17.Dahl JP, Avery J. Local Density Approximations in Quantum Chemistry and Solid State Physics. Plenum Press; New York: 1984. [Google Scholar]
- 18.Labonowski JK, Andzelm JW. Density Functional Methods in Chemistry. Springer-Verlag; New York: 1991. [Google Scholar]
- 19.Accelrys, Inc. Material Studio 2.2. San Diego, CA: 2001. [Google Scholar]
- 20.Delley B. An all-electron numerical-method for solving the local density functional for polyatomic-molecules. J Chem Phys. 1990;92(1):508–517. [Google Scholar]
- 21.Delley B. Fast calculation of electrostatics in crystals and large molecules. J Phys Chem. 1996;100(15):6107–6110. [Google Scholar]
- 22.Perdew JP, Burke K, Ernzerhof M. Generalized gradient approximation made simple. Phys Rev Lett. 1996;77(18):3865–3868. doi: 10.1103/PhysRevLett.77.3865. [DOI] [PubMed] [Google Scholar]
- 23.Zhang YK, Yang WT. Comment on “generalized gradient approximation made simple”. Phys Rev Lett. 1998;80(4):890–890. [Google Scholar]
- 24.Hammer B, Hansen LB, Norskov JV. Improved adsorption energetics within density-functional theory using revised Perdew-Burke-Ernzerhof functionals. Phys Rev B. 1999;59(11):7413–7421. [Google Scholar]
- 25.Delley B. Hardness conserving semilocal pseudopotentials. Phy Rev B. 2002;66(15):5125-1–5125-9. [Google Scholar]
- 26.Monkhorst HJ, Pack JD. Special points for Brillouin-zone integration. Phys Rev B. 1976;13(12):5188–5192. [Google Scholar]
- 27.Barbosa LAMM, Sautet P. Trichloroethene dechlorination reaction on the PdCu(110) alloy surface: a periodical density functional theory study of the mechanism. J Catal. 2002;207:127–138. [Google Scholar]
- 28.Lewars E. Computational Chemistry: Introduction to the Theory and Applications of Molecular and Quantum Mechanics. Kluwer Academic Publishers; Norwell: 2003. [Google Scholar]
- 29.Lide DR, editor. CRC Handbook of Chemical Physics. (85) 2004–2005 (available at http://www.hbcpnetbase.com/)
- 30.Masel RI. Principles of Adsorption and Reaction on Solid Surfaces. John Wiley & Sons; New York: 1996. [Google Scholar]
- 31.Young NA. X-ray absorption fine structure study of the structural changes accompanying spin cross-over in the acetone solvates of [Fe(dppen)(2)X(2)] [dppen=cis-1,2-bis(diphenylphosphino)ethylene; X=Cl or Br] J Chem Soc Dalton. 1996;7:1275–1281. [Google Scholar]
- 32.http://srdata.nist.gov/cccbdb/
- 33.Crispin X, Bureau C, Geskin VM, Lazzaroni R, Salaneck WR, Bredas JL. Chemisorption of acrylonitrile on the Cu(100) surface: a local density functional study. J Chem Phys. 1999;111(7):3237–3251. [Google Scholar]
- 34.Bradley RA, Georgiadis R, Kevan SD, Richmond GL. Nonlinear-optical spectroscopy of the Ag(111) surface in an electrolyte and in vacuum. J Chem Phys. 1993;99(7):5535–5546. [Google Scholar]
- 35.Su C, Puls RW. Kinetics of TCE reduction by zero valent iron and tin: pretreatments effect, apparent activation energy, and intermediate products. Environ Sci Technol. 1999;33(1):163–168. [Google Scholar]
- 36.Sriwatanapongse W, Reinhard M, Klug CA. Reductive hydrodechlorination of TCE by palladium on alumina catalyst: a solid state NMR study of the surface reaction. Extended Abstract, Division of Environmental Chemistry; National Meeting of the American Chemical Society; Chicago, IL. 2001.p. 730. [Google Scholar]
- 37.Grassian VH, Pimentel GC. The structures of cis-dichloroethene and trans-dichloroethene adsorbed on Pt(111) J Chem Phys. 1988;88(7):4478–4483. [Google Scholar]
- 38.Barbosa LAMM, Loffreda D, Sautet P. Chemisorption of trichloroethene on the PdCu alloy (110) surface: a periodical density functional study. Langmuir. 2002;18(7):2625–2635. [Google Scholar]
- 39.Teppen BJ, Yu CH, Newton SQ, Miller DM, Schäfer L. Quantum molecular dynamics simulations regarding the dechlorination of trichloroethene in the interlayer space of the 2: 1 clay mineral nontronite. J Phys Chem A. 2002;106(22):5498–5503. [Google Scholar]
- 40.James AM, Lord MP. Macmillan’s Chemical and Physical Data. Macmillan; London: 1992. [Google Scholar]
- 41.Lowry GV, Reinhard M. Pd-catalyzed TCE dechlorination in water: effect of H2(aq) and H2-utilizing competitive solutes on the TCE dechlorination rate and product distribution. Environ Sci Technol. 2001;35(4):696–702. doi: 10.1021/es001623f. [DOI] [PubMed] [Google Scholar]
- 42.Liu ZJ, Betterton EA, Arnold RG. Electrolytic reduction of low molecular weight chlorinated aliphatic compounds: structural and thermodynamic effects on process kinetics. Environ Sci Technol. 2000;34(5):804–811. [Google Scholar]
- 43.Roberts AL, Totten LA, Arnold WA, Burris DR, Campbell TJ. Reductive elimination of chlorinated ethylenes by zero valent metals. Environ Sci Technol. 1996;30(8):2654–2659. [Google Scholar]
- 44.Wust WF, Kober R, Schlicker O, Dahmke A. Combined zero- and first-order kinetic model of the degradation of TCE and cis-DCE with commercial iron. Environ Sci Technol. 1999;33(23):4304–4309. [Google Scholar]
- 45.Schrier CG, Reinhard M. Transformation of chlorinated organic-compounds by iron and manganese powders in buffered water and in landfill leachate. Chemosphere. 1994;29(8):1743–1753. [Google Scholar]
- 46.Kisiel Z, Pszczolkowski L. Assignment and analysis of the mm-wave rotational spectrum of trichloroethylene: observation of a new, extended R-band and an overview of high -J, R-type bands. J Mol Spectrosc. 1996;178(1):125–137. [Google Scholar]
Associated Data
This section collects any data citations, data availability statements, or supplementary materials included in this article.