

Abstract
PD-1 usually acts as a negative signal for T cell activation, and its expression on CD8+Foxp3+ T cells is required for their suppressive capacity. Here we show that PD-1 signalling is required for the maintenance of functional regulatory CD4+CD25+Foxp3+T cells (CD4+Treg) that can control autoimmunity in (New Zealand Black × New Zealand White) F1 (BWF1) lupus mice. PD-1 signalling induced resistance to apoptosis and prolonged the survival of CD4+Treg. In vivo, the blockade of PD-1 with a neutralizing antibody (Ab) reduced PD-1 expression on CD4+Treg (PD1loCD4+Treg). PD1loCD4+Treg had an increased ability to promote B cell apoptosis and to suppress CD4+ helper T cells (Th) as compared to CD4+Treg with elevated PD-1 expression (PD1hiCD4+Treg). When PD-1 expression on CD4+Treg was blocked in vitro, PD1loCD4+Treg suppressed B cell production of IgG and anti-dsDNA Ab. Finally, in vitro studies showed that the suppressive capacity of CD4+Treg depended on PD-1 expression, and that a fine tuning of the expression of this molecule directly affected cell survival and immune suppression. These results indicate that PD-1 expression has multiple effects on different immune cells that directly contribute to a modulation of autoimmune responses.
Introduction
In SLE, uncontrolled lymphocyte autoreactivity is a result of a breach of tolerance to self. In the BWF1 lupus murine model, protection from clinical disease is influenced significantly by both CD4+CD25+Foxp3+ regulatory T cells (CD4+Treg) and inhibitory CD8+CD28- Foxp3+ T cells (CD8+Ti) that suppress autoantibody (autoAb) production (1, 2).
Here we explore the influence of the programmed cell death-1-programmed death-1 ligand (PD-1/PD-L1) pathway in CD4+Treg of BWF1 mice that are predisposed to the development of lupus-like disease.
PD-l/PD-L1 is one of the costimulatory pathways that regulate the balance between stimulatory and inhibitory signals for self-tolerance (3). In particular, PD-1 plays an important role in maintaining T-cell tolerance by maintaining the unresponsiveness of effector T cells (Teff) (4). Different mechanisms involving PD-1/PD-L1 signaling are in place to induce and maintain tolerance at different sites, at different times, and within different T-cell populations, including CD4+Treg. PD-1 signaling in CD4+Treg may play a role in affecting their function so that CD4+Treg can restrain the numbers of Ag-reactive Teff that accumulate in response to an immunogenic stimulus (5). PD-1 signaling counteracts the downstream activation biochemical cascade after activation via TCRs in Teff. This signaling also slows cell trafficking of circulating CD4+Treg. However, inhibition of PD-1 in CD4+Treg may have different outcomes, depending on the Ag-stimulation in their target Teff.
We previously showed that the induction of immune tolerance following administration of the Ig-related peptide pConsensus (pCons) in BWF1 mice induced two suppressive T cell populations, CD4+CD25+Foxp3+ and CD8+Foxp3+ Treg The CD8+Treg had reduced expression of PD-1 as compared to untreated controls (2). In addition, blockade of PD-1 in vivo protected young BWF1 mice from developing lupus-like disease, due in part to an increase in the suppressive activities of CD8+ T cells (6), suggesting that PD-1 favored the emergence of inhibitory CD8+ T cells. Since CD8+ T cells are targets of CD4+Treg-mediated suppression but also influence the activity of CD4+Treg, it is relevant to understand the role of PD-1 expression in the regulatory activity of CD4+Treg, i.e., in their ability to suppress CD4+CD25- helper T cells (Th) and B cells.
Here we report that, in contrast to naïve BWF1 mice in which the percentage of CD4+Treg declines over time, anti-PD-1 treatment in vivo preserves functional suppressive Foxp3+CD4+CD25+ T cells for several weeks. PD-1 expression is inversely correlated with Foxp3 expression in CD4+Treg, and the expression of low levels of PD-1 on CD4+Treg promotes their regulatory capacity. PD1loCD4+T (compared to PD1hiCD4+Treg) had increased TGF-β production and were resistant to apoptosis. A moderate reduction of PD-1 expression in CD4+Treg allowed the CD4+Treg to induce B cell apoptosis and to suppress Th proliferation, while very low levels of PD-1 expression resulted in a loss of the regulatory capacity of CD4+Treg. These data suggest that PD-1 expression modulates the suppressive function of CD4+Treg in a quantitative manner, and that an effective function of CD4+Treg depends on low, but not absent, expression of PD-1.
Materials and Methods
Mice
NZB (H-2d/d), NZW (H-2z/z) and NZB/W F1 (H-2d/z) (BWF1) mice and C57BL/6 (B6) mice were purchased from the Jackson Laboratories (Bar Harbor, ME). Mice were treated in accordance with the guidelines of the UCLA Animal Research Committee, an institution accredited by the Association for Assessment and Accreditation of Laboratory Animal Care (AAALAC). All experiments were conducted in female mice.
Antibody (Ab) treatment
10 week-old mice were treated with intraperitoneal injections of 100 μg of anti-PD-1 Ab (Clone J34, Armenian hamster, eBioscience, San Diego, CA), or 100 μg of control isotype-matched IgG (Clone 2Bio299Arm, Armenian hamster, eBioscience), every other day for total of three injections. The anti-PD-1 Ab inhibits the binding of PD-1 by PD-L1 on cells as tested by the manufacturer, but it does not induce either apoptosis or stimulation in cells that express PD-1.
Cell isolation and staining
One week after mAb administration, blood was obtained from the retroorbital vein. After lysis of red blood cells with ACK lysing buffer (Sigma, St. Louis, MO), PBMC were centrifuged, washed and resuspended in PBS for flow cytometry analysis. For splenocytes, single cell suspensions of splenocytes were prepared by passing cells through a sterile wire mesh before resuspension in HL-1 medium (BioWhittaker, Walkersville, MD). In experiments involving whole cell populations, CD4+ and B cells were isolated by positive selection via magnetic bead separation (anti-L3T4 and anti-CD19 respectively, Miltenyi Biotec, Auburn, CA), and CD4+CD25+, CD4+CD25- cells were separated by selection with beads prior to anti-L3T4+ cell isolation using biotnylated-anti-CD25 followed by anti-biotin beads on an AutoMACS® System (Miltenyi). Populations were >95% pure by subsequent FACS analysis.
FACS analysis
Phenotypic analysis of splenocytes and PBMCs from the mice was performed with a FACSCalibur™ flow cytometer (BD Biosciences, San Jose, CA) using CellQuest (BD Biosciences). Staining with multiple combinations of Ab (indicated in the pertinent sections) was performed according to standard procedures described elsewhere (2). The Abs used were purchased from eBioscience and BD Biosciences. FACS analysis was performed by Flowjo (Tree Star, Inc., Ashland, OR).
Intracellular Staining
For intracellular staining, cells were first stained for expression of cell surface markers and then fixed, permeabilized, and stained using the Cyto-fix/cytoperm kit (eBioscience) according to manufacturer's instructions. Intracellular cytokines (Foxp3) were identified in cells that had been fixed and permeabilized by staining with the appropriate Abs. Intracellular staining was performed using Abs obtained from eBioscience and Biolegend.
Cell Cultures
Methods have been described previously (2, 7). In brief, purified CD4+CD25- Th from 16-week old, unmanipulated BWF1 females, and CD19+ B cells from older unmanipulated BWF1 females with high titers of anti-DNA in serum, were cultured with syngeneic CD4+CD25+ T cells (CD4+Treg hereafter) from control or treated mice in 96-well microtiter plates. With 5 × 10⁴ CD4+Treg in each plate, CD4+Treg were cocultured with Th and B cells at a ratio of 10:10:1, at 37° C in complete medium containing antibiotics and 10% fetal calf serum for 72 hours. We previously determined that these are optimal ratios to detect suppression of Th and of B (2). Unless otherwise stated, mouse anti-CD3 (10 μg/ml) and anti-CD28 (2 μg/ml) mAb were added to cultures at the start of incubation to activate CD4+ T cells. Supernatants were collected after 72 hours of incubation, and used for measurements of cytokines and anti-dsDNA antibodies by standard ELISA. Cells were analyzed for cell proliferation (see below).
Detection of apoptosis
Splenocytes were resuspended in apoptosis buffer (BD Biosciences), according to the manufacturer's instructions, and incubated with 7-aminoactinomycin D (7-AAD) and PE-conjugated Annexin V (eBioscience) for 15 min at room temperature. The percentage of Annexin+7AAD– cells was determined by flow cytometry.
Measurement of cell proliferation
Splenocytes were isolated from BWF1 mice at age 25 weeks for culture in vitro as described above. CD4+CD25- Th were incubated for 10 minutes at 37°C with 5uM CFSE (Invitrogen, Grand Island, NY). Cells were washed with medium containing 10% FBS, cocultured with CD19+ B cells and activated CD4+CD25+ Treg for 3 days, followed by staining with CD4-PerCP Ab (eBioscience). Cell proliferation of Th was measured by flow cytometry analyzed by Flowjo, which was expressed as division index (the average number of cell divisions that the responding cells underwent) calculated by the software.
Measurement of anti-DNA and cytokines in supernatants of cell cultures
IgG anti-DNA was measured in the supernatant of cultured spleen cells and PBMC, and in serum using BD OptEIA Enzyme-linked immunosorbent assay (ELISA) kits (BD Biosciences), with the mean absorbance read at 410/490 nm. Cytokine measurement was done using commercial ELISA kits (eBioscience and Biolegend).
Statistical analyses
Statistical analyses were performed using Prism 4 software (GraphPad, San Diego, CA). Comparisons between two groups were performed by the two-tailed t-test. Tests between more than two groups were performed by one-way analysis of variance (ANOVA). In cases where repeated measures were assessed, two-way ANOVA and mixed effects ANOVA models were used. Tukey's multiple comparison test (one-way ANOVA) and Bonferroni posttest (two-way ANOVA) were used in post-hoc testing between pairs of groups. p values < 0.05 were considered significant. Our papers on CD4+Treg in the BWF1 mouse model in the past used 6 mice in each group for in vitro experiments yielding statistically significant data (2, 6). With the sample size of 6 mice in each group, the minimally detectable (with 80% power) effect size (difference in means divided by the standard deviation) is 1.33 assuming a two group t-test with a 0.05 two-sided significance level. The magnitude of the minimally detectable effect was smaller than that observed in the pilot studies, suggesting that this sample size was sufficient.
Results
PD-1 blockade in vivo promotes the generation of adaptive regulatory CD4+CD25+ T cells
CD4+Treg play an important role in maintaining immune tolerance in BWF1 mice (8). Here we studied the influence of PD-1 expression in CD4+Treg by using PD-1 blockade in vivo with a neutralizing Ab against PD-1, starting when BWF1 and B6 mice were 10 weeks old.
In IgG isotype-treated control BWF1 mice, the percentage of CD4+Treg in PBMC decreased markedly over time. In contrast, mice with anti-PD-1 treatment maintained the percentage of CD4+Treg between 10 and 20 weeks of age (Fig. 1A, p < 0.01). Fewer CD4+Treg from BWF1 mice with anti-PD-1 treatment expressed PD-1 when compared to controls (Fig. 1B, p < 0.01), with a significantly decreased PD-1 expression measured by MFI (Fig. 1D, p < 0.01). We refer thereafter to the PD1+CD4+Treg derived from (in vivo) anti-PD-1 treated mice as PD1loCD4+Treg, and those from IgG isotype controls as PD1hiCD4+Treg (Fig. 1E). B6 mice were similar to BWF1 mice in that as the IgG-treated control mice aged, the percentage of CD4+Treg decreased (Fig. 1A, p < 0.001), and in vivo PD-1 blockade reduced the decreased percentage of CD4+Treg. On the other hand, PD-1-expressing CD4+Treg in control B6 mice were significantly increased when compared to anti-PD-1 Ab-treated mice (Fig. 1C, p < 0.004).
Fig 1. PD-1 blockade in vivo was associated with increased Foxp3 expression and decreased PD-1 expression in CD4+CD25+ T cells.
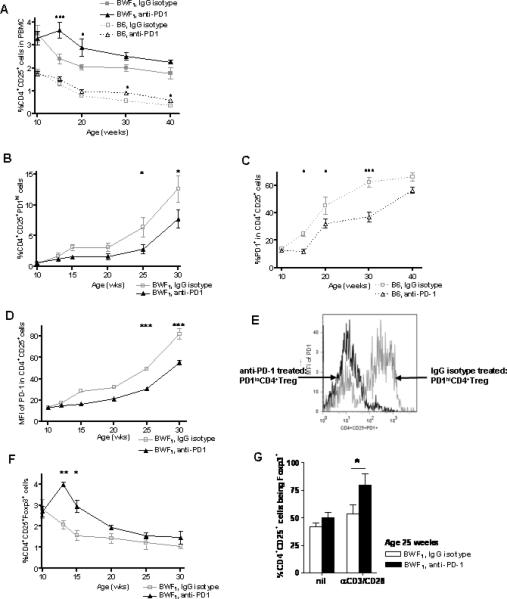
(A) PD-1 blockade attenuated the decrease in percentage of CD4+CD25+ cells with age. At a young age (10 week old) of BWF1 and B6 mice, in vivo PD-1 blockade maintained the percent of CD4+Treg at a higher level than in control mice (BWF1 and B6, p < 0.01, two-way ANOVA). (B) Percentage of PD-1hi CD4+CD25+ cells went up with age in BWF1 mice, but anti-PD-1 treated mice expressed fewer PD1hiCD4+Treg when compared to control mice. (C) Fewer cells expressed PD-1 in B6 compared to BWF1 mice. (D) MFI for PD-1 expression in CD4+CD25+ cells was higher in BWF1 mice treated with anti-PD-1 in vivo than in mice treated with IgG isotype (Fig. 1 A-D, p < 0.01, two-way ANOVA). (E) Representative histogram of the MFI for PD-1 in CD4+CD25+PD1+ cells from an anti-PD1-treated BWF1 mouse vs. an IgG isotype-treated control (at age 16 weeks) showing that PD-1 expression was reduced by treatment with anti-PD-1 Ab. We referred hereafter to the PD1+CD4+Treg derived from (in vivo) anti-PD-1 treated mice as PD1loCD4+Treg, and those from IgG isotype controls as PD1hiCD4+Treg. (F) Expression of Foxp3 in CD4+CD25+ cells went down with age in BWF1 mice, but anti-PD-1 treated mice had a higher Foxp3 expression than control mice until after age 15 weeks (Fig. 1F, p < 0.01, two-way ANOVA). (G) There was significant increase in the percent of CD4+CD25+Foxp3+Treg from mouse spleens at age 22 weeks after in vivo PD-1 blockade upon stimulation of TCR (p <0.05, unpaired student t-test). * p <0.05, ** p <0.01 (Bonferroni posttest). B6, n = 6 mice per group, BWF1, n = 14 mice per group.
Among the CD4+Treg, there was increased Foxp3 expression within 3 weeks in BWF1 mice after treatment with anti-PD-1 Ab (Fig. 1F, p < 0.01). These CD4+CD25+Foxp3+ cells were Helios-, suggesting that they are adaptive regulatory T cells. Foxp3 expression was inversely related to PD1 expression in CD4+Treg; as mice aged, Foxp3 expression decreased as the level of PD-1 rose (Fig. 1B, 1F). At the age of 25 weeks, when CD4+Treg from anti-PD-1 treated mice had significantly less PD-1 expression compared to Ig-treated controls, a higher percentage of stimulated PD1loCD4+Treg expressed Foxp3 (Fig. 1G, p < 0.05).
Taken together, these data suggest that in unmanipulated B6 and BWF1 mice, PD-1 expression in CD4+Treg increases with age. Also, Foxp3 expression is inversely related to the expression of PD-1 in the CD4+Treg.
Altered PD-1 signaling in vivo increases the regulatory capacity of CD4+Treg in BWF1 mice
Decreased apoptosis in Teff and B cells has been linked to clinical autoimmunity, and CD4+Treg can induce apoptosis in Th or B cells. Here we examined the role of CD4+Treg in regulating the susceptibility of their target cells to apoptosis, when CD4+Treg from mice treated in vivo with anti-PD-1 were cocultured with Th and B cells.
PD1loCD4+Treg were resistant to apoptosis as compared to PD1hiCD4+Treg (Fig. 2A, 2B, p < 0.05). In contrast, syngeneic B cells in coculture with PD1loCD4+Treg had increased apoptosis (Fig. 2C, p < 0.001, Fig. 2D, p < 0.05). Similarly, co-culturing with PD1loCD4+Treg followed by activation of Th increased apoptosis and limited cell proliferation (Fig. 2E, 2F, p < 0.001).
Fig 2. Inhibition of PD-1 in vivo increased the regulatory capacity of BWF1 CD4+Treg in different spleen cell subsets.
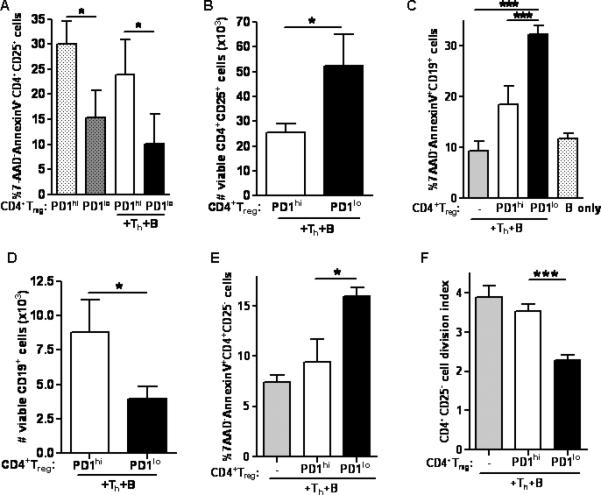
(A) Apoptosis in PD1loCD4+Treg was significantly less compared to PD1hiCD4+Treg, whether or not cultures contained Th and B cells (p < 0.05, unpaired student t-test). (B) PD1loCD4+Treg were viable and were increased in numbers compared to PD1hiCD4+Treg (p < 0.05, unpaired student t-test). (C) PD1loCD4+Treg induced more apoptosis in CD19+ B cells than did PD1hiCD4+Treg. (D) Numbers of viable B cells were decreased in cultures containing PD1loCD4+Treg compared to those with PD1hiCD4+Treg (p < 0.05, unpaired student t-test). (E) PD1loCD4+Treg induced more apoptosis in CD4+CD25-T cells than did PD1hiCD4+Treg. (F) PD1loCD4+Treg suppressed proliferation of CD4+CD25-syngeneic T cells as detected by CFSE (Fig. 2C, 2E, 2F, p < 0.001, one-way ANOVA). *p < 0.05, **p < 0.01, ***p < 0.001 (Tukey's test). Data are representative of 2 individual experiments, n = 6 mice per group in each experiment.
The tolerogenic effect of PD-1 blockade on CD4+Treg is dose-dependent
CD4+Treg from spleens of 20 week old IgG isotype-treated or anti-PD-1-treated BWF1 mice were cultured with 0, 25, 50, 75 and 100 μg/ml of anti-PD-1 in vitro for 72 hours. Treatment of PD1lo and PD1hi CD4+Treg with anti-PD-1 in vitro decreased the surface expression of PD-1 (Fig. 3A).
Fig 3. Effects of PD-1 blockade on the suppressive function of CD4+Treg depends on the concentration of anti-PD-1 Ab to which the CD4+Treg are exposed.

CD4+Treg were obtained from BWF1 mice treated with anti-PD-1 Ab in vivo (PD1loCD4+Treg, black solid line), or isotype IgG (PD1hiCD4+Treg, gray dashed line). PD-1 blockade of these CD4+Treg was tested by pretreatment of harvested splenic CD4+Treg in vitro with different concentrations of anti-PD-1 Ab, followed by coculture of washed CD4+Treg with syngeneic Th and B cells. (A) Representative dot plot of CD4+Treg from an IgG isotype control mouse before and after treatment with anti-PD-1 Ab at 75 μg/ml. Note that in Fig. 3B-E, at pretreatment of CD4+Treg with zero anti-PD-1 Ab, there were expected differences between PD1hiCD4+Treg compared to PD1loCD4+Treg. The addition of low concentrations of anti-PD-1 Ab in vitro induced (B) increased resistance of CD4+Treg to apoptosis, (C) increased the ability of CD4+Treg to suppress proliferation of Th (D) increased the ability of CD4+Treg to induce B cell apoptosis, and (E) increased the ability of CD4+Treg to suppress IgG production. In general, these effects of in vitro anti-PD-1 Ab pretreatment on PD1loCD4+Treg were not detectable at anti-PD-1 Ab concentrations >50 μg/ml. In contrast, the effects of in vitro anti-PD-1 on PD1hiCD4+Treg were seen at both low and high concentrations, up to anti-PD-1 Ab concentration > 75 μg/ml (Fig. 3B, PD1hi versus PD1lo CD4+Treg, p < 0.02, anti-PD-1 concentration, p < 0.005; Fig. 3C-E, anti-PD-1 concentration, p < 0.05, interaction, p <0.005, two-way ANOVA). *p < 0.05, **p < 0.01 (Bonferroni posttest). Data are representative of 2 individual experiments, n = 5 mice per group in each experiment.
As shown in Fig 2, PD1loCD4+Treg, compared to PD1hiCD4+Treg, were resistant to apoptosis, and they were more effective in suppressing Th proliferation and in inducing B cell apoptosis. In Fig. 3B, with the addition of anti-PD-1 Ab in vitro, CD4+Treg from both groups of mice were more resistant to apoptosis than without anti-PD-1 Ab (p < 0.05), but the percentage of apoptotic CD4+Treg levelled off in both groups at about 15%. PD1loCD4+Treg apoptosis levelled off at a lower concentration of in vitro anti-PD-1 Ab (50 μg/ml) than that of PD1hiCD4+Treg (75 μg/ml). This observation suggests that PD-1 blockade at a moderate level helps to maintain the survival of CD4+Treg, but protection from apoptosis plateaus at higher concentrations of PD-1 blockade. Incidentally, the higher concentrations of anti-PD-1 did not cause cell death of CD4+Treg directly, as tested by cell staining with trypan blue (not shown), and there was no evidence for CD4+Treg stimulation at any concentration measured as cell division index by CFSE (not shown).
Next, we looked at the relationship between the concentration of anti-PD-1 Ab and the suppressive capacity of CD4+Treg. PD1hiCD4+Treg required anti-PD-1 Ab to improve their suppressive effect. At an anti-PD-1 Ab concentration ≤ 50 μg/ml, PD1loCD4+Treg were resistant to apoptosis and suppressed Th proliferation (Fig. 3B, 3C), induced B cell apoptosis (Fig. 3D) and reduced IgG production by B cells (Fig. 3E). However, PD1loCD4+Treg began to lose their suppressive function with anti-PD-1 Ab at >50 μg/ml, which was associated with increased Th cell division, decreased B cell apoptosis and increased IgG production. PD1hiCD4+Treg manifested enhanced regulatory effects in vitro with anti-PD-1 Ab up to 75 μg/ml, and this effect levelled off or was diminished when anti-PD-1 Ab concentration was >75 μg/ml. An explanation for the difference in the suppressive capacity between PD1loCD4+Treg and PD-1hiCD4+Treg is that lower PD-1 expression in CD4+Treg promotes suppression (see comparison of baseline numbers in Figs. 3 B-E). However, in the case of PD1loCD4+Treg with PD-1 blockade in vitro, CD4+Treg with very low or near absent PD-1 expression can lose their suppressive capacity. Thus, the degree of PD-1 blockade can be important in maintaining viability and function of CD4+Treg.
PD-1 blockade preserves regulatory function of CD4+Treg in vitro
We reported that in mice treated with anti-PD-1 in vivo, serum levels of IFN-γ (primarily from Th), total IgG, and IgG anti-dsDNA (from B cells) were significantly decreased (9). If suppression results in anergy, Th may have lower proliferation or decreased production of IFN-γ, and B cells may have lower Ig and/or proinflammatory cytokine production. To examine the direct effect of anti-PD-1 on CD4+Treg, we treated 22-week old unmanipulated BWF1 splenic CD4+Treg with 75 μg/ml of anti-PD-1 Ab (to generate PD1loCD4+Treg), or matched Ig isotype (to generate PD1hiCD4+Treg) for 24 hrs followed by washing, before coculturing with unmanipulated syngeneic Th and B cells, and assessed the production of autoAb in vitro. Significantly less IFN-γ, IL-6 and IL-10 were produced in the cocultures containing PD1loCD4+Treg as compared to PD1hiCD4+Treg, whether CD4+Treg were alone or stimulated and with Th plus B (Fig. 4A-C, p < 0.001). Total IgG and anti-DNA Ab production were significantly decreased in the supernatants of cultures containing PD1loCD4+Treg (Fig. 4D, 4E, p < 0.001).
Fig 4. Reduction of proinflammatory cytokine and autoAb production in co-cultures with syngeneic CD4+CD25- Th and B cells.
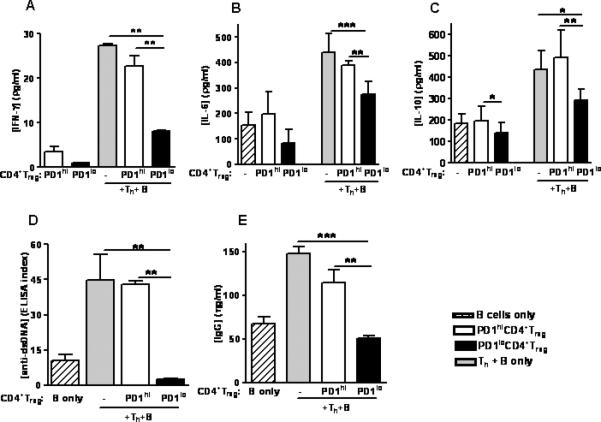
PD1loCD4+Treg added to cultures were induced by adding anti-PD-1 Ab in vitro to CD4+CD25+ T cells from unmanipulated mice. CD4+Treg from 22 week-old unmanipulated BWF1 mice (PD1hi CD4+Treg) were treated with anti-PD-1 Ab at 75 μg/ml for 24 hours to generate PD1loCD4+Treg, followed by washing with PBS, then cocultured for 48 hours with Th and B cells from unmanipulated syngeneic mice. PD1lo CD4+Treg decreased the production of (A) IFN-γ, (B) IL-6, (C) IL-10, (D) anti-DNA and (E) IgG (Fig. 4A-E, p < 0.001, one-way ANOVA). PD1hiCD4+Treg and B cells alone from these mice were used as controls. * p < 0.05, ** p < 0.01, *** p < 0.001 (Tukey's test). Data are representative of 3 individual experiments, n = 5 mice per group in each experiment.
PD-1 blockade increased IL-2 expression to induce the expansion of CD4+Treg
Low concentrations of IL-2 are required for maintaining the suppressive capacity of CD4+Treg (10), but high levels of IL-2 reverse it (10, 11). PD-1-mediated signals generally inhibit IL-2 production, and the addition of IL-2 restores the responses (12-14). We previously reported that the decline in serum levels of IL-2, which is characteristic of BWF1 mice with aging, occurred significantly later in mice treated with anti-PD-1 Ab (9), and IL-2 could overcome PD-1-mediated inhibition if CD4+Treg can produce IL-2 en route to tolerance. Here we found that even though the percentage of IL-2+CD4+CD25- T cells declined as animals aged, numbers were sustained in anti-PD-1 treated mice at 30 weeks of age (data not shown). Moreover, CD4+Treg from 22-week old unmanipulated mice were cultured in vitro with 75 μg/ml anti-PD-1 Ab to generate PD1loCD4+Treg, followed by neutralizing anti-IL-2 mAb, washed and cocultured with unmanipulated, syngeneic Th and B cells. As reported in Figs. 3 and 4, PD1loCD4+Treg suppressed Th proliferation and IgG production in coculture but after treatment with anti-IL-2 Ab, their suppressive effect was abrogated (Supplemental Fig. S1). Next, we repeated the experiment by pre-treating PD1loCD4+Treg with IL-2 prior to coculture. Interestingly, while the suppressive function of PD1loCD4+Treg on Th proliferation and IgG production was preserved with the addition of IL-2 at 5 U/ml, suppression was lost at 20 U/ml (data not shown). These data suggest that the demand for IL-2 in CD4+Treg is altered upon PD-1 blockade.
The suppressive effect of CD4+Treg induced by anti-PD-1 depends on TGF-ß but not IL-6
Our previous work showed that serum TGF-ß levels were increased in anti-PD-1-treated BWF1 mice when compared to IgG isotype controls (9), and that the upregulation of Foxp3 expression in CD4+Treg depended on their TGF-ß production (2). To test whether the suppressive effect of PD-1 on CD4+Treg was dependent on TGF-ß, we repeated the in vitro coculture experiment setup described in Fig 4, with PD1loCD4+Treg exposed to a blocking Ab against TGF-β in vitro prior to coculture with Th and B cells.
In the presence of antagonistic anti-TGF-β Ab, PD1loCD4+Treg decreased their Foxp3 expression, increased their PD-1 expression and increased apoptosis (Fig. 5A-C, p< 0.001). The ability of PD1loCD4+Treg to suppress IL-6, IL-10 and IgG production was lost (Fig. 5D-F, p < 0.001).
Fig 5. TGF-β was necessary to maintain the suppressive capacity of PD1loCD4+Treg generated by in vitro treatment of CD4+CD25+ T cells.
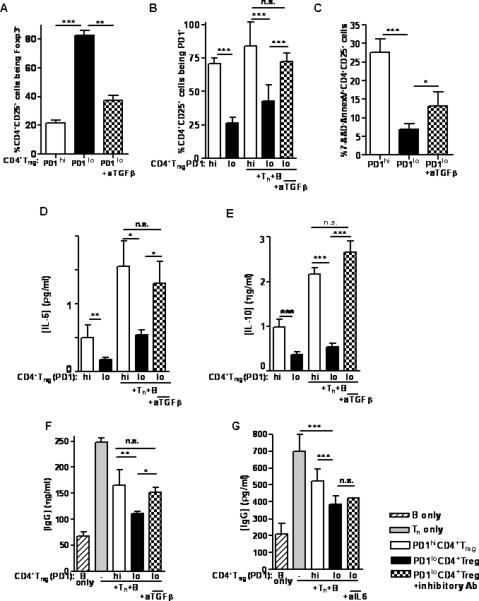
CD4+Treg from 22 week-old unmanipulated BWF1 mice (PD1hiCD4+Treg) were treated in vitro with anti-PD-1 Ab at 75 μg/ml for 24 hours (generating PD1loCD4+Treg), then washed, cultured with neutralizing anti-TGF-β mAb (or control mAb) at 5 mg/ml for 12 hours, then washed, and finally cocultured for 48 hours with syngeneic Th and B cells from unmanipulated mice. The regulatory function attained in PD1loCD4+Treg was abrogated when these CD4+Treg were pretreated with anti-TGF-β. Anti-TGF-β (A) decreased Foxp3 expression, (B) increased PD-1 expression and (C) increased apoptosis in CD4+Treg (Fig. 5 A-C, p < 0.0001, one-way ANOVA). In the supernatant of the coculture, there was increased production of (D) IL-6, (E) IL-10, and (F) IgG (Fig. 5D, 5F, p < 0.001; Fig. 5E, p < 0.0001, one-way ANOVA). (G) The role of IL-6 in the suppressive function of PD1loCD4+Treg was tested by repeating the same setup, but treating PD1loCD4+Treg with an inhibitory IL-6 Ab in vitro. The ability to suppress IgG production was unaffected in these PD1loCD4+Treg (n.s., one-way ANOVA). *p < 0.05; **p < 0.01; ***p < 0.001 (Tukey's test). Data are representative of 2 individual experiments, n = 6 mice per group in each experiment.
It has been shown that IL-6 can abrogate the suppressive effect of CD4+Treg in a DC-dependent manner (15-17). When combined with TGF-β, IL-6 can stimulate Th17 differentiation from naïve CD4+ T cells, whereas IL-6 inhibits the generation of CD4+Treg induced by TGF-β (18, 19). We blocked IL-6 with an inhibitory Ab in vitro similar to our testing of TGF-β. The suppressive effect of PD1loCD4+Treg on IgG production was not significantly affected by IL-6 blockade (Fig. 5G).
In vivo blockade of PD-1 in autoAb-producing BWF1 mice delayed disease progression
We previously reported that in vivo blockade of PD-1 in young BWF1 mice significantly delayed appearance of autoAbs and proteinuria, and prolonged survival (9). To understand whether downregulation of PD-1 after the onset of disease can facilitate CD4+Treg in diseased mice, we exposed BWF1 to neutralizing anti-PD-1 Ab at the age of 22 weeks, when mice have circulating autoAbs (such as anti-dsDNA Ab and high total IgG) and mild proteinuria <2+ by urinary dipstick (9). Age-matched unmanipulated animals were compared to mice treated with anti-PD-1 or control IgG isotype Ab for the development of proteinuria and for survival. Interestingly, mice with “late” anti-PD-1 treatment had delayed onset of proteinuria (Fig. 6A, p< 0.0001) and improved survival (Fig. 6B, p < 0.0001) compared to control mice, but the delay was less than in mice treated early before disease was manifest clinically. These data suggest that PD-1 blockade favors a delay in disease progression during early stages of active disease but less so when the disease has already advanced.
Fig 6. Comparison of clinical results of in vivo treatment of BWF1 mice with PD-1 blockade before and after onset of autoAb production.
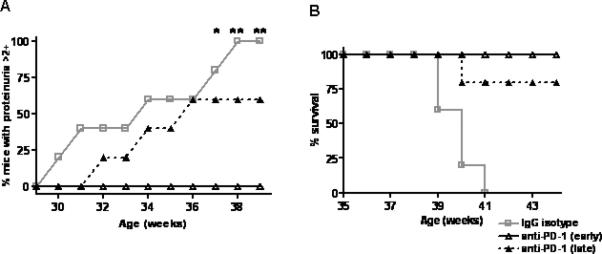
BWF1 mice at age 22 weeks (defined as “late” treatment in the legend) that had anti-dsDNA Ab, but proteinuria <2+ on urinary dipstick, were treated with 3 intraperitoneal injections of anti-PD-1 Ab at 100 μg per injection every other day. (A) Proteinuria over time in all treatment groups (“early” group was treated with anti-PD1 at 10 weeks of age). Onset of proteinuria was delayed in mice treated either early or late, although early treatment had a better effect. Controls were mice with late treatment with IgG matched to anti-PD1. (p < 0.0001, logrank test; anti-PD-1 (late) vs IgG isotype, anti-PD-1 (early) vs IgG isotype, anti-PD-1 (late) vs, anti-PD-1 (early), p < 0.01, Bonferroni method). (B) Mice with early and late treatment had prolonged survival when compared with the IgG isotype controls, (p < 0.0001, logrank test; anti-PD-1 (late) vs IgG isotype, anti-PD-1 (early) vs IgG isotype, p < 0.001, anti-PD-1 (late) vs anti-PD-1 (early), n.s., Bonferroni method). n = 20 mice per group in each experiment.
Discussion
This manuscript shows that PD-1 signalling promotes survival and function of adaptive CD4+Treg in this model of murine lupus.
The levels of expression of PD-1 are important in regulating the function of CD4+Treg. CD4+Treg suppress Th and autoAb-producing B cells when PD-1 expression is intact and neither too high nor too low, and different levels of expression or engagement of PD-1 can cause different immune responses in CD4+Treg.
PD-1/PD-L1 interactions downregulate T cell activation under some circumstances, and PD-1 or PD-L1 expression on peripheral tissues and T cells can be crucial to protect from autoimmunity (20, 21). Experiments from different autoimmune disease mouse models (22-24) and immune-driven conditions (25) have shown enhanced severity and/or disease onset upon disruption of the PD-1/PD-L interaction. Despite this finding, few studies have examined the role of PD-1 during early activation of naïve T cells or during the development of T-cell tolerance (26). Our data show that effector CD4+ T cells targeted by PD1loCD4+Treg were impaired in their ability to proliferate and to produce cytokines, and they were more susceptible to apoptosis when compared to similar cells from naïve age-matched BWF1 females. It is acknowledged that the changes in cytokine levels in co-culture supernatants cannot only be attributed to CD4+Treg, yet blockade of PD-1 promoted CD4+Treg function. Adaptive CD4+Treg with low levels of PD-1 in BWF1 mice had higher Foxp3 expression and increased suppressive capacity in vitro (27), and blocking PD-1 expanded CD4+Treg. Also, the phenotype of CD4+CD25+Foxp3+Helios- suggested that PD-1loCD4+Treg are adaptive regulatory T cells generated in the periphery. Our findings are consistent with those by with Sharpe et al. that showed that PD-L1 synergizes with TGF-β in promoting conversion of naïve CD4+ T cells into Foxp3+CD4+Treg (28), since TGF-β antagonistic Ab abrogated the generation of PD1+Foxp3+CD4+Treg and blunted suppression of autoAb production.
In regard to IL-10, this cytokine can stimulate B-cell proliferation and enhance the production of anti-dsDNA Ab and immune complexes which, in turn, induce IL-10 production (29, 30). Since PD-1 and PD-L1 induce IL-10 production (31), one of the mechanisms of how blockade of PD-1 decreases anti-dsDNA production and immune complex formation our model could be by reducing IL-10 production in CD4+Treg and B cells.
IL-2 could play a role in tolerance by expanding suppressive CD4+Treg and by protecting CD4+Treg from apoptosis. The downregulation of PD-1 upregulated Foxp3 expression in CD4+Treg, possibly by interacting with NFAT (NFATc1 is a critical factor for PD-1 induction in T cells (32)), and repressed the induction of IL-2. With the PD-1 signal already attenuated by the blocking Ab, IL-2 stimulation might override PD-1-mediated inhibition and render effector cells refractory to CD4+Treg suppression (yet the fact that manipulation of IL-2 in vitro may affect Th proliferation makes it difficult to attribute those observations only to changes in CD4+Treg function).
It seems unexpected that blockade of the PD-1 molecule promotes regulatory T cell activities, when PD-1 is under most conditions a co-inhibitory receptor on T cells. It is our hypothesis that variance in quantities of PD-1 and/or strength of signalling and/or degree of ligation of PD-1 cause different effects on the functions of CD4+Treg. However, it is possible that the mAb used in our experiments to block PD-1 has agonistic activity in the induction of CD4+Treg. Another possible explanation is that the costimulatory network of the PD-1 signalling pathway is complicated by the presence of additional receptors for PD-L1 and PDL2 that can deliver costimulatory signals (33, 34). The bidirectional signalling pathways make PD-L1 both a receptor and ligand, so that it can induce both stimulatory and inhibitory signals based on the circumstances. In the cancer model, PD-1 can deliver a reverse signal through PD-L1 to induce an anti-apoptotic effect (35). PD-L1 can engage B7-1 to deliver an inhibitory signal to T cells, and induce T cell suppression in vitro and T cell tolerance in vivo (36, 37). In our study, we suspect that the probable ablation of PD-1/PD-L1 interaction by blocking PD-1 receptor directs PD-L-1 to bind B7-1, and promotes positive costimulatory signalling through CD28, which allows increased inhibitory functions of CD4+Treg.
Overall, these data show that low levels of PD-1 expression in CD4+Treg promote their suppressive functions, which are linked to Foxp3 and IL-2 expression and to TGF-β. These results can be relevant for the manipulation of regulatory T cell responses in SLE and related targeted immunotherapy.
Supplementary Material
Acknowledgments
This work was supported by grants from the National Institutes of Health (AR053463 to M.W., AR53239 to A.L.C., and AI46776 to B.H.H.), the Southern California Chapter of the Arthritis Foundation (to M.W.), The American College of Rheumatology (to M.W.), and the Arthritis National Research Foundation (to M.W.)
Abbreviations used in this paper
- SLE
systemic lupus erythematosus
- BWF1
(New Zealand Black × New Zealand White)F1
- PD-1
programmed death-1
- PD-L1
programmed death-1 ligand 1
- Ab
antibody
- mAb
monoclonal antibody
- pCons
pConsensus
- TCR
T cell receptor
- Th
T helper cells
- Ti
suppressive/inhibitory T cells
- Treg
regulatory T cells
References
- 1.Singh RR, Kumar V, Ebling FM, Southwood S, Sette A, Sercarz EE, Hahn BH. T cell determinants from autoantibodies to DNA can upregulate autoimmunity in murine systemic lupus erythematosus. J. Exp. Med. 1995;181:2017–2027. doi: 10.1084/jem.181.6.2017. [DOI] [PMC free article] [PubMed] [Google Scholar]
- 2.La Cava A, Ebling FM, Hahn BH. Ig-reactive CD4+CD25+ T cells from tolerized (New Zealand black X New Zealand white) F1 mice suppress in vitro production of antibodies to DNA. J. Immunol. 2004;173:3542–3548. doi: 10.4049/jimmunol.173.5.3542. [DOI] [PubMed] [Google Scholar]
- 3.Okazaki T, Honjo T. The PD-1-PD-L pathway in immunological tolerance. Trends Immunol. 2006;27:195–201. doi: 10.1016/j.it.2006.02.001. [DOI] [PubMed] [Google Scholar]
- 4.Keir ME, Freeman GJ, Sharpe AH. PD-1 regulates self-reactive CD8+ T cell responses to antigen in lymph nodes and tissues. J. Immunol. 2007;179:5064–5070. doi: 10.4049/jimmunol.179.8.5064. [DOI] [PubMed] [Google Scholar]
- 5.Maznet MM, Hughes CC. B7-H1 is expressed by human endothelial cells and suppresses T cell cytokine synthesis. J. Immunol. 2002;169:3581–3588. doi: 10.4049/jimmunol.169.7.3581. [DOI] [PubMed] [Google Scholar]
- 6.Singh RP, La Cava A, Wong M, Ebling F, Hahn BH. CD8+ T Cell-Mediated Suppression of Autoimmunity in a Murine Lupus Model of Peptide-Induced Immune Tolerance Depends on Foxp3 Expression. J. Immunol. 2007;178:7649–7657. doi: 10.4049/jimmunol.178.12.7649. [DOI] [PubMed] [Google Scholar]
- 7.Hahn BH, Singh RP, La Cava A, Ebling EM. Tolerogenic treatment of lupus mice with consensus peptide induces Foxp3-expressing, apoptosis-resistant, TGFbeta-secreting CD8+ T cell suppressors. J. Immunol. 2005;175:7728–7737. doi: 10.4049/jimmunol.175.11.7728. [DOI] [PubMed] [Google Scholar]
- 8.Iikuni N, Lourenço EV, Hahn BH, La Cava A. Cutting edge: Regulatory T cells directly suppress B cells in systemic lupus erythematosus. J. Immunol. 2009;183:1518–1522. doi: 10.4049/jimmunol.0901163. [DOI] [PMC free article] [PubMed] [Google Scholar]
- 9.Wong M, La Cava A, Singh RP, Hahn BH. Blockade of Programmed Death-1 (PD-1) in young (New Zealand Black x New Zealand White)F1 mice promotes the activity of suppressive CD8+ T cells that protect from lupus-like disease. J. Immunol. 2010;185:6563–6571. doi: 10.4049/jimmunol.0903401. [DOI] [PubMed] [Google Scholar]
- 10.Takahashi T, Tagami T, Yamazaki S, Uede T, Shimizu J, Sakaguchi N, Mak TW, Sakaguchi S. Immunologic self-tolerance maintained by CD25(+)CD4(+) regulatory T cells constitutively expressing cytotoxic T lymphocyte-associated antigen 4. J. Exp. Med. 2000;192:303–310. doi: 10.1084/jem.192.2.303. [DOI] [PMC free article] [PubMed] [Google Scholar]
- 11.Thornton AM, Shevach EM. CD4+CD25+ immunoregulatory T cells suppress polyclonal T cell activation in vitro by inhibiting interleukin 2 production. J. Exp. Med. 1998;188:287–296. doi: 10.1084/jem.188.2.287. [DOI] [PMC free article] [PubMed] [Google Scholar]
- 12.Carter L, Fouser LA, Jussif J, Fitz L, Deng B, Wood CR, Collins M, Honjo T, Freeman GJ, Carreno BM. PD-1:PD-L inhibitory pathway affects both CD4(+) and CD8(+) T cells and is overcome by IL-2. Eur. J. Immunol. 2002;32:634–643. doi: 10.1002/1521-4141(200203)32:3<634::AID-IMMU634>3.0.CO;2-9. [DOI] [PubMed] [Google Scholar]
- 13.Fuse S, Tsai CY, Molloy MJ, Allie SR, Zhang W, Yagita H, Usherwood EJ. Recall responses by helpless memory CD8+ T cells are restricted by the up-regulation of PD-1. J. Immunol. 2009;182:4244–4254. doi: 10.4049/jimmunol.0802041. [DOI] [PMC free article] [PubMed] [Google Scholar]
- 14.Tsushima F, Yao S, Shin T, Flies A, Flies S, Xu H, Tamada K, Pardoll DM, Chen L. Interaction between B7-H1 and PD-1 determines initiation and reversal of T-cell anergy. Blood. 2007;110:180–185. doi: 10.1182/blood-2006-11-060087. [DOI] [PMC free article] [PubMed] [Google Scholar]
- 15.Yamazaki S, Iyoda T, Tarbell K, Olson K, Velinzon K, Inaba K, Steinman RM. Direct expansion of functional CD25+ CD4+ regulatory T cells by antigen-processing dendritic cells. J. Exp. Med. 2003;198:235–247. doi: 10.1084/jem.20030422. [DOI] [PMC free article] [PubMed] [Google Scholar]
- 16.Pasare C, Medzhitov R. Toll pathway-dependent blockade of CD4+CD25+ T cell-mediated suppression by dendritic cells. Science. 2003;299:1033–1036. doi: 10.1126/science.1078231. [DOI] [PubMed] [Google Scholar]
- 17.Kubo T, Hatton RD, Oliver J, Liu X, Elson CO, Weaver CT. Regulatory T cell suppression and anergy are differentially regulated by proinflammatory cytokines produced by TLR-activated dendritic cells. J. Immunol. 2004;173:7249–7258. doi: 10.4049/jimmunol.173.12.7249. [DOI] [PubMed] [Google Scholar]
- 18.Bettelli E, Carrier Y, Gao W, Korn T, Strom TB, Oukka M, Weiner HL, Kuchroo VK. Reciprocal developmental pathways for the generation of pathogenic effector TH17 and regulatory T cells. Nature. 2006;441:235–238. doi: 10.1038/nature04753. [DOI] [PubMed] [Google Scholar]
- 19.Kong N, Lan Q, Chen M, Wang J, Shi W, Horwitz DA, Quesniaux V, Ryffel B, Liu Z, Brand D, et al. Antigen-specific TGF-beta-induced regulatory T cells but not natural Tregs ameliorate autoimmune arthritis by shifting the balance of Th17 toward Treg cells. Arthritis Rheum. 2012;64:2548–2558. doi: 10.1002/art.34513. [DOI] [PMC free article] [PubMed] [Google Scholar]
- 20.Salama AD, Chitnis T, Imitola J, Ansari MJ, Akiba H, Tushima F, Azuma M, Yagita H, Sayegh MH, Khoury SJ. Critical role of the programmed death-1 (PD-1) pathway in regulation of experimental autoimmune encephalomyelitis. J. Exp. Med. 2003;198:71–78. doi: 10.1084/jem.20022119. [DOI] [PMC free article] [PubMed] [Google Scholar]
- 21.Wang L, Han R, Hancock WW. Programmed cell death 1 (PD-1) and its ligand PD-L1 are required for allograft tolerance. Eur. J. Immunol. 2007;37:2983–2990. doi: 10.1002/eji.200737583. [DOI] [PubMed] [Google Scholar]
- 22.Ansari MJ, Salama AD, Chitnis T, Smith RN, Yagita H, Akiba H, Yamazaki T, Azuma M, Iwai H, Khoury SJ, et al. The programmed death-1 (PD-1) pathway regulates autoimmune diabetes in nonobese diabetic (NOD) mice. J. Exp. Med. 2003;198:63–69. doi: 10.1084/jem.20022125. [DOI] [PMC free article] [PubMed] [Google Scholar]
- 23.Keir ME, Butte MJ, Freeman GJ, Sharpe AH. PD-1 and its ligands in tolerance and immunity. Annu. Rev. Immunol. 2008;26:677–704. doi: 10.1146/annurev.immunol.26.021607.090331. [DOI] [PMC free article] [PubMed] [Google Scholar]
- 24.Konkel JE, Frommer F, Leech MD, Yagita H, Waisman A, Anderton SM. PD-1 signalling in CD4(+) T cells restrains their clonal expansion to an immunogenic stimulus, but is not critically required for peptide-induced tolerance. Immunology. 2010;130:92–102. doi: 10.1111/j.1365-2567.2009.03216.x. [DOI] [PMC free article] [PubMed] [Google Scholar]
- 25.Dias P, Giannoni F, Lee L,N, Han D, Yoon S, Yagita H, Azuma M, Sarawar SR. CD4 T-cell help programs a change in CD8 T-cell function enabling effective long-term control of murine gammaherpesvirus 68: role of PD-1-PD-L1 interactions. J. Virol. 2010;84:8241–8249. doi: 10.1128/JVI.00784-10. [DOI] [PMC free article] [PubMed] [Google Scholar]
- 26.Prokunina L, Castillejo-Lopez C, Oberg F, Gunnarsson I, Berg L, Magnusson V, Brookes AJ, Tentler D, Kristjansdottir H, Grondal G, et al. A regulatory polymorphism in PDCD1 is associated with susceptibility to systemic lupus erythematosus in humans. Nat. Genetics. 2002;32:666–669. doi: 10.1038/ng1020. [DOI] [PubMed] [Google Scholar]
- 27.Scalapino KJ, Daikh DI. Suppression of glomerulonephritis in NZB/NZW lupus prone mice by adoptive transfer of ex vivo expanded regulatory T cells. PLoS One. 2009;24:e6031. doi: 10.1371/journal.pone.0006031. [DOI] [PMC free article] [PubMed] [Google Scholar]
- 28.Francisco LM, Salinas VH, Brown KE, Vanguri VK, Freeman GJ, Kuchroo VK, Sharpe AH. PD-L1 regulates the development, maintenance, and function of induced regulatory T cells. J. Exp. Med. 2009;206:3015–3029. doi: 10.1084/jem.20090847. [DOI] [PMC free article] [PubMed] [Google Scholar]
- 29.Rönnelid J, Tejde A, Mathsson L, Nilsson-Ekdahl K, Nilsson B. Immune complexes from SLE sera induce IL10 production from normal peripheral blood mononuclear cells by an FcgammaRII dependent mechanism: implications for a possible vicious cycle maintaining B cell hyperactivity in SLE. Ann Rheum Dis. 2003;62:37–42. doi: 10.1136/ard.62.1.37. [DOI] [PMC free article] [PubMed] [Google Scholar]
- 30.Sun KH, Yu CL, Tang SJ, Sun GH. Monoclonal anti-double-stranded DNA autoantibody stimulates the expression and release of IL-1beta, IL-6, IL-8, IL-10 and T N F-alpha from normal human mononuclear cells involving in the lupus pathogenesis. Immunology. 2000;99:352–360. doi: 10.1046/j.1365-2567.2000.00970.x. [DOI] [PMC free article] [PubMed] [Google Scholar]
- 31.Francisco LM, Sage PT, Sharpe AH. The PD-1 pathway in tolerance and autoimmunity. Immunol Rev. 2010;236:219–242. doi: 10.1111/j.1600-065X.2010.00923.x. [DOI] [PMC free article] [PubMed] [Google Scholar]
- 32.Oestreich KJ, Yoon H, Ahmed R, Boss JM. NFATc1 regulates PD-1 expression upon T cell activation. J Immunol. 2008;181:4832–4839. doi: 10.4049/jimmunol.181.7.4832. [DOI] [PMC free article] [PubMed] [Google Scholar]
- 33.Chen L. Co-inhibitory molecules of the B7-CD28 family in the control of T-cell immunity. Nat Rev Immunol. 2004;4:336–347. doi: 10.1038/nri1349. [DOI] [PubMed] [Google Scholar]
- 34.Zhu Y, Yao S, Chen L. Cell surface signaling molecules in the control of immune responses: A tide model. Immunity. 2011;34:466–478. doi: 10.1016/j.immuni.2011.04.008. [DOI] [PMC free article] [PubMed] [Google Scholar]
- 35.Azuma T, Yao S, Zhu G, Flies AS, Flies SJ, Chen L. B7-H1 is a ubiquitous antiapoptotic receptor on cancer cells. Blood. 2008;111:3635–3643. doi: 10.1182/blood-2007-11-123141. [DOI] [PMC free article] [PubMed] [Google Scholar]
- 36.Butte MJ, Keir ME, Phamduy TB, Sharpe AH, Freeman GJ. Programmed death-1 ligand 1 interacts specifically with the B7-1 costimulatory molecule to inhibit T cell responses. Immunity. 2007;27:111–122. doi: 10.1016/j.immuni.2007.05.016. [DOI] [PMC free article] [PubMed] [Google Scholar]
- 37.Park JJ, Omiya R, Matsumura Y, Sakoda Y, Kuramasu A, Augustine MM, Yao S, Tsushima F, Narazaki H, Anand S, et al. B7-H1/CD80 interaction is required for the induction and maintenance of peripheral T cell tolerance. Blood. 2010;116:1291–1298. doi: 10.1182/blood-2010-01-265975. [DOI] [PMC free article] [PubMed] [Google Scholar]
Associated Data
This section collects any data citations, data availability statements, or supplementary materials included in this article.