

Abstract
Despite considerable work, the neural basis of perceptual learning remains uncertain. For visual learning, although some studies suggested that changes in early sensory representations are responsible, other studies point to decision-level reweighting of perceptual readout. These competing possibilities have not been examined in other sensory systems, investigating which could help resolve the issue. Here we report a study of human tactile microspatial learning in which participants achieved >six-fold decline in acuity threshold after multiple training sessions. Functional magnetic resonance imaging was performed during performance of the tactile microspatial task and a control, tactile temporal task. Effective connectivity between relevant brain regions was estimated using multivariate, autoregressive models of hidden neuronal variables obtained by deconvolution of the hemodynamic response. Training-specific increases in task-selective activation assessed using the task × session interaction and associated changes in effective connectivity primarily involved subcortical and anterior neocortical regions implicated in motor and/or decision processes, rather than somatosensory cortical regions. A control group of participants tested twice, without intervening training, exhibited neither threshold improvement nor increases in task-selective activation. Our observations argue that neuroplasticity mediating perceptual learning occurs at the stage of perceptual readout by decision networks. This is consonant with the growing shift away from strictly modular conceptualization of the brain toward the idea that complex network interactions underlie even simple tasks. The convergence of our findings on tactile learning with recent studies of visual learning reconciles earlier discrepancies in the literature on perceptual learning.
Introduction
Although perceptual learning has been studied for over a century, its neural basis remains contentious. Early studies found visual learning effects to be highly specific for stimulus features, such as element orientation, retinal location, and spatial frequency (Ramachandran and Braddick, 1973; Ramachandran, 1976; Fiorentini and Berardi, 1980), leading to the idea that the underlying neural changes occur in primary visual cortex (V1). This is supported by neurophysiological (Gilbert et al., 2009; Bao et al., 2010) and functional magnetic resonance imaging (fMRI) studies (Schwartz et al., 2002; Furmanski et al., 2004; Yotsumoto et al., 2008; Jehee et al., 2012). However, others emphasized changes in higher-order visual areas (Yang and Maunsell, 2004; Raiguel et al., 2006). The specificity of visual learning can be eliminated by training at another retinal location on a different task (Xiao et al., 2008) or mere exposure to a different orientation (Zhang et al., 2010). Further, evidence from psychophysical, neurophysiological, and modeling studies favors an alternative hypothesis that the relevant neural changes involve later, decision-level reweighting of perceptual readout, rather than earlier stages of stimulus representation (Petrov et al., 2005; Law and Gold, 2008; Bejjanki et al., 2011; Huang et al., 2012).
Tactile learning has been less intensively studied, albeit for a longer time, beginning with Volkmann in the 19th century (Gibson, 1969). Many studies demonstrated transfer of learning effects between fingers in various tactile tasks (Recanzone et al., 1992a; Sathian and Zangaladze, 1997, 1998; Spengler et al., 1997; Nagarajan et al., 1998; Offe et al., 2000; Kaas et al., 2013). These findings fit with perceptual reweighting. However, sensory representational plasticity in tactile learning is favored by the report of a topographic gradient of transfer (Harris et al., 2001) and by neurophysiological observations in somatosensory cortex (Recanzone et al., 1992d; Harris et al., 1999).
As this brief survey indicates, the neural underpinnings of perceptual learning remain uncertain. We therefore conducted an fMRI study of human tactile learning, using a tactile microspatial task used previously (Offe et al., 2000; Stilla et al., 2007, 2008). Tactile acuity measured on this task correlated with the magnitude of activity in a posterior parietal cortical focus and the weights of paths into this focus from somatosensory cortex and the frontal eye field (FEF), suggesting interaction between sensory input and an attentional signal (Stilla et al., 2007). The parietal focus probably corresponds to the caudal intraparietal area (Shikata et al., 2008), and its role in the acuity task is compatible with a decision-level process, as for the neighboring lateral intraparietal area (Sugrue et al., 2005; Law and Gold, 2008). In a similar hyperacuity task, variation in the psychophysical threshold between fingers correlated with the size of the finger's cortical representation (Duncan and Boynton, 2007). We sought here to distinguish between two hypotheses: according to the sensory representation hypothesis, learning-related activation and connectivity changes should predominantly involve somatosensory cortex, whereas the perceptual readout hypothesis favors changes involving regions related to decision processes, for example, premotor (Romo and de Lafuente, 2012) or posterior parietal cortex.
Materials and Methods
Participants.
A total of 18 neurologically normal, right-handed volunteers participated. Ten of them (6 female, 4 male, mean age 21.9 years) constituted the experimental group; the control group comprised the other eight (4 female, 4 male, mean age 20.1 years). Handedness was assessed by the high-validity subset of the Edinburgh handedness inventory (Raczkowski et al., 1974). All procedures were approved by the Institutional Review Board of Emory University.
Stimuli and tasks.
The stimuli, stimulator, stimulation procedure, and tasks have been described in earlier reports (Stilla et al., 2007, 2008). Briefly, the stimulus was a linear three-dot array oriented along the long axis of the fingerpad, applied to the immobilized finger with constant contact force, using a computer-controlled pneumatic stimulator that was MRI-compatible (Fig. 1a). The duration and sequence of stimulation were controlled with Presentation software (Neurobehavioral Systems), which also recorded responses. In the experimental stimulus array, the central dot was offset to the left or right by 0.03–1.94 mm (Fig. 1b). The actual offset values (millimeters), as measured under a dissecting microscope, were as follows: 1.94, 1.49, 1.19, 1.04, 0.8, 0.6, 0.5, 0.42, 0.3, 0.09, 0.06, and 0.03. The array was applied to the fingerpad for 1 s, and participants were asked to determine whether the offset was to the left or right. Psychophysical thresholds were expressed in terms of the offset corresponding to 75% correct spatial discrimination, by linear interpolation between values spanning this threshold, or when applicable, as the stimulus offset value yielding 75% correct accuracy. In the control task, the central dot of the stimulus array was not offset (Fig. 1c) and stimulus duration was varied from 0.7 to 1.3 s. Pairs of durations (mean 1 s), differing by 0.2, 0.3, 0.4, or 0.6 s, were used (the corresponding duration pairs (s) were thus 1.1/.9; 1.15/.85; 1.2/.8; and 1.3/0.7). Participants indicated whether the contact duration was long or short. Participants were never allowed to see the stimuli, and they kept their eyes closed during stimulation.
Figure 1.
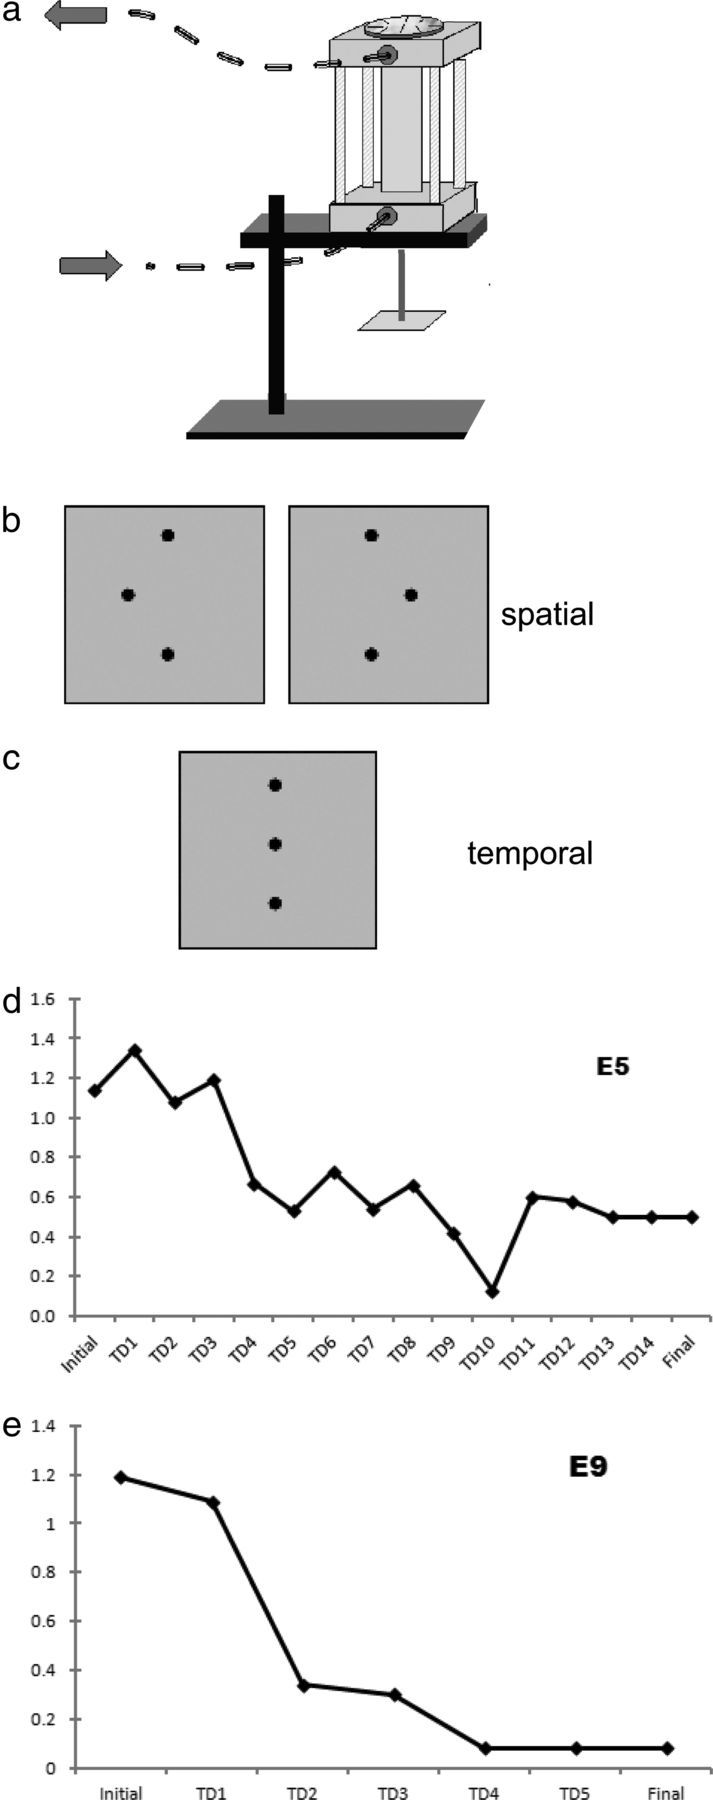
a, MRI-compatible pneumatic stimulator. Arrows indicate direction of airflow. Disk on the top of the stimulator allowed 180° rotation of the stimulus to present leftward or rightward offsets. b, Diagram of stimulus configurations in spatial task; central dot in array was offset either to the right or left. c, Stimulus array for the temporal task used an array without spatial offset [a–c, Stilla et al. (2007), reprinted with permission]. d, e, Sample learning curves from two representative participants in experimental group, showing spatial acuity threshold (millimeters) at initial and final testing, and on intervening training days (TDx).
Two fMRI scan sessions were completed by all participants. Before each scan session, participants' psychophysical thresholds were assessed using the method of constant stimuli, in 20-trial blocks beginning with the largest offset and proceeding through successively smaller offsets until accuracy fell to <75% correct. For the experimental (spatial) task, the acuity threshold was determined, and an offset value was selected for use during scanning with the goal of achieving close to 90% accuracy (i.e., suprathreshold but below ceiling). The offset value was lower in the final than the initial session because of perceptual learning; thus, scans were conducted with matched performance. For the control (temporal) task, a similar procedure was used to select a duration pair that would yield ∼90% accuracy. Values of offset and duration pairs used during scanning are given in Table 1 for each participant. Scanning was performed immediately after determination of the initial and final thresholds. No feedback regarding response accuracy was provided during prescan threshold testing or during scanning.
Table 1.
Stimulus parameters used and accuracy during scanning for individual participants
| Participant | Stimulus parameters |
Accuracy (%) during scanning |
||||||
|---|---|---|---|---|---|---|---|---|
| Initial offset (mm) | Initial duration-pairs (s) | Final offset (mm) | Final duration-pairs (s) | Initial offset task | Initial duration task | Final offset task | Final duration task | |
| E1 | 1.19 | 1.3/0.7 | 0.3 | 1.15/0.85 | 89 | 96 | 64 | 86 |
| E2 | 1.94 | 1.15/0.85 | 0.42 | 1.15/0.85 | 77 | 86 | 79 | 79 |
| E3 | 1.19 | 1.15/0.85 | 0.42 | 1.15/0.85 | 85 | 85 | 77 | 94 |
| E4 | 1.94 | 1.3/0.7 | 0.42 | 1.1/0.9 | 93 | 96 | 92 | 80 |
| E5 | 1.49 | 1.15/0.85 | 0.8 | 1.1/0.9 | 60 | 94 | 84 | 86 |
| E6 | 0.8 | 1.1/0.9 | 0.03 | 1.1/0.9 | 89 | 89 | 72 | 89 |
| E7 | 1.04 | 1.15/0.85 | 0.42 | 1.15/0.85 | 93 | 91 | 97 | 95 |
| E8 | 1.49 | 1.1/0.9 | 0.42 | 1.1/0.9 | 94 | 89 | 82 | 87 |
| E9 | 1.94 | 1.1/0.9 | 0.03 | 1.1/0.9 | 71 | 87 | 69 | 85 |
| E10 | 1.49 | 1.2/0.8 | 0.03 | 1.2/0.8 | 72 | 94 | 80 | 89 |
| Mean | — | — | — | — | 82.3 | 90.7 | 79.6 | 87.0 |
| SEM | — | — | — | — | 3.9 | 1.4 | 3.3 | 1.7 |
| C1 | 1.49 | 1.1/0.9 | 1.04 | 1.1/0.9 | 93 | 81 | 76 | 84 |
| C2 | 1.94 | 1.1/0.9 | 0.8 | 1.1/0.9 | 95 | 86 | 53 | 58 |
| C3 | 1.94 | 1.2/0.8 | 1.19 | 1.15/0.85 | 61 | 80 | 81 | 85 |
| C4 | 1.04 | 1.1/0.9 | 1.19 | 1.1/0.9 | 60 | 87 | 93 | 89 |
| C5 | 1.49 | 1.15/0.85 | 1.94 | 1.15/0.85 | 90 | 92 | 92 | 89 |
| C6 | 1.94 | 1.2/0.8 | 0.30 | 1.2/0.8 | 87 | 90 | 62 | 88 |
| C7 | 1.94 | 1.15/0.85 | 1.19 | 1.15/0.85 | 87 | 89 | 85 | 79 |
| C8 | 1.19 | 1.15/0.85 | 1.19 | 1.15/0.85 | 80 | 87 | 85 | 79 |
| Mean | — | — | — | — | 81.7 | 86.5 | 78.4 | 81.3 |
| SEM | — | — | — | — | 5.2 | 1.6 | 5.4 | 3.9 |
Participants in the experimental group were trained on the spatial discrimination task for a number of sessions after the initial scan session. Training began on the next weekday after the initial scan. Feedback on accuracy was provided verbally after each training trial. As during threshold testing, trials were presented in blocks of 20, with the offset value constant within a block, and adjusted up or down based on performance. Stimuli bearing different offsets were interchanged manually by an experimenter, out of participants' sight. Sessions lasted approximately an hour, with successive sessions on separate days, typically consecutive except for weekends or when occasional scheduling conflicts intervened. The number of blocks per session varied somewhat across sessions and participants, the mean (± SEM) being 13.9 (± 0.7). Training continued until performance plateaued (i.e., the threshold was stable across 2 or 3 sessions). The threshold was taken to plateau if successive computed thresholds were identical (after rounding to the nearest one-hundredth of a millimeter) or if the difference between successive thresholds was ≤0.1 mm. This was usually achieved after 2 consecutive sessions. For two subjects, these nearly identical thresholds were separated by an intervening day when the threshold climbed by >0.1 mm. In the case of one subject, a third session was run that in retrospect was unnecessary as a stable threshold had already been attained. The final threshold determination and final scan were conducted on the next weekday after the last training day. Four additional participants were dropped: three because they failed to attain a mean accuracy of at least 60% correct on both tasks in the initial scan session and the fourth because of failure to attain a stable threshold despite 23 sessions of training. No data from these participants were used. The control group was not trained between scan sessions.
Functional imaging.
As described previously (Stilla et al., 2007, 2008), participants lay supine in the scanner. The extended, supinated right arm was comfortably supported by foam padding, which also minimized transfer of gradient coil vibration. Headphones conveyed auditory cues and protected hearing. Participants held a two-button fiber-optic response box in the left hand and used the second or third digit to respond “right” or “left” during the experimental task, or “long” or “short” during the control task.
A block design paradigm was used in which each functional run contained 12 stimulation blocks of 24 s (six of each condition) in pseudorandom order, with each stimulation block comprising eight (3 s) trials. Thus, there were 48 trials of each condition per run. Each run began and ended with an 18 s rest period, and 18 s rest intervals separated stimulation blocks. Verbal cues immediately before active and rest blocks instructed participants which block type followed. Four participants in the experimental group completed 2 runs per fMRI session, whereas the remaining 6 completed 4 runs in each session (32 runs total). The 8-participant control group completed 4 runs per session (32 runs total). Thus, the total number of runs was balanced across groups, and the numbers of participants in each group were similar. Further, each participant completed the same number of runs in both initial and final sessions.
MR scans were performed on a 3 Tesla Siemens Trio whole-body scanner (Siemens Medical Solutions), using a transmit/receive quadrature head coil. T2*-weighted functional images were acquired using a single-shot gradient-recalled EPI sequence with blood oxygenation level-dependent (BOLD) contrast. Twenty-one contiguous, axial slices of 5 mm thickness were acquired using the following parameters: repetition time (TR) 1500 ms, echo time (TE) 30 ms, field of view (FOV) 220 mm, flip angle (FA) 70 degrees, in-plane resolution 3.4 × 3.4 mm, in-plane matrix 64 × 64. High-resolution anatomic images were acquired using a 3D-MPRAGE sequence (TR 2300 ms, TE 3.9 ms, inversion time 1100 ms, FA 8 degrees) consisting of 176 sagittal slices of 1 mm thickness (FOV 256 mm, in-plane resolution 1 ×1 mm, in-plane matrix 256 × 256).
Image processing and analysis.
Image processing and analysis were performed using BrainVoyager QX version 1.6.3 (Brain Innovation). Each subject's functional runs were real-time motion corrected using Siemens 3D-PACE (prospective acquisition motion correction; Siemens Medical Solutions). Functional images were preprocessed using sinc interpolation for slice scan time correction, trilinear-sinc interpolation for intrasession alignment of functional volumes, and high-pass temporal filtering of 3 cycles/run to remove low-frequency drifts in the data. The hemodynamic response function (HRF) was modeled using the default option in BrainVoyager, comprising a dual γ function, one for the response (time to peak 5 s) and one for the undershoot (time to peak 15 s), with a response undershoot ratio of 6. The boxcar function representing the block design was convolved with this HRF. Anatomic 3D images were processed, coregistered with the functional data, and transformed into Talairach space (Talairach and Tournoux, 1988). Activations were localized with the aid of a 3D sectional anatomy atlas (Duvernoy, 1999).
For group analysis, the transformed data were spatially smoothed with an isotropic Gaussian kernel (full-width half-maximum 4 mm). Runs were normalized to account for variability of absolute signal values between runs and individuals. Statistical analysis of group data used random effects, general linear models in which the multiple runs were combined within participants before group-level analyses. All analyses were corrected for multiple comparisons (p < 0.05) using the Cluster Threshold Estimator plugin implemented in BrainVoyager QX.
Effective connectivity analyses.
Directional causal influence from time series A to time series B can be inferred if past values of time series A help predict the present and future values of time series B (Granger, 1969). Based on this idea, the approach known as Granger causality analysis was introduced to characterize predictive relationships between BOLD time series (Roebroeck et al., 2005; Abler et al., 2006). Prior studies from our group elaborated this approach, implementing multivariate, autoregressive (MVAR) models to assess directed interactions between multiple nodes while factoring out influences mediated indirectly in the set of regions selected (Stilla et al., 2007, 2008; Deshpande et al., 2008, 2009; Sathian et al., 2011). Spatial variability of the BOLD response arising from vascular sources can confound Granger causality obtained from raw fMRI time series (David et al., 2008; Deshpande et al., 2010b). Hemodynamic deconvolution removes the intersubject and interregional variability of the HRF (Handwerker et al., 2004) as well as the smoothing effect of the HRF, thus increasing effective temporal resolution of the signal. Therefore, here we applied our MVAR approach to hidden neuronal variables obtained after hemodynamic deconvolution (Havlicek et al., 2011) of the BOLD time series extracted from selected regions of interest (ROIs). As in previous reports (Deshpande et al., 2010c; Sathian et al., 2011), instantaneous correlations were factored out. Also, to obtain condition-specific connectivity values without having to slice the time series corresponding to specific conditions, we allowed the MVAR model coefficients to vary as a function of time. The boxcar function representing the experimental block design was used to extract connectivity values corresponding to the spatial and temporal tasks. The resulting dynamic Granger causality path weights were populated into different samples, comprising spatial and temporal conditions for both initial and final sessions, and t tests were performed to assess condition-specific modulation of connectivity; specifically, path weights that were greater in the spatial compared with the temporal condition and either greater in the final than the initial session or greater in the initial than the final session. Details of the approach follow.
Let k fMRI time series be represented as X(t) = [x1(t) x2(t) … xk(t)]. The dynamic state-space model used was as follows:
 |
where n is the neuronal state variable, u is the exogenous input, θ is the parameter variable, and f is the function that links the current neuronal state to the previous neuronal states, exogenous inputs, and parameters. The subscript T indicates continuous time, the superscript k indicates the number of time series in the model; q, v, and w are the zero mean Gaussian-state noise vectors. The observation equation, which links the state to observation variables, is as follows:
 |
where g is the measurement function that links the state variables to measurement variables, t is discrete time, and r is the measurement noise. The inputs to the model are exogenous inputs u, which is the experimental boxcar function, and xk(t). As shown before, the cubature Kalman filter performs very efficient joint estimation of underlying neuronal state variables and parameters (Havlicek et al., 2011). Because the state-space model is in continuous time, Havlicek et al. (2011) showed that the time step used in its estimation and discretization can be one-tenth of the TR (or even less) while still yielding optimal results. Using such neuronal variables with high temporal resolution in an MVAR model enables effective connectivity analysis. The estimated neuronal state variables nk(t) were input into the MVAR as follows:
 |
where p is the order of the model determined by the Akaike/Bayesian information criterion (Deshpande et al., 2009), a is the model coefficients, and e is the model error. Note that a(0) represents the instantaneous influences between time series whereas a(n), n = 1. k represents the causal influences between time series. By modeling both instantaneous and causal terms in a single model, the effect of instantaneous correlation on causality was minimized (Deshpande et al., 2010a). The MVAR model was made dynamic by allowing the model coefficients to vary as a function of time as given below:
 |
The model coefficients aij(n,t) were taken as the state vector of a Kalman filter and adaptively estimated (Arnold et al., 1998). Dynamic Granger causality (DGC) was then obtained as follows:
 |
Results
Psychophysical
Threshold changes
Individual results are shown in Table 2, and sample learning curves are shown in Figure 1. The initial threshold for the experimental group was 1.13 ± 0.08 mm (mean ± SEM), whereas the final threshold was 0.17 ± 0.05 mm, achieved after 9.1 ± 1.5 sessions. This more than six-fold threshold decline (0.96 ± 0.1 mm) marks a considerable degree of perceptual learning. Whereas the mean initial threshold was close to the acuity limit at the index finger (Van Boven and Johnson, 1994; Sathian and Zangaladze, 1996; Vega-Bermudez and Johnson, 2001), the mean final threshold was far below the acuity limit and thus represents hyperacuity (Westheimer, 1977). A control group of eight participants was also tested twice a few days apart, without intervening training. This group had an initial threshold of 0.98 ± 0.07 and a final threshold of 1.12 ± 0.14 (i.e., these participants as a group did not demonstrate perceptual learning).
Table 2.
Threshold values for tactile spatial task in experimental and control participants
| Participant | Initial threshold (mm) | Final threshold (mm) | Threshold change (mm) | No. of sessions |
|---|---|---|---|---|
| E1 | 1.2 | 0.1 | 1.1 | 6 |
| E2 | 1.49 | 0.24 | 1.25 | 8 |
| E3 | 1.04 | 0.3 | 0.74 | 6 |
| E4 | 1.27 | 0.07 | 1.2 | 7 |
| E5 | 1.14 | 0.5 | 0.64 | 14 |
| E6 | 0.64 | 0.22 | 0.42 | 10 |
| E7 | 0.84 | 0.08 | 0.76 | 4 |
| E8 | 1.14 | 0.03 | 1.11 | 15 |
| E9 | 1.19 | 0.08 | 1.11 | 5 |
| E10 | 1.3 | 0.08 | 1.22 | 16 |
| Mean (experimental) | 1.13 | 0.17 | 0.96 | 9.10 |
| SEM | 0.08 | 0.05 | 0.10 | 1.47 |
| C1 | 1.04 | 1.04 | 0 | — |
| C2 | 0.80 | 1.34 | −0.54 | — |
| C3 | 1.1 | 1.12 | −0.02 | — |
| C4 | 0.63 | 1.17 | −0.54 | — |
| C5 | 1.00 | 1.64 | −0.64 | — |
| C6 | 1.19 | 0.3 | 0.89 | — |
| C7 | 1.01 | 1.19 | −0.18 | — |
| C8 | 1.1 | 1.19 | −0.09 | — |
| Mean (control) | 0.98 | 1.12 | −0.14 | — |
| SEM | 0.07 | 0.14 | 0.18 | — |
Accuracy data during scans
Table 1 shows individual accuracy for each participant in both tasks and scan sessions. For the experimental group, mean accuracies on the spatial and temporal task were 82.3 ± 3.9% and 90.7 ± 1.4%, respectively, in the initial scan session and 79.6 ± 3.3% and 87 ± 1.7%, respectively, in the final scan session. For the control group, mean accuracies on the spatial and temporal task were 81.7 ± 5.2% and 86.5 ± 1.6%, respectively, in the initial scan session and 78.4 ± 5.4% and 81.3 ± 3.9%, respectively, in the final scan session. A repeated-measures ANOVA with factors of group (experimental, control), task (spatial, temporal), and session (initial, final) showed that the main effects of group (F(1,16) = 0.68, p = 0.42) and session (F(1,16) = 0.4, p = 0.54) were insignificant. Although the main effect of task (F(1,16) = 10.46, p = 0.005) was significant, critically, the task × session interaction (F(1,16) = 0.28, p = 0.6) was not (i.e., the accuracy differences between tasks were consistent across sessions).
Imaging
Activation changes across sessions in whole-brain analysis
To isolate effects for the tactile spatial task attributable to training for the experimental group, we examined the interaction between task and session using a whole-brain analysis. This allowed us to control for any nonspecific effects arising from BOLD signal variability between scan sessions, resulting from global signal variation or random noise (Raemakers et al., 2012) or priming effects from simply repeating the scan session. Importantly, the absence of a significant task × session interaction for the accuracy data obtained during scanning in both groups (see above) rules out the possibility that task-specific activation changes are attributable to psychophysical variables. The control group was studied to provide another level of control. As expected, the interaction analysis in this group showed no significant increases in task-selective activation over time that were specific for the spatial task (t(7) < 2.35, p > 0.05). They did demonstrate the opposite interaction effect in a few regions, mostly in parietal cortex, but these tended to be largely changes in negative-going BOLD signal (i.e., deactivations).
The experimental group exhibited significant increases in activation for the spatial task relative to the control (temporal) task in the final session relative to the initial session (i.e., a significant task × session interaction) in a number of regions (Table 3; Fig. 2). These regions passed a priori voxelwise thresholds (t(9) >2.25; p < 0.05) and survived cluster correction for multiple comparisons (cluster threshold 489 anatomic, 1×1×1 mm, voxels). Only three of these regions were neocortical: the right presupplementary motor area (pre-SMA) and the anterior insula bilaterally. The others were bilateral subcortical regions: the putamen, anterior thalamus, and superior cerebellum. The anterior thalamic activation spanned multiple nuclei, including the probable locations of the ventral anterior (VA), ventrolateral (VL), and mediodorsal (MD) nuclei. Notably, somatosensory and posterior parietal cortical activation changes were conspicuous by their absence. Figure 2 shows BOLD signal time courses from the right pre-SMA and the left anterior thalamic activation sites. These clearly show the relative increase of spatial task-selective activation in the final session compared with the initial session. Similar profiles were observed at the other sites of Table 3. The opposite interaction effect, again comprising changes in deactivation, was observed in other regions, chiefly in occipital and parietal cortex.
Table 3.
Regions showing significant increases in activation for the experimental (spatial) task relative to the control (temporal) task in the final session relative to the initial session (i.e., a significant task × session interaction) in experimental group
| Region | x | y | z | tmax |
|---|---|---|---|---|
| R pre-SMA | 5 | 23 | 44 | 6 |
| R anterior insula | 28 | 14 | 3 | 5.5 |
| R putamen | 23 | 4 | 6 | 3.6 |
| R anterior thalamus | 9 | −10 | 8 | 4.7 |
| L anterior thalamus | −11 | −7 | 13 | 7.3 |
| L putamen | −21 | −8 | 12 | 4.6 |
| L anterior insula | −30 | 17 | 16 | 3.1 |
| R superior cerebellum | 23 | −55 | −23 | 4 |
| L superior cerebellum | −5 | −47 | −19 | 2.9 |
x, y, and z, Talairach coordinates of center of gravity; tmax, peak t value of interaction contrast; R, right; L, left.
Figure 2.
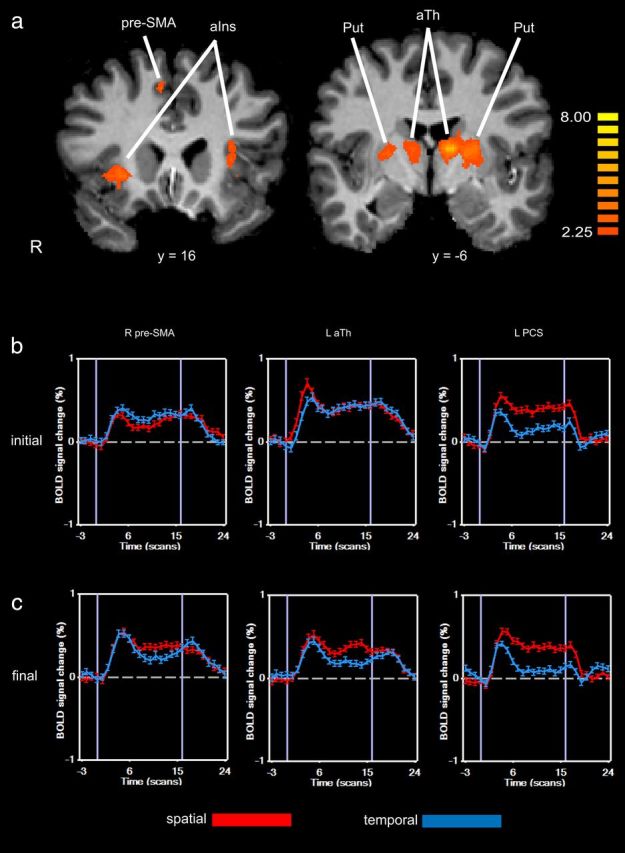
a, Activations on task × session interaction displayed on coronal slices. Talairach y-planes are given below each slice. Color t-scale on right. b, c, BOLD signal time courses (averaged over participants) from selected sites in initial (b) and final (c) scan sessions. aIns, Anterior insula; Put, putamen; aTh, anterior thalamic region.
We also investigated whether there were any brain regions whose task-specific activation changes (from the β values of the task × session interaction effect) correlated with threshold changes across participants. Only one region showed a significant (p < 0.05, corresponding to r(9) > 0.65, cluster-corrected threshold 516 anatomic voxels) correlation (r = 0.85): it was located in the right rostral anterior cingulate cortex and demonstrated, on average, a greater negative BOLD response in the spatial task compared with the temporal task in both sessions (Fig. 3). The positive correlation indicates a tendency for greater threshold decline to be associated with a smaller negative BOLD response over time for the spatial task relative to the temporal task.
Figure 3.
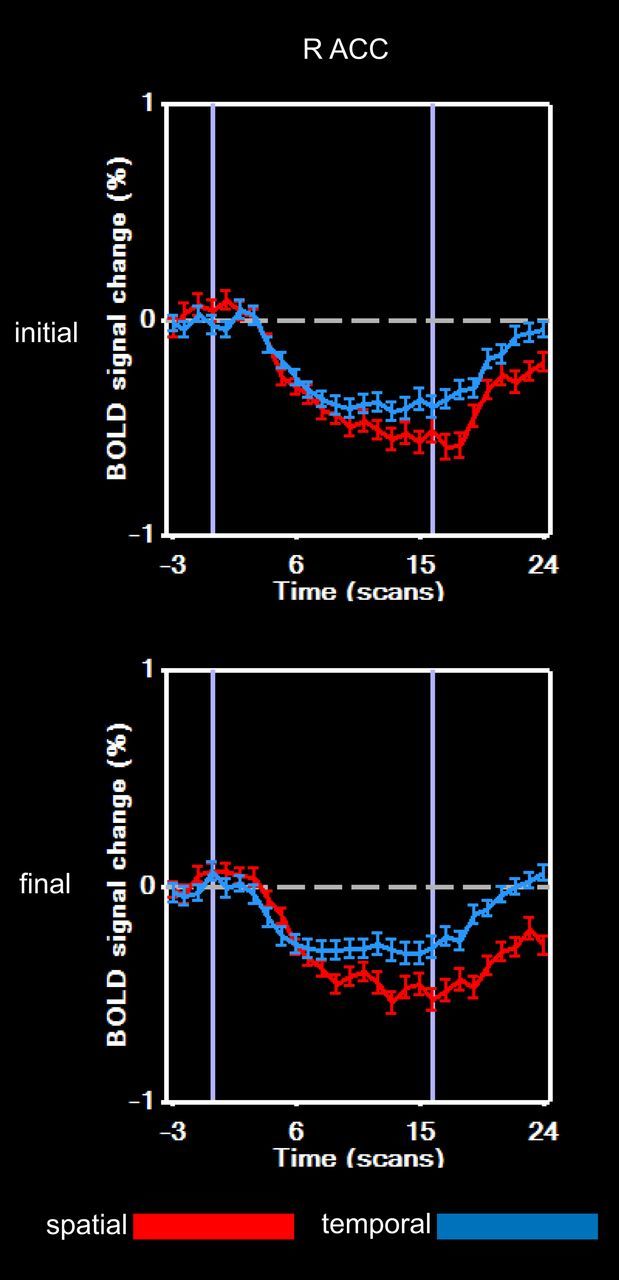
BOLD signal time courses from the right anterior cingulate (ACC) focus showing correlation between magnitudes of task-specific activation changes and threshold changes across sessions.
Activations common across sessions
We also examined activations for the spatial task (relative to the temporal task) common to both initial and final sessions for the experimental group (Table 4), using a conjunction analysis across sessions (voxelwise thresholds: t(9) > 2.25; p < 0.05; cluster-corrected for multiple comparisons: cluster threshold 1353 anatomic voxels). This analysis revealed common sites bilaterally in the postcentral sulcus (PCS), anterior intraparietal sulcus (aIPS), posterior intraparietal sulcus (pIPS), and FEF. Also found were sites on the left in the ventral intraparietal sulcus (vIPS), posterior insula, ventral premotor cortex (PMv), anterior thalamus (MD nucleus overlapping with the site in Table 3 showing the interaction effect), and posterior thalamus [ventral posterolateral (VPL) nucleus]. Of note, the VPL nucleus is the thalamic somatosensory nucleus receiving inputs from the contralateral body surface, including the stimulation site. The PCS corresponds to Brodmann's area 2, the most posterior field of primary somatosensory cortex (S1) (Grefkes et al., 2001), and the posterior insular site lies in the somatosensory field known as OP3, which is thought to be the human homolog of the macaque ventral somatosensory area (Eickhoff et al., 2007). The sites along the intraparietal sulcus (IPS) correspond to the probable human homologs of the anterior intraparietal area (corresponding to our aIPS) and caudal intraparietal area (our pIPS), and to the region termed IPS1 (our vIPS) (Swisher et al., 2007; Shikata et al., 2008). Inspection of the BOLD signal time courses from these regions confirmed the absence of the key interaction effect between task and session, as illustrated in Figure 2 for the left PCS. Thus, these regions, which included somatosensory thalamic and cortical regions, can be taken to be involved in task performance in both sessions, with no evidence for a role in tactile learning.
Table 4.
Regions showing activations for the spatial task (relative to the temporal task) common to both initial and final sessions for the experimental group, from a conjunction analysis across sessions
| Region | x | y | z | tmax |
|---|---|---|---|---|
| L FEF | −26 | −11 | 55 | 5.9 |
| R FEF | 29 | −9 | 51 | 5.1 |
| L PCS | −54 | −27 | 33 | 6.4 |
| L aIPS | −35 | −41 | 41 | 5.4 |
| L pIPS | −15 | −64 | 50 | 2.9 |
| L vIPS | −23 | −65 | 39 | 2.9 |
| R pIPS | 14 | −66 | 46 | 4.1 |
| R aIPS | 40 | −39 | 38 | 6 |
| R PCS | 57 | −24 | 34 | 5.6 |
| L PMv | −49 | 0 | 31 | 3.7 |
| L posterior insula | −34 | −8 | 14 | 4.5 |
| L VPL thalamus | −12 | −24 | 11 | 4.7 |
| L MD thalamus | −5 | −18 | 12 | 2.9 |
x, y, and z, Talairach coordinates of center of gravity; tmax, peak t value of interaction contrast; R, right; L, left.
ROI analyses of S1
We conducted additional ROI analyses of S1 in case our whole-brain interaction analysis had missed somatosensory cortical plasticity because of imperfect interindividual alignment. First, we created bilateral postcentral gyrus (PCG) ROIs using group data from the experimental group and the contrast of spatial task > baseline in either the initial or final session [false discovery rate (FDR), q < 0.01, t(9) >4.21, p < 0.002]. The rationale for this contrast was to identify PCG voxels responsive during the tactile spatial task in either session. These group PCG ROIs were applied to the Talairach-normalized anatomical images from each individual participant. We examined these images and confirmed that the ROIs were in the PCG in each individual subject. We then tested the interaction contrast in these ROIs using a random-effects analysis. The effect was not significant in either the left (t(9) = 0.23; p = 0.82) or right (t(9) = −0.06; p = 0.95) PCG.
We also similarly applied the group PCS ROIs from the conjunction analysis to each individual subject. The ROIs fell in the left PCS for 9 of 10 participants (being in the PCG for the remaining one) and in the right PCS for 8 of 10 (being adjacent to the PCS in the remaining two participants: in the PCG for one and in the supramarginal gyrus for the other). We then tested the interaction contrast in these ROIs using a random-effects analysis. The effect was not significant in either the left (t(9) = 0.4; p = 0.69) or right (t(9) = 0.25; p = 0.81) PCS.
Because there was some variability between individuals in the position of the group ROI on the PCG, we created individual-specific PCG ROIs, again using the contrast of spatial task > baseline in either the initial or final session. These ROIs are displayed in Figure 4. We tested the interaction contrast in these ROIs using a random-effects analysis. Here, too, the effect was not significant in either the left (t(9) = 0.31; p = 0.76) or right (t(9) = −0.01; p = 0.99) PCG.
Figure 4.
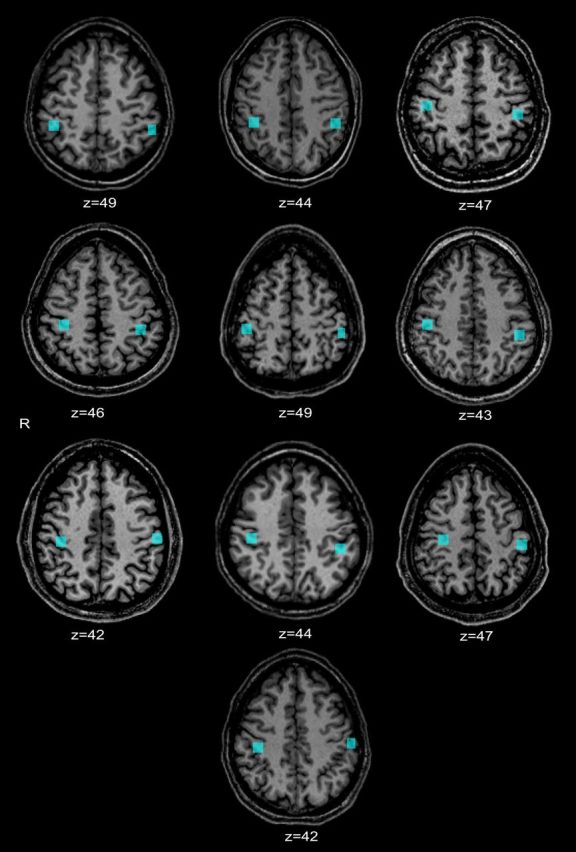
Locations of individual ROIs on the postcentral gyrus, overlaid on individual anatomic images in the axial plane (corresponding Talairach z-value given below each image).
Based on these ROI analyses, we conclude that there were no significant training-specific changes in the magnitude of the spatial task-selective BOLD signal in S1.
Connectivity changes across sessions
We selected ROIs showing activity specific for the spatial task relative to the temporal task in each scan session, including both regions showing a significant task × session interaction and those showing common activation across sessions without significant interaction effects. The rationale for this is that the most relevant changes in connectivity resulting from training are likely to involve regions whose activation changes significantly as a result of training (from the interaction analysis), and possibly also regions active both before and after training but without significant training-related changes (from the conjunction analysis). The ROIs were defined at the group level and restricted to cubes of 5 mm side centered on the activation hotspots, as in prior studies (Stilla et al., 2007, 2008; Deshpande et al., 2008, 2010c). Because the ROIs were drawn from the interaction or conjunction analysis, they all passed voxelwise thresholds of p < 0.05 and the respective cluster-size threshold. As described in Materials and Methods, effective connectivity between these ROIs was estimated and thence paths specific for the spatial task relative to the temporal task (t(6142) > 3.64, p < 0.05, Bonferroni-corrected for multiple comparisons) were identified. Among these spatial task-specific paths, significant increases and decreases in path weights from the initial to final session (t(6142) >1.65, p < 0.05) were computed (Table 5). This approach did not rely on computing the task × session interaction as was done for activations; instead, the approach used in the effective connectivity analyses ensured a focus on paths relevant to the spatial task. As in prior studies (Stilla et al., 2007, 2008; Deshpande et al., 2008, 2009, 2010c; Bianchi et al., 2013), fixed-effects analyses were used on time series concatenated across participants. Paths showing significantly increased weights are shown in Figure 5a, whereas those showing significantly decreased weights are shown in Figure 5b.
Table 5.
Spatial condition-specific paths whose weights changed after traininga
| Source | Target | Initial path weight | Final path weight | Final − initial path weight | t value | p |
|---|---|---|---|---|---|---|
| Final > initial | ||||||
| R aTh | R aIPS | 0.21 | 0.34 | 0.13 | 1.82 | 0.03 |
| L aTh | 0.10 | 0.37 | 0.27 | 4.00 | 3.1 × 10⁻⁵ | |
| L pIPS | 0.09 | 0.35 | 0.26 | 3.65 | 1.3 × 10⁻⁴ | |
| L aIPS | −0.04 | 0.43 | 0.47 | 7.10 | 7.1 × 10⁻¹³ | |
| L pIns | 0.09 | 0.50 | 0.41 | 5.92 | 1.7 × 10⁻⁹ | |
| L aIns | −0.02 | 0.27 | 0.29 | 4.38 | 6.0 × 10⁻⁶ | |
| R FEF | 0.06 | 0.21 | 0.15 | 2.21 | 0.01 | |
| R PCS | 0.15 | 0.28 | 0.13 | 1.86 | 0.03 | |
| L aTh | R aTh | 0.42 | 0.67 | 0.25 | 3.72 | 1.0 × 10⁻⁴ |
| L pTh | 0.13 | 0.57 | 0.44 | 6.25 | 2.1 × 10⁻¹⁰ | |
| L vIPS | 0.09 | 0.65 | 0.56 | 8.11 | 2.9 × 10⁻¹⁶ | |
| R pre-SMA | 0.22 | 0.72 | 0.50 | 7.04 | 1.1 × 10⁻¹² | |
| R PCS | 0.27 | 0.65 | 0.38 | 5.39 | 3.7 × 10⁻⁸ | |
| L Put | R Put | 0.42 | 0.67 | 0.25 | 1.95 | 0.03 |
| R aTh | 0.12 | 0.57 | 0.45 | 2.84 | 0.002 | |
| L pIPS | R pIPS | −0.28 | 0.16 | 0.44 | 6.16 | 3.8 × 10⁻¹⁰ |
| L FEF | R pIPS | −0.07 | 0.42 | 0.49 | 7.52 | 3.2 × 10⁻¹⁴ |
| L pTh | −0.05 | 0.39 | 0.44 | 6.63 | 1.9 × 10⁻¹¹ | |
| L pIPS | −0.02 | 0.70 | 0.72 | 10.30 | 5.1 × 10⁻²⁵ | |
| L aIns | 0.14 | 0.41 | 0.27 | 4.11 | 2.0 × 10⁻⁵ | |
| R PCS | L PCS | 0.03 | 0.20 | 0.17 | 2.18 | 0.015 |
| Initial > final | ||||||
| R pIPS | R PCS | 0.40 | 0.19 | −0.21 | 2.98 | 0.0014 |
| L pIPS | R aIPS | 0.25 | 0.09 | −0.16 | 2.32 | 0.01 |
| L aIPS | L pIns | 1.02 | 0.58 | −0.44 | 6.67 | 1.3 × 10⁻¹¹ |
| R aIns | 1.00 | 0.52 | −0.48 | 6.88 | 3.3 × 10⁻¹² | |
| R FEF | R aTh | 0.53 | 0.30 | −0.23 | 3.07 | 0.0011 |
| R pre-SMA | L aIPS | 0.62 | 0.21 | −0.41 | 5.62 | 9.7 × 10⁻⁹ |
| R PCS | 0.61 | 0.20 | −0.41 | 5.88 | 2.2 × 10⁻⁹ | |
| R PCS | R pIPS | 0.50 | 0.20 | −0.30 | 4.07 | 2.3 × 10⁻⁵ |
| R aTh | 0.21 | −0.19 | −0.40 | 6.11 | 5.4 × 10⁻¹⁰ | |
| L pIPS | 0.45 | −0.33 | −0.78 | 10.87 | 1.3 × 10⁻²⁷ |
aPositive path weights indicate that BOLD signal changes in the source and target ROI were in the same direction, whereas negative path weights indicate that BOLD signal changes were in opposite directions in the source and target ROIs.
Figure 5.
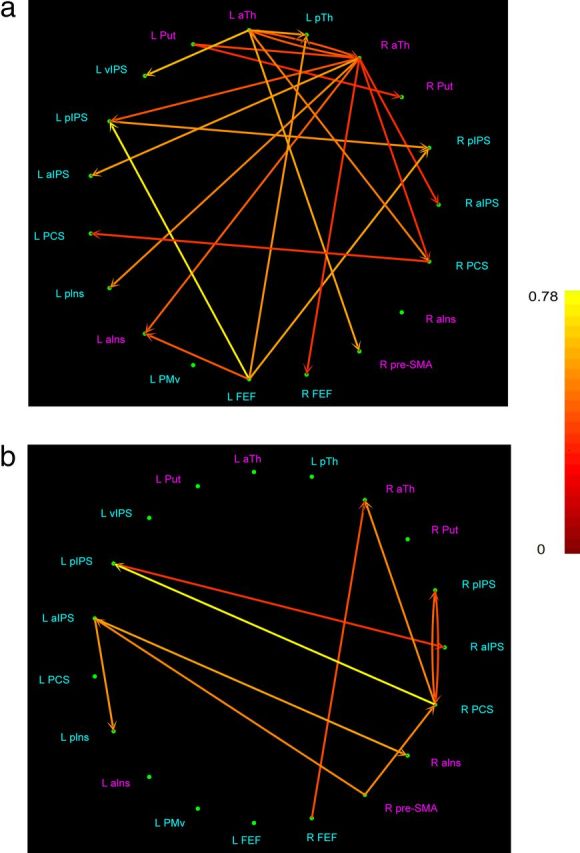
Spatial condition-specific paths whose weights increased (a) or decreased (b) significantly from initial to final session. Absolute magnitude of change in path weight is shown, color-scale at right. Put, Putamen; aTh, anterior thalamus; pTh, posterior thalamus; aIns, anterior insula; pIns, posterior insula. ROIs identified on the task × session interaction analysis of activations are shown in pink (increased spatial selectivity with training); those identified on the conjunction analysis of activations are shown in blue (spatially selective in both sessions, without training-associated change).
Task-specific increases in connectivity emanated from a limited number of sources. Of 21 such paths, 15 originated from subcortical sources: the anterior thalamus bilaterally (8 paths from the right and 5 from the left) and the left putamen (2 paths). Notably, these subcortical sources all showed a task × session interaction on the activation analysis. The remaining 6 paths derived from neocortical sources that, in the activation analyses, were active in the spatial task in both sessions on the conjunction analysis, without a task × session interaction: right PCS, left FEF, and left pIPS, with 4 of these stemming from the left FEF and one each from the other two. Thus, only one of these paths originated in somatosensory cortex, and one in posterior parietal cortex. The targets of these paths were more distributed, including loci identified on both the interaction and conjunction analyses, with only 4 of 19 ROIs failing to receive input that was significantly increased with training: these were loci in the left putamen, PMv and FEF, and the right anterior insula.
Task-specific decreases in connectivity were sparser, being limited to 10 paths of which all had neocortical sources. Only one of 6 sources of these paths emerged from the interaction analysis of activations; the rest came from the conjunction analysis. The right PCS was the source of 3 of these paths, the remainder being distributed across prefrontal and posterior parietal cortex. Among targets, 3 were in somatosensory cortex: 2 in the right PCS and one in the left posterior insula; 4 were in the IPS; one in the right anterior insula; and only two had a subcortical target, both in the right anterior thalamus. Three of 10 targets showed a task × session interaction effect on the activation analysis, whereas the remaining 7 were identified only on the conjunction analysis.
Thus, overall, training tended to increase the spatial task-specific weights of paths originating subcortically and showing a task × session interaction effect on the activation analyses but decrease the spatial task-specific weights of paths from neocortical foci that were spatially selective in both sessions but showed no interaction effect. Furthermore, somatosensory cortical areas were involved in a minority of paths whose task-specific weights changed after training: They contributed one of 21 sources and 4 of 21 targets for paths showing increased weights after training, with only one of 4 such paths being between two somatosensory cortical areas. Among paths showing decreased weights after training, one of 10 sources and 3 of 10 targets were in somatosensory cortex, with none of 6 such paths being between two somatosensory cortical areas. It is interesting that the S1 paths mostly involved the right PCS, ipsilateral to the stimulus. This may reflect right hemisphere specialization for some aspects of tactile processing, in accord with some earlier studies (Zhang et al., 2004; Stilla et al., 2007; Stilla and Sathian, 2008), although more work is required to assess this possibility.
Discussion
Most earlier studies of perceptual learning lacked a control task to factor out nonspecific processes, and also focused on particular neocortical areas. Similar to a previous study of visual learning (Schiltz et al., 1999), the present study included a control task and used the task × session interaction to isolate training-specific changes, unconfounded by extraneous variability of the BOLD signal. This is a good model for rehabilitative studies (Hampstead et al., 2011, 2012). Moreover, running a control group in the present study assured that the changes observed could be reliably attributed to training effects, and the whole-brain analysis permitted the possibility of finding distributed neural changes. Participants in the experimental group demonstrated perceptual learning in the tactile hyperacuity range resulting from training. Whereas these participants experienced >six-fold decline in spatial threshold, a comparable control group tested twice without intervening training exhibited no perceptual learning.
Our task was adapted from a visual version (Westheimer, 1977). Visual learning on a related hyperacuity task was specific for stimulus position and orientation (Crist et al., 1997). As reviewed in the Introduction, many studies implicated V1 as the locus of neural plasticity underlying visual learning (Schoups et al., 2001; Schwartz et al., 2002; Furmanski et al., 2004; Yotsumoto et al., 2008; Gilbert et al., 2009; Bao et al., 2010; Jehee et al., 2012), whereas other studies showed plasticity of representations in extrastriate visual (Zohary et al., 1994; Tovee et al., 1996; Raiguel et al., 2006), somatosensory (Recanzone et al., 1992b,c,d; Harris et al., 1999), and auditory (Recanzone et al., 1993; Alain et al., 2007; van Wassenhove and Nagarajan, 2007) cortex. However, others found that pertinent changes were modest in visual cortical areas (Ghose et al., 2002; Yang and Maunsell, 2004), were not confined to early visual areas (Song et al., 2002; Ding et al., 2003; Mayhew et al., 2012), or affected the decision stage rather than sensory representations (Law and Gold, 2008). These neurophysiological studies, along with psychophysical and modeling studies (Petrov et al., 2005; Bejjanki et al., 2011; Huang et al., 2012), favor an alternative hypothesis: that perceptual learning depends on plasticity of perceptual readout by decision processes. Moreover, visual learning often transfers outside the training conditions (Ghose et al., 2002; Song et al., 2002; Ding et al., 2003) or can be easily induced to do so (Xiao et al., 2008; Zhang et al., 2010). Thus, visual and tactile learning may not be very different in specificity, unlike earlier views (Sathian, 2005).
Lack of evidence for sensory representational plasticity
Spatially selective somatosensory cortical responses in the PCS and OP3 (corresponding to Brodmann's area 2 of S1 and the ventral somatosensory area, respectively) were present in both initial and final scan sessions, without a significant task × session interaction. Tactile hyperacuity probably depends on spatial shifts in the profile of active slowly adapting type I, and possibly rapidly adapting, afferent populations (Wheat et al., 1995; Sathian and Zangaladze, 1998). Thus, learning on our tactile hyperacuity task can be expected to be associated with resolution of smaller spatial shifts in the corresponding peripheral neural populations. If S1 representations are similar to peripheral representations, an increase in the magnitude of spatial task selectivity would not be expected with learning. However, stimulus representations undergo transformation in S1 from peripheral representations that are isomorphic with stimuli (Phillips et al., 1988; Salinas et al., 2000). Such transformed representations might show learning-related changes that could be reflected in BOLD signal changes: we did not, however, find any such changes on either whole-brain or ROI analyses, at least in our relatively small sample size of 10 participants. Consistent with our findings, a recent study of perceptual learning in visual orientation discrimination found no changes in BOLD signal magnitude in early visual cortex but reported subtler visual cortical plasticity using a signal detection analysis of orientation-selective voxel responses (Jehee et al., 2012). Thus, other fMRI methods (e.g., based on multivoxel pattern analysis, or fine-grained analysis of digit maps; Duncan and Boynton, 2007) might demonstrate somatosensory cortical plasticity in our task, as might methods using alternative modalities, such as electrophysiology. Indeed, somatosensory cortical plasticity occurs in other tasks (see above), and changes in both sensory representations and decision processes may be relevant (Bejjanki et al., 2011; Mayhew et al., 2012).
Task × session interactions were also absent in the FEF and IPS regions that were spatially selective in both sessions, implicating these regions in processes related to task performance (Stilla et al., 2007) but not in perceptual learning of our task. Few perceptual learning studies have investigated connectivity changes (Schwartz et al., 2002; Mukai et al., 2007; Lewis et al., 2009; Powers et al., 2012). Under the sensory representation hypothesis, connectivity changes would be expected to focus on somatosensory cortex. Contrary to this prediction, somatosensory cortical areas were involved in relatively few paths displaying training-induced changes in task-specific weights. Although our activation and connectivity findings cannot exclude a role for sensory representational changes, they do indicate that such changes are much less prominent than those in extrasensory regions.
Evidence favoring reweighting of perceptual readout
Importantly, we found task-specific interactions resulting from greater spatially selective activations, after training on the spatial task, only in areas implicated in motor and/or decision processes. The human anterior insula exhibits decision-related, effector-independent signals in a random-dot motion direction discrimination task (Liu and Pleskac, 2011). The pre-SMA is part of medial premotor cortex, which is an important node in the decision-process network associated with vibrotactile detection and discrimination in macaques (Romo and de Lafuente, 2012). Further, the human pre-SMA and other parts of medial prefrontal cortex are involved in decision-making (Goñi et al., 2011). Similarly, the putamen is another motor structure that plays a role in human decision processes (Balleine et al., 2007; Kühn et al., 2011) and specifically in decision processes related to tactile discrimination in macaques (Merchant et al., 1997). Its involvement in tactile learning may relate to its function in automatization during motor learning (Costa, 2007). The cerebellum is also a motor structure implicated in decision-making (Guggisberg et al., 2008). Of the thalamic nuclei in the region displaying a significant interaction effect, VA and VL are motor nuclei connected with motor cortical regions, the basal ganglia, and the cerebellum (Saper et al., 2000), whereas the MD nucleus connects to prefrontal cortex (Jakab et al., 2012).
The emergence of decisions in sensory tasks depends on a distributed neural network, with progression from responses reflecting sensory encoding in sensory areas to decision output in subcortical nuclei and in premotor, prefrontal, and parietal cortical areas (Sugrue et al., 2005; Romo and de Lafuente, 2012). Although more work is needed to define the function of each of these brain regions in decision processes across various tasks, the activations found in the present study support the hypothesis that decision-level reweighting of perceptual readout underlies perceptual learning (i.e., decision processes become more sensitive to smaller sensory signals). Additionally, the only region whose task-specific BOLD signal changes were found to correlate with psychophysical changes in discrimination threshold across participants was a rostral anterior cingulate cortical focus. This region is also implicated in decision processes (Litt et al., 2011; Zhu et al., 2012), although our focus exhibited a greater negative BOLD response for the spatial than the temporal task, with greater threshold change correlating with a decrease of this negative response. Negative BOLD responses reflect decreased cerebral blood flow at the cortical surface with a paradoxically increased cerebral blood volume in mid-layers; although the underlying physiology is incompletely understood, activity of inhibitory neurons is a possibility (Goense et al., 2012). If so, greater decrease in activity of such inhibitory neurons may be correlated with greater threshold change, but this is speculative at this point.
Further evidence for decision-level changes comes from our novel multivariate analysis of effective connectivity, based on calculated neuronal responses after hemodynamic deconvolution. Although perceptual reweighting has been modeled before (Petrov et al., 2005; Law and Gold, 2009; Bejjanki et al., 2011; Huang et al., 2012), it has not been evaluated empirically using studies of connectivity. The majority of paths displaying task-specific increases or decreases in weight after training involved posterior parietal, prefrontal, or subcortical regions implicated in motor and/or decision processes. Most paths whose weights increased after training had subcortical sources whose spatial task selectivity increased with training, whereas most paths decreasing in weight after training originated in neocortical loci that were spatially selective but whose selectivity did not change with training. This is consistent with increasing involvement of subcortical systems during automatization of task-specific processes in tactile learning (present study) as in motor learning (Doyon and Benali, 2005).
Also, all but one of the 10 plastic paths involving somatosensory cortex connected to one of the motor/decision regions. Some paths showing decreased weight after training linked a somatosensory cortical region and IPS sites implicated in visual attention. Because studies of visual learning reported changes in connectivity between visual cortical regions and frontoparietal attentional control centers (Mukai et al., 2007; Lewis et al., 2009), the observed neuroplasticity could relate to attentional processes. However, a detailed study found no evidence for tactile attention-selective responses in these frontoparietal regions (Burton et al., 2008). Other studies did find equivalent responses for tactile and visual spatial attention in IPS regions near our aIPS sites (Macaluso et al., 2002, 2003). However, in the present study, these aIPS regions did not show significant task-specific changes in connectivity with somatosensory cortical regions, nor did they show significant task-specific changes in activation between sessions. Hence, it appears more likely that the plastic connections between somatosensory and dorsal parietal regions found here represent decision-level changes. Thus, our effective connectivity data argue for the reweighting of perceptual readout by decision processes as a key mechanism mediating tactile spatial learning. This is consistent with a growing body of literature on visual learning (Petrov et al., 2005; Law and Gold, 2008; Bejjanki et al., 2011; Huang et al., 2012).
In conclusion, perceptual learning on a tactile hyperacuity task was associated with prominent activation and connectivity changes in subcortical and anterior neocortical regions involved in motor and/or decision processes. Importantly, these neuroplastic changes were specific for the trained spatial task relative to the control temporal task. Moreover, the activation changes were absent in a control group of participants tested twice without intervening training; this group also did not manifest perceptual learning. Together, these findings provide strong support for the hypothesis that the critical neuroplasticity mediating perceptual learning involves perceptual readout by decision networks. This hypothesis is consonant with the growing shift away from strictly modular models of the brain toward conceptions embodying complex network interactions underlying even simple tasks (Sporns, 2011). The convergence of our findings on tactile learning with an expanding body of literature on visual learning reconciles discrepancies in the earlier literature on perceptual learning.
Footnotes
This work was supported by National Institutes of Health Grants R01EY12440 and K24EY17332 to K.S. K.S. was also supported by the Veterans Administration. We thank Erica Mariola and Naresh Jegadeesh for behavioral data acquisition and recording and Dale Rice for building and maintaining the stimulator used.
The authors declare no competing financial interests.
References
- Abler B, Roebroeck A, Goebel R, Höse A, Schönfeldt-Lecuona C, Hole G, Walter H. Investigating directed influences between activated brain areas in a motor-response task using fMRI. Magn Reson Imaging. 2006;24:181–185. doi: 10.1016/j.mri.2005.10.022. [DOI] [PubMed] [Google Scholar]
- Alain C, Snyder JS, He Y, Reinke KS. Changes in auditory cortex parallel rapid perceptual learning. Cereb Cortex. 2007;17:1074–1084. doi: 10.1093/cercor/bhl018. [DOI] [PubMed] [Google Scholar]
- Arnold M, Miltner W, Witte H, Bauer R, Braun C. Adaptive AR modeling of nonstationary time series by means of Kalman filtering. IEEE Trans BME. 1998;45:553–562. doi: 10.1109/10.668741. [DOI] [PubMed] [Google Scholar]
- Balleine BW, Delgado MR, Hikosaka O. The role of the dorsal striatum in reward and decision-making. J Neurosci. 2007;27:8161–8165. doi: 10.1523/JNEUROSCI.1554-07.2007. [DOI] [PMC free article] [PubMed] [Google Scholar]
- Bao M, Yang L, Rios C, He B, Engel SA. Perceptual learning increases the strength of the earliest signals in visual cortex. J Neurosci. 2010;30:15080–15084. doi: 10.1523/JNEUROSCI.5703-09.2010. [DOI] [PMC free article] [PubMed] [Google Scholar]
- Bejjanki VR, Beck JM, Lu ZL, Pouget A. Perceptual learning as improved probabilistic inference in early sensory areas. Nat Neurosci. 2011;14:642–648. doi: 10.1038/nn.2796. [DOI] [PMC free article] [PubMed] [Google Scholar]
- Bianchi AM, Marchetta E, Tana MG, Tettamanti M, Rizzo G. Frequency-based approach to the study of semantic brain networks connectivity. J Neurosci Methods. 2013;212:181–189. doi: 10.1016/j.jneumeth.2012.10.005. [DOI] [PubMed] [Google Scholar]
- Burton H, Sinclair RJ, McLaren DG. Cortical network for vibrotactile attention: a fMRI study. Hum Brain Mapp. 2008;29:207–221. doi: 10.1002/hbm.20384. [DOI] [PMC free article] [PubMed] [Google Scholar]
- Costa RM. Plastic corticostriatal circuits for action learning. Ann N Y Acad Sci. 2007;1104:172–191. doi: 10.1196/annals.1390.015. [DOI] [PubMed] [Google Scholar]
- Crist RE, Kapadia MK, Westheimer G, Gilbert CD. Perceptual learning of spatial localization: specificity for orientation, position, and context. J Neurophysiol. 1997;78:2889–2894. doi: 10.1152/jn.1997.78.6.2889. [DOI] [PubMed] [Google Scholar]
- David O, Guillemain I, Saillet S, Reyt S, Deransart C, Segebarth C, Depaulis A. Identifying neural drivers with functional MRI: an electrophysiological validation. PLoS Biol. 2008;6:2683–2697. doi: 10.1371/journal.pbio.0060315. [DOI] [PMC free article] [PubMed] [Google Scholar]
- Deshpande G, Hu X, Stilla R, Sathian K. Effective connectivity during haptic perception: a study using Granger causality analysis of functional magnetic resonance imaging data. Neuroimage. 2008;40:1807–1814. doi: 10.1016/j.neuroimage.2008.01.044. [DOI] [PMC free article] [PubMed] [Google Scholar]
- Deshpande G, LaConte S, James GA, Peltier S, Hu X. Multivariate Granger causality analysis of fMRI data. Hum Brain Mapp. 2009;30:1361–1373. doi: 10.1002/hbm.20606. [DOI] [PMC free article] [PubMed] [Google Scholar]
- Deshpande G, Sathian K, Hu X. Assessing and compensating for zero-lag correlation effects in time-lagged Granger causality analysis of fMRI. IEEE Trans BME. 2010a;57:1446–1456. doi: 10.1109/TBME.2009.2037808. [DOI] [PMC free article] [PubMed] [Google Scholar]
- Deshpande G, Sathian K, Hu X. Effect of hemodynamic variability on Granger causality analysis of fMRI. Neuroimage. 2010b;52:884–896. doi: 10.1016/j.neuroimage.2009.11.060. [DOI] [PMC free article] [PubMed] [Google Scholar]
- Deshpande G, Hu X, Lacey S, Stilla R, Sathian K. Object familiarity modulates effective connectivity during haptic shape perception. Neuroimage. 2010c;49:1991–2000. doi: 10.1016/j.neuroimage.2009.08.052. [DOI] [PMC free article] [PubMed] [Google Scholar]
- Ding Y, Song Y, Fan S, Qu Z, Chen L. Specificity and generalization of visual perceptual learning in humans: an event-related potential study. Neuroreport. 2003;14:587–590. doi: 10.1097/00001756-200303240-00012. [DOI] [PubMed] [Google Scholar]
- Doyon J, Benali H. Reorganization and plasticity in the adult brain during learning of motor skills. Curr Opin Neurobiol. 2005;15:161–167. doi: 10.1016/j.conb.2005.03.004. [DOI] [PubMed] [Google Scholar]
- Duncan RO, Boynton GM. Tactile hyperacuity thresholds correlate with finger maps in primary somatosensory cortex (S1) Cereb Cortex. 2007;17:2878–2891. doi: 10.1093/cercor/bhm015. [DOI] [PubMed] [Google Scholar]
- Duvernoy HM. The human brain: surface, blood supply and three-dimensional sectional anatomy. New York: Springer; 1999. [Google Scholar]
- Eickhoff SB, Grefkes C, Zilles K, Fink GR. The somatotopic organization of cytoarchitectonic areas on the human parietal operculum. Cereb Cortex. 2007;17:1800–1811. doi: 10.1093/cercor/bhl090. [DOI] [PubMed] [Google Scholar]
- Fiorentini A, Berardi N. Perceptual learning specific for orientation and spatial frequency. Nature. 1980;287:43–44. doi: 10.1038/287043a0. [DOI] [PubMed] [Google Scholar]
- Furmanski CS, Schluppeck D, Engel SA. Learning strengthens the response of primary visual cortex to simple patterns. Curr Biol. 2004;14:573–578. doi: 10.1016/j.cub.2004.03.032. [DOI] [PubMed] [Google Scholar]
- Ghose GM, Yang T, Maunsell JH. Physiological correlates of perceptual learning in monkey V1 and V2. J Neurophysiol. 2002;87:1867–1888. doi: 10.1152/jn.00690.2001. [DOI] [PubMed] [Google Scholar]
- Gibson EJ. Principles of perceptual learning and development. New York: Meredith; 1969. [Google Scholar]
- Gilbert CD, Li W, Piech V. Perceptual learning and adult cortical plasticity. J Physiol. 2009;587:2743–2751. doi: 10.1113/jphysiol.2009.171488. [DOI] [PMC free article] [PubMed] [Google Scholar]
- Goense J, Merkle H, Logothetis NK. High-resolution fMRI reveals laminar differences in neurovascular coupling between positive and negative BOLD responses. Neuron. 2012;76:629–639. doi: 10.1016/j.neuron.2012.09.019. [DOI] [PMC free article] [PubMed] [Google Scholar]
- Goñi J, Aznárez-Sanado M, Arrondo G, Fernández-Seara M, Loayza FR, Heukamp FH, Pastor MA. The neural substrate and functional integration of uncertainty in decision making: an information theory approach. PLoS ONE. 2011;6:e17408. doi: 10.1371/journal.pone.0017408. [DOI] [PMC free article] [PubMed] [Google Scholar]
- Granger CWJ. Investigating causal relations by econometric models and cross-spectral methods. Econometrica. 1969;37:424–438. [Google Scholar]
- Grefkes C, Geyer S, Schormann T, Roland P, Zilles K. Human somatosensory area 2: observer-independent cytoarchitectonic mapping, interindividual variability, and population map. Neuroimage. 2001;14:617–631. doi: 10.1006/nimg.2001.0858. [DOI] [PubMed] [Google Scholar]
- Guggisberg AG, Dalal SS, Findlay AM, Nagarajan SS. High-frequency oscillations in distributed neural networks reveal the dynamics of human decision making. Front Hum Neurosci. 2007;1:14. doi: 10.3389/neuro.09.014.2007. [DOI] [PMC free article] [PubMed] [Google Scholar]
- Hampstead BM, Stringer AY, Stilla RF, Deshpande G, Hu X, Moore AB, Sathian K. Activation and effective connectivity changes following explicit-memory training for face-name pairs in patients with mild cognitive impairment: a pilot study. Neurorehabil Neural Repair. 2011;25:210–222. doi: 10.1177/1545968310382424. [DOI] [PMC free article] [PubMed] [Google Scholar]
- Hampstead BM, Stringer AY, Stilla RF, Giddens M, Sathian K. Mnemonic strategy training partially restores hippocampal activity in patients with mild cognitive impairment. Hippocampus. 2012;22:1652–1658. doi: 10.1002/hipo.22006. [DOI] [PMC free article] [PubMed] [Google Scholar]
- Handwerker DA, Ollinger JM, D'Esposito M. Variation of BOLD hemodynamic responses across subjects and brain regions and their effects on statistical analyses. Neuroimage. 2004;21:1639–1651. doi: 10.1016/j.neuroimage.2003.11.029. [DOI] [PubMed] [Google Scholar]
- Harris JA, Petersen RS, Diamond ME. Distribution of tactile learning and its neural basis. Proc Natl Acad Sci U S A. 1999;96:7587–7591. doi: 10.1073/pnas.96.13.7587. [DOI] [PMC free article] [PubMed] [Google Scholar]
- Harris JA, Harris IM, Diamond ME. The topography of tactile learning in humans. J Neurosci. 2001;21:1056–1061. doi: 10.1523/JNEUROSCI.21-03-01056.2001. [DOI] [PMC free article] [PubMed] [Google Scholar]
- Havlicek M, Friston KJ, Jan J, Brazdil M, Calhoun VD. Dynamic modeling of neuronal responses in fMRI using cubature Kalman filtering. Neuroimage. 2011;56:2109–2128. doi: 10.1016/j.neuroimage.2011.03.005. [DOI] [PMC free article] [PubMed] [Google Scholar]
- Huang C-B, Lu Z-L, Dosher BA. Co-learning analysis of two perceptual learning tasks with identical input stimuli supports the reweighting hypothesis. Vis Res. 2012;61:25–32. doi: 10.1016/j.visres.2011.11.003. [DOI] [PMC free article] [PubMed] [Google Scholar]
- Jakab A, Blanc R, Berényi EL. Mapping changes of in vivo connectivity patterns in the human mediodorsal thalamus: correlations with higher cognitive and executive functions. Brain Imaging Behav. 2012;6:472–483. doi: 10.1007/s11682-012-9172-5. [DOI] [PubMed] [Google Scholar]
- Jehee JF, Ling S, Swisher JD, van Bergen RS, Tong F. Perceptual learning selectively refines orientation representations in early visual cortex. J Neurosci. 2012;32:16747–16753. doi: 10.1523/JNEUROSCI.6112-11.2012. [DOI] [PMC free article] [PubMed] [Google Scholar]
- Kaas AL, van de Ven V, Reithler J, Goebel R. Tactile perceptual learning: learning curves and transfer to the contralateral finger. Exp Brain Res. 2013;224:477–488. doi: 10.1007/s00221-012-3329-8. [DOI] [PubMed] [Google Scholar]
- Kühn S, Schmiedek F, Schott B, Ratcliff R, Heinze HJ, Düzel E, Lindenberger U, Lövden M. Brain areas consistently linked to individual differences in perceptual decision-making in younger as well as older adults before and after training. J Cogn Neurosci. 2011;23:2147–2158. doi: 10.1162/jocn.2010.21564. [DOI] [PubMed] [Google Scholar]
- Law C-T, Gold JI. Neural correlates of perceptual learning in a sensory-motor, but not a sensory, cortical area. Nat Neurosci. 2008;11:505–513. doi: 10.1038/nn2070. [DOI] [PMC free article] [PubMed] [Google Scholar]
- Law C-T, Gold JI. Reinforcement learning can account for associative and perceptual learning on a visual-decision task. Nat Neurosci. 2009;12:655–663. doi: 10.1038/nn.2304. [DOI] [PMC free article] [PubMed] [Google Scholar]
- Lewis CM, Baldassarre A, Committeri G, Romani GL, Corbetta M. Learning sculpts the spontaneous activity of the resting human brain. Proc Natl Acad Sci U S A. 2009;106:17558–17563. doi: 10.1073/pnas.0902455106. [DOI] [PMC free article] [PubMed] [Google Scholar]
- Litt A, Plassmann H, Shiv B, Rangel A. Dissociating valuation and saliency signals during decision-making. Cereb Cortex. 2011;21:95–102. doi: 10.1093/cercor/bhq065. [DOI] [PubMed] [Google Scholar]
- Liu T, Pleskac TJ. Neural correlates of evidence accumulation in a perceptual decision task. J Neurophysiol. 2011;106:2383–2398. doi: 10.1152/jn.00413.2011. [DOI] [PubMed] [Google Scholar]
- Macaluso E, Frith CD, Driver J. Directing attention to locations and to sensory modalities: multiple levels of selective processing revealed with PET. Cereb Cortex. 2002;12:357–368. doi: 10.1093/cercor/12.4.357. [DOI] [PubMed] [Google Scholar]
- Macaluso E, Eimer M, Frith CD, Driver J. Preparatory states in crossmodal spatial attention: spatial specificity and possible control mechanisms. Exp Brain Res. 2003;149:62–74. doi: 10.1007/s00221-002-1335-y. [DOI] [PubMed] [Google Scholar]
- Mayhew SD, Li S, Kourtzi Z. Learning acts on distinct processes for visual form perception in the human brain. J Neurosci. 2012;32:775–786. doi: 10.1523/JNEUROSCI.2033-11.2012. [DOI] [PMC free article] [PubMed] [Google Scholar]
- Merchant H, Zainos A, Hernández A, Salinas E, Romo R. Functional properties of primate putamen neurons during the categorization of tactile stimuli. J Neurophysiol. 1997;77:1132–1154. doi: 10.1152/jn.1997.77.3.1132. [DOI] [PubMed] [Google Scholar]
- Mukai I, Kim D, Fukunaga M, Japee S, Marrett S, Ungerleider LG. Activations in visual and attention-related areas predict and correlate with the degree of perceptual learning. J Neurosci. 2007;27:11401–11411. doi: 10.1523/JNEUROSCI.3002-07.2007. [DOI] [PMC free article] [PubMed] [Google Scholar]
- Nagarajan SS, Blake DT, Wright BA, Byl N, Merzenich MM. Practice-related improvements in somatosensory interval discrimination are temporally specific but generalize across skin location, hemisphere and modality. J Neurosci. 1998;18:1559–1570. doi: 10.1523/JNEUROSCI.18-04-01559.1998. [DOI] [PMC free article] [PubMed] [Google Scholar]
- Offe K, Chevalier SJ, Sathian K. Intermanual and interdigit transfer of tactile learning. Soc Neurosci Abstr. 2000;26:264.9. [Google Scholar]
- Petrov AA, Dosher BA, Lu Z-L. The dynamics of perceptual learning: an incremental reweighting model. Psychol Rev. 2005;112:715–743. doi: 10.1037/0033-295X.112.4.715. [DOI] [PubMed] [Google Scholar]
- Phillips JR, Johnson KO, Hsiao SS. Spatial pattern representation and transformation in monkey somatosensory cortex. Proc Natl Acad Sci U S A. 1988;85:1317–1321. doi: 10.1073/pnas.85.4.1317. [DOI] [PMC free article] [PubMed] [Google Scholar]
- Powers AR, 3rd, Hevey MA, Wallace MT. Neural correlates of multisensory perceptual learning. J Neurosci. 2012;32:6263–6274. doi: 10.1523/JNEUROSCI.6138-11.2012. [DOI] [PMC free article] [PubMed] [Google Scholar]
- Raczkowski D, Kalat JW, Nebes R. Reliability and validity of some handedness questionnaire items. Neuropsychologia. 1974;12:43–47. doi: 10.1016/0028-3932(74)90025-6. [DOI] [PubMed] [Google Scholar]
- Raemaekers M, du Plessis S, Ramsey NF, Weusten JM, Vink M. Test-retest variability underlying fMRI measurements. Neuroimage. 2012;60:717–727. doi: 10.1016/j.neuroimage.2011.11.061. [DOI] [PubMed] [Google Scholar]
- Raiguel S, Vogels R, Mysore SG, Orban GA. Learning to see the difference specifically alters the most informative V4 neurons. J Neurosci. 2006;26:6589–6602. doi: 10.1523/JNEUROSCI.0457-06.2006. [DOI] [PMC free article] [PubMed] [Google Scholar]
- Ramachandran VS. Learning-like phenomena in stereopsis. Nature. 1976;262:382–384. doi: 10.1038/262382a0. [DOI] [PubMed] [Google Scholar]
- Ramachandran VS, Braddick O. Orientation-specific learning in stereopsis. Perception. 1973;2:371–376. doi: 10.1068/p020371. [DOI] [PubMed] [Google Scholar]
- Recanzone GH, Jenkins WM, Hradek GT, Merzenich MM. Progressive improvement in discriminative abilities in adult owl monkeys performing a tactile frequency discrimination task. J Neurophysiol. 1992a;67:1015–1030. doi: 10.1152/jn.1992.67.5.1015. [DOI] [PubMed] [Google Scholar]
- Recanzone GH, Merzenich MM, Jenkins WM. Frequency discrimination training engaging a restricted skin surface results in an emergence of a cutaneous response zone in cortical area 3a. J Neurophysiol. 1992b;67:1057–1070. doi: 10.1152/jn.1992.67.5.1057. [DOI] [PubMed] [Google Scholar]
- Recanzone GH, Merzenich MM, Jenkins WM, Grajski KA, Dinse HR. Topographic reorganization of the hand representation in cortical area 3b of owl monkeys trained in a frequency-discrimination task. J Neurophysiol. 1992c;67:1031–1056. doi: 10.1152/jn.1992.67.5.1031. [DOI] [PubMed] [Google Scholar]
- Recanzone GH, Merzenich MM, Schreiner CE. Changes in the distributed temporal response properties of SI cortical neurons reflect improvements in performance on a temporally based tactile discrimination task. J Neurophysiol. 1992d;67:1071–1091. doi: 10.1152/jn.1992.67.5.1071. [DOI] [PubMed] [Google Scholar]
- Recanzone GH, Schreiner CE, Merzenich MM. Plasticity in the frequency representation of primary auditory cortex following discrimination training in adult owl monkeys. J Neurosci. 1993;13:87–103. doi: 10.1523/JNEUROSCI.13-01-00087.1993. [DOI] [PMC free article] [PubMed] [Google Scholar]
- Roebroeck A, Formisano E, Goebel R. Mapping directed influence over the brain using Granger causality and fMRI. Neuroimage. 2005;25:230–242. doi: 10.1016/j.neuroimage.2004.11.017. [DOI] [PubMed] [Google Scholar]
- Romo R, de Lafuente V. Conversion of sensory signals into perceptual decisions. Prog Neurobiol. 2012 doi: 10.1016/j.pneurobio.2012.03.007. Advance online publication. Retrieved March 28, 2012. [DOI] [PubMed] [Google Scholar]
- Salinas E, Hernández A, Zainos A, Romo R. Periodicity and firing rate as candidate neural codes for the frequency of vibrotactile stimuli. J Neurosci. 2000;20:5503–5515. doi: 10.1523/JNEUROSCI.20-14-05503.2000. [DOI] [PMC free article] [PubMed] [Google Scholar]
- Saper CB, Iversen S, Frackowiak R. Integration of sensory and motor function: the association areas of the cerebral cortex and the cognitive capabilities of the brain. In: Kandel ER, Schwartz JH, Jessell TM, editors. Principles of neural science. New York: McGraw-Hill; 2000. pp. 349–380. [Google Scholar]
- Sathian K. Perceptual learning and referral in the tactile system. In: Ebner FF, editor. Neural plasticity in adult somatic sensorimotor systems. Boca Raton, FL: CRC; 2005. [Google Scholar]
- Sathian K, Zangaladze A. Tactile spatial acuity at the human fingertip and lip: bilateral symmetry and inter-digit variability. Neurology. 1996;46:1464–1466. doi: 10.1212/wnl.46.5.1464. [DOI] [PubMed] [Google Scholar]
- Sathian K, Zangaladze A. Tactile learning is task-specific but transfers between fingers. Percept Psychophys. 1997;59:119–128. doi: 10.3758/bf03206854. [DOI] [PubMed] [Google Scholar]
- Sathian K, Zangaladze A. Perceptual learning in tactile hyperacuity: complete intermanual transfer but limited retention. Exp Brain Res. 1998;118:131–134. doi: 10.1007/s002210050263. [DOI] [PubMed] [Google Scholar]
- Sathian K, Lacey S, Stilla R, Gibson GO, Deshpande G, Hu X, Laconte S, Glielmi C. Dual pathways for haptic and visual perception of spatial and texture information. Neuroimage. 2011;57:462–475. doi: 10.1016/j.neuroimage.2011.05.001. [DOI] [PMC free article] [PubMed] [Google Scholar]
- Schiltz C, Bodart JM, Dubois S, Dejardin S, Michel C, Roucoux A, Crommelinck M, Orban GA. Neuronal mechanisms of perceptual learning: changes in human brain activity with training in orientation discrimination. Neuroimage. 1999;9:46–62. doi: 10.1006/nimg.1998.0394. [DOI] [PubMed] [Google Scholar]
- Schoups A, Vogels R, Qian N, Orban G. Practising orientation identification improves orientation coding in V1 neurons. Nature. 2001;412:549–553. doi: 10.1038/35087601. [DOI] [PubMed] [Google Scholar]
- Schwartz S, Maquet P, Frith C. Neural correlates of perceptual learning: a functional MRI study of visual texture discrimination. Proc Natl Acad Sci U S A. 2002;99:17137–17142. doi: 10.1073/pnas.242414599. [DOI] [PMC free article] [PubMed] [Google Scholar]
- Shikata E, McNamara A, Sprenger A, Hamzei F, Glauche V, Büchel C, Binkofski F. Localization of human intraparietal areas AIP, CIP, and LIP using surface orientation and saccadic eye movement tasks. Hum Brain Mapp. 2008;29:411–421. doi: 10.1002/hbm.20396. [DOI] [PMC free article] [PubMed] [Google Scholar]
- Song Y, Ding Y, Fan S, Chen L. An event-related potential study on visual perceptual learning under short-term and long-term training conditions. Neuroreport. 2002;13:2053–2057. doi: 10.1097/00001756-200211150-00013. [DOI] [PubMed] [Google Scholar]
- Spengler F, Roberts TP, Poeppel D, Byl N, Wang X, Rowley HA, Merzenich MM. Learning transfer and neuronal plasticity in humans trained in tactile discrimination. Neurosci Lett. 1997;232:151–154. doi: 10.1016/s0304-3940(97)00602-2. [DOI] [PubMed] [Google Scholar]
- Sporns O. Networks of the brain. Cambridge, MA: MIT; 2011. [Google Scholar]
- Stilla R, Sathian K. Selective visuo-haptic processing of shape and texture. Hum Brain Mapp. 2008;29:1123–1138. doi: 10.1002/hbm.20456. [DOI] [PMC free article] [PubMed] [Google Scholar]
- Stilla R, Deshpande G, LaConte S, Hu X, Sathian K. Posteromedial parietal cortical activity and inputs predict tactile spatial acuity. J Neurosci. 2007;27:11091–11102. doi: 10.1523/JNEUROSCI.1808-07.2007. [DOI] [PMC free article] [PubMed] [Google Scholar]
- Stilla R, Hanna R, Hu X, Mariola E, Deshpande G, Sathian K. Neural processing underlying tactile microspatial discrimination in the blind: a functional magnetic resonance imaging study. J Vis. 2008;8(10):13, 1–19. doi: 10.1167/8.10.13. [DOI] [PMC free article] [PubMed] [Google Scholar]
- Sugrue LP, Corrado GS, Newsome WT. Choosing the greater of two goods: neural currencies for valuation and decision making. Nat Rev Neurosci. 2005;6:363–375. doi: 10.1038/nrn1666. [DOI] [PubMed] [Google Scholar]
- Swisher JD, Halko MA, Merabet LB, McMains SA, Somers DC. Visual topography of human intraparietal sulcus. J Neurosci. 2007;27:5326–5337. doi: 10.1523/JNEUROSCI.0991-07.2007. [DOI] [PMC free article] [PubMed] [Google Scholar]
- Talairach J, Tournoux P. Co-planar stereotaxic atlas of the brain. New York: Thieme; 1988. [Google Scholar]
- Tovee MJ, Rolls ET, Ramachandran VS. Rapid visual learning in neurones of the primate temporal visual cortex. Neuroreport. 1996;7:2757–2760. doi: 10.1097/00001756-199611040-00070. [DOI] [PubMed] [Google Scholar]
- Van Boven RW, Johnson KO. The limit of tactile spatial resolution in humans: grating orientation discrimination at the lip, tongue and finger. Neurology. 1994;44:2361–2366. doi: 10.1212/wnl.44.12.2361. [DOI] [PubMed] [Google Scholar]
- van Wassenhove V, Nagarajan SS. Auditory cortical plasticity in learning to discriminate modulation rate. J Neurosci. 2007;27:2663–2672. doi: 10.1523/JNEUROSCI.4844-06.2007. [DOI] [PMC free article] [PubMed] [Google Scholar]
- Vega-Bermudez F, Johnson KO. Differences in spatial acuity between digits. Neurology. 2001;56:1389–1391. doi: 10.1212/wnl.56.10.1389. [DOI] [PubMed] [Google Scholar]
- Westheimer G. Spatial frequency and light-spread descriptions of visual acuity and hyperacuity. J Opt Soc Am A. 1977;67:207–212. doi: 10.1364/josa.67.000207. [DOI] [PubMed] [Google Scholar]
- Wheat HE, Goodwin AW, Browning AS. Tactile resolution: peripheral neural mechanisms underlying the human capacity to determine positions of objects contacting the fingerpad. J Neurosci. 1995;15:5582–5595. doi: 10.1523/JNEUROSCI.15-08-05582.1995. [DOI] [PMC free article] [PubMed] [Google Scholar]
- Xiao L-Q, Zhang J0Y, Wang R, Klein SA, Levi DM, Yu C. Complete transfer of perceptual learning across retinal locations enabled by double training. Curr Biol. 2008;18:1922–1926. doi: 10.1016/j.cub.2008.10.030. [DOI] [PMC free article] [PubMed] [Google Scholar]
- Yang T, Maunsell JH. The effect of perceptual learning on neuronal responses in monkey visual area V4. J Neurosci. 2004;24:1617–1626. doi: 10.1523/JNEUROSCI.4442-03.2004. [DOI] [PMC free article] [PubMed] [Google Scholar]
- Yotsumoto Y, Watanabe T, Sasaki Y. Different dynamics of performance and brain activation in the time course of perceptual learning. Neuron. 2008;57:827–833. doi: 10.1016/j.neuron.2008.02.034. [DOI] [PMC free article] [PubMed] [Google Scholar]
- Zhang J-Y, Zhang G-L, Xiao L-Q, Klein SA, Levi DM, Yu C. Rule-based learning explains visual perceptual learning and its specificity and transfer. J Neurosci. 2010;30:12323–12328. doi: 10.1523/JNEUROSCI.0704-10.2010. [DOI] [PMC free article] [PubMed] [Google Scholar]
- Zhang M, Weisser VD, Stilla R, Prather SC, Sathian K. Multisensory cortical processing of object shape and its relation to mental imagery. Cogn Affect Behav Neurosci. 2004;4:251–259. doi: 10.3758/cabn.4.2.251. [DOI] [PubMed] [Google Scholar]
- Zhu L, Mathewson KE, Hsu M. Dissociable neural representations of reinforcement and belief prediction errors underlie strategic learning. Proc Natl Acad Sci U S A. 2012;109:1419–1424. doi: 10.1073/pnas.1116783109. [DOI] [PMC free article] [PubMed] [Google Scholar]
- Zohary E, Celebrini S, Britten KH, Newsome WT. Neuronal plasticity that underlies improvement in perceptual performance. Science. 1994;263:1289–1292. doi: 10.1126/science.8122114. [DOI] [PubMed] [Google Scholar]