

Abstract
Motivational interviewing (MI) is a directive, client-centered therapeutic method employed in the treatment of substance abuse, with strong evidence of effectiveness. To date, the sole mechanism of action in MI with any consistent empirical support is “change talk” (CT), which is generally defined as client within-session speech in support of a behavior change. “Sustain talk” (ST) incorporates speech in support of the status quo. MI maintains that during treatment, clients essentially talk themselves into change. Multiple studies have now supported this theory, linking within-session speech to substance use outcomes. Although a causal chain has been established linking therapist behavior, client change talk, and substance use outcome, the neural substrate of change talk has been largely uncharted. We addressed this gap by measuring neural responses to clients’ own change talk using magnetoencephalography (MEG), a non-invasive neuroimaging technique with excellent spatial and temporal resolution. Following a recorded MI session, MEG was used to measure brain activity while participants heard multiple repetitions of their CT and ST utterances from that session, intermingled and presented in a random order.
Results suggest that CT processing occurs in a right-hemisphere network that includes inferior frontal gyrus, insula, and superior temporal cortex. These results support a representation of change talk at the neural level, consistent with the role of these structures in self-perception. This suggests that during treatment sessions, clinicians who are able to evoke this special kind of language are tapping into neural circuitry that may be essential to behavior change.
Keywords: neuroimaging, motivational interviewing, change talk, magnetoencephalography, mechanisms of behavior change
Introduction
Within psychotherapy, remarkably little study has been made of the neural processes underlying effective talk therapies. Although some authors have recommended neuroimaging studies of therapy components (Carrig, Kolden, & Strauman, 2009; Etkin, Pittenger, Polan, & Kandel, 2005; Gerber & Peterson, 2006; Moras, 2006), neuroimaging and neurodynamic studies have by and large focused upon describing the dysfunctional brain. Aside from the occasional study of neuronal activity during assessment tasks (Bayless, Gaetz, Cheyne, & Taylor, 2006; Phan, et al., 2004; Razumnikova, 2007; Wang, Kakigi, & Hoshiyama, 2001), those few studies evaluating talk therapies have examined brain activity after a course of treatment (McClure, et al., 2007; Paquette, et al., 2003), but have not explored the processes that occur during treatment.
This is surprising given that neuroimaging measures have substantial relationships with treatment outcomes. Clear links between brain function and symptom improvement have been found across a range of therapeutic approaches, including cognitive behavioral therapy (McClure et al., 2007; Siegle, Carter, & Thase, 2006; Paquette et al., 2003; Ritchey, Dolcos, Eddington, Strauman, & Cabeza, 2008; Thase, Fasiczka, Berman, Simons, & Reynolds, 1998), pharmacotherapy (Siegle et al, 2006), and exposure therapy (Peres et al., 2007). Although these studies employed disparate imaging modalities, the results across multiple problem areas support the notion that improvements in psychotherapy can be associated with specific changes in neurological structures and processes.
Given that talk therapies produce measurable neural changes after treatment, an important first step toward understanding these changes would be to measure activity related to specific active ingredients of treatments, particularly those treatments that have shown strong evidence of effectiveness. Motivational interviewing (MI) is a one such treatment, a client-centered therapy that combines a humanistic counseling style with a directive, non-confrontational approach to resolving ambivalence about behavior change. MI is an empirically-supported treatment for substance use disorders; a recent meta-analysis of clinical trials using MI (Hettema, Steele, & Miller, 2005) found an average short-term between-group effect size of d=0.77, decreasing after one year to d=0.30. Over 200 clinical trials of MI have now been published. One analysis (Miller & Wilbourne, 2002) found that motivational enhancement, an adaptation of MI, was ranked second only to brief therapy on cumulative evidence for alcohol use disorders.
Evidence for the effectiveness of MI has accumulated across a range of problematic behaviors (Amrhein, Miller, Yahne, Palmer, & Fulcher, 2003; Golin, et al., 2006; Riekert, Borrelli, Bilderback, & Rand, 2011). Although some studies of substance abuse have reported mixed results (e.g., Walker, Roffman, Stephens, Wakana, & Berghuis, 2006) the bulk of the literature supports the effectiveness of MI in alcohol users (Burke, Arkowitz, & Menchola, 2003; Hettema, et al., 2005; Miller, 1983; Rubak, et al., 2005; Vasilaki, Hosier, & Cox, 2006).
Despite this strong empirical support for the effectiveness of MI in substance abuse treatment, there has been difficulty in determining why MI is effective (Apodaca & Longabaugh, 2009). Multiple mechanisms of action have been tested, to no avail (Morgenstern & McKay, 2007). One promising mechanism of action in MI that has garnered some research support is client change language. Based in social psychological theories including self-efficacy (Bandura, 1977), self-perception (Bem, 1972) and cognitive dissonance (Festinger, 1957), MI maintains that during therapy, clients talk themselves into change (Miller, 1983; Miller & Rollnick, 1992, 2002). By hearing themselves repeatedly verbalize arguments for or against a particular behavior change, clients resolve their ambivalence about that change in the direction of their own speech. The self-perceptual effects of client speech were noted in both the original (Miller, 1983) and later (Miller & Rollnick, 1991, 2002) formulations of MI.
Change language in MI incorporates both positive (change talk) and negative (sustain talk) aspects. Although change talk was initially defined as client speech that recognized alcohol-related problems, concerns about the problem, and recognition of a need to change the behavior (Miller, 1983), later advances included discussions of the advantages of change, the disadvantages of the status quo, optimism for change, or intention to change. The term was ultimately expanded to include client expressions of a desire, ability, reason, need, or commitment to change, as well as expressions of concrete steps clients had taken toward change (e.g., substance use cessation) (Miller, Moyers, Amrhein, & Rollnick, 2006). Sustain talk includes expressions of a desire, ability, reason, need, or commitment to maintain the status quo, as well as expressions of concrete steps clients had taken to maintain the status quo (e.g., continued substance use). Several MI language coding systems have evolved to measure the language of clients and therapists during treatment sessions (Houck, Moyers, Miller, Glynn, & Hallgren, 2010; Martin, Moyers, Houck, Christopher, & Miller, 2005; Miller, 2000), creating straightforward and unbiased operational definitions of client change language for empirical study.
Recent studies investigating change talk reveal the promise of this construct to explain outcomes. In a study of drug use disorders, Amrhein and colleagues (2003) found that the strength of client change talk during MI sessions as rated on a 10-point scale was a significant predictor of drug treatment outcomes; further, this change talk differentiated those who would benefit from MI even in the absence of a main effect of treatment. In the years following the Amrhein study, an array of studies have demonstrated strong relationships between therapist behavior and client behavior (Gaume, Bertholet, Faouzi, Gmel, & Daeppen, 2010; Glynn & Moyers, 2010; Houck & Moyers, 2008; Moyers & Martin, 2006) as well as within-session-client behavior and subsequent outcomes (Aharonovich, Amrhein, Bisaga, Nunes, & Hasin, 2008; Baer, et al., 2008; Bertholet, Faouzi, Gmel, Gaume, & Daeppen; Hodgins, Ching, & McEwen, 2009; Karno, Longabaugh, & Herbeck, 2009; Vader, Walters, Prabhu, Houck, & Field, 2010). Finally, Moyers and colleagues (2009) have demonstrated that client change talk mediates therapist behavior and substance use outcomes. Taken together, these studies support a causal chain in which MI-consistent clinician behaviors produce client change talk during sessions, which in turn increases client motivation to change substance use. It is worth noting that this causal chain for MI is the only one with consistent support in the literature to date.
Knowledge of the neural substrate for change language has significant potential to inform theories of motivational interviewing and behavior change. For instance, well-developed neuroimaging paradigms exist for cognitive dissonance, a construct that was implicated in original formulations of MI. If patterns of brain activity observed for change talk early in the treatment process are consistent with those observed for cognitive dissonance, it would support the notion that the process of change works in part via cognitive dissonance. Insincere change talk is another issue frequently of concern to clinicians -- what happens when change talk is the result of external pressure, rather than the product of a supportive therapeutic interaction? Detection of deception has been explored enthusiastically via neuroimaging (Johnson & Rosenfeld, 1992; Langleben et al. 2002; Seth, Iversen, & Edelman, 2006) and has a substantial published literature (for a review, see Abe, 2011). If activity related to insincere or externally-prompted change talk is similar to activity observed in deception detection paradigms, clinicians and interventionists working with mandated clientele would know to avoid heavy-handed strategies in favor of a focus on autonomy support. If the neural substrate of change talk were known, specific refinements based on these and other insights could be made to MI, targeting these brain regions and processes more precisely in order to achieve the most efficient and powerful expressions of change talk, which could in turn lead to improved substance abuse outcomes.
Although one group (Feldstein Ewing, Filbey, Sabbineni, Chandler, & Hutchison, 2011) has reported brain activity during simultaneous presentation three stimulus types (alcohol taste cues, visual presentation of client language, and auditory presentation of client language) no study to date has measured neural activity evoked by a client’s own change talk as produced in a typical MI session. In this study we gathered change talk utterances from ambivalent drinkers throughout their actual MI sessions, and then replayed these statements to the drinkers while monitoring their brain activity using magnetoencephalography. Our goal was to search for characteristic neural patterns common to hearing one’s own change talk elicited from a therapy session. Two hypotheses were proposed: first, that neural responses to change talk and sustain talk would localize to regions selected a priori including inferior parietal lobule, superior temporal sulcus, Broca’s area, and insula; and second, that neural responses to change talk and sustain talk would differ from each other in individuals who are ambivalent about changing their substance use.
Method
Participants
Participants were ten individuals (mean age 40.0, SD 13.86 years; 30% female, 40% White Hispanic, 30% White Non-Hispanic, 20% Native American, 10% African American) who expressed concern about their substance use during a phone screening but were not seeking formal substance abuse treatment, and with no recent history of such treatment. Participants were recruited using fliers, print ads, online ads, and word of mouth. The recruitment text advertised for adults who were concerned about their drinking but uncertain about making a change. Exclusion criteria included recent use of any drugs other than alcohol or marijuana; diagnosis or evidence of major mental illness, neurological disease, brain injury, or other organic brain disorder; or currently seeking treatment or referral to treatment resources. This population of ambivalent alcohol users was selected because it represents a group of drinkers that is larger and less severely impaired than those actively seeking treatment. This group is also representative of the individuals commonly seen in primary care settings where concern about drinking or drug use might be broached without a desire for abstinence or treatment. Participants were paid $100 for their participation. This dataset represents a subset of the planned sample for the parent study (NIDA R21DA025135), which is currently ongoing.
Measures
Magnetoencephalography (MEG: Cohen, 1968; for reviews, see Baillet, Mosher, & Leahy, 2001; Hämäläinen, Hari, Ilmoniemi, Knuutila, & Lounasmaa, 1993;) is a completely non-invasive neuroimaging technique used to infer the electrical current distribution within the brain by measuring the magnetic fields associated with these currents. MEG provides a direct measure of neuronal activity with excellent temporal and spatial resolution, capturing millisecond changes in current flow and localizing this brain activity with accuracy of 3–5 mm (Leahy, Mosher, Spencer, Huang, & Lewine, 1998; Yamamoto, Williamson, Kaufman, Nicholson, & Llinás, 1988). Rapid data analysis techniques exist to explore the distributed brain activation seen in complex tasks (Stenbacka, Vanni, Uutela, & Hari, 2002). Such methods permit detailed characterization of local and network dynamics in the brain from MEG data (for a review, see Le Van Quyen & Bragin, 2007). These methods were used with a state-of-the-art whole-scalp MEG array to precisely characterize both the stimulus-related responses within the brain that are related to change language offered during an MI session.
Assessments in the computerized assessment battery included demographic information, the Brief Symptom Inventory (BSI 18: Derogatis, 2001), the Stages of Change Readiness and Treatment Eagerness Scale (SOCRATES: Miller & Tonigan, 1996), the Form 90 Quick Feedback Version (Form 90 QFV: Tonigan, Miller, & Brown, 1997), the Inventory of Drug Use Consequences (InDuC-2R3: Tonigan & Miller, 2002), and the Interpersonal Reactivity Index (Davis, 1980), a measure of dispositional empathy including both cognitive and affective aspects. Descriptive statistics on these measures can be found in Table 1.
Table 1.
Descriptive statistics on assessment and language data.
| Measure | Mean | SD |
|---|---|---|
| InDuC | ||
| Physical | 7.60 | 5.13 |
| Interpersonal | 10.70 | 9.74 |
| Intrapersonal | 12.60 | 7.09 |
| Impulse | 9.00 | 5.89 |
| Social | 6.30 | 4.72 |
| Control | 8.60 | 3.06 |
| Total | 46.20 | 29.24 |
| SOCRATES | ||
| Recognition | 25.56 | 6.29 |
| Ambivalence | 14.89 | 3.89 |
| Taking steps | 27.00 | 6.96 |
| BSI* | ||
| Somatization | 48.44 | 20.37 |
| Depression | 56.22 | 23.23 |
| Anxiety | 51.78 | 21.41 |
| General Severity Index | 54.11 | 22.21 |
| IRI | ||
| Fantasy Scale | 14.20 | 3.88 |
| Perspective Taking | 16.00 | 6.34 |
| Empathic Concern | 19.40 | 6.15 |
| Personal Distress | 8.40 | 4.72 |
| Form 90 QFV | ||
| Percent Days Abstinent | 18.22 | 28.01 |
| Percent Heavy Drinking Days | 2.13 | 4.56 |
| Drinks per Drinking Day | 4.05 | 3.59 |
| Age at onset (years) | 14.80 | 6.70 |
| Session length (minutes) | 42.79 | 8.80 |
| Client language counts | ||
| Change talk | 73.10 | 9.27 |
| Sustain talk | 34.90 | 6.64 |
| Percent change talk | 67.71 | 4.69 |
Note. InDuC: Inventory of Drug Use Consequences; SOCRATES = Stages of Change Readiness Scale; IRI = Interpersonal Reactivity Index; BSI = Brief Symptom Inventory 18; Form 90 QFV = Form 90, Quick Feedback Version
Reported values are T-scores from community norms
Procedures
All procedures were approved by the Human Subjects Review Committee of the University of New Mexico. The study design was intended to measure neural activity evoked by an empirically-supported mechanism of behavior change in MI, change talk. Following completion of a computerized assessment battery, participants underwent an MI session conducted by the second author, including content such as participant concerns around substance use, exploring reasons favoring and against change, and future desires with regard to substance use. The intervention was modeled after motivational enhancement therapy (MET: Miller, 1994), a type of MI session that incorporates feedback from an assessment battery. The MET format was chosen because much previous work demonstrating a relationship between change talk and outcome was also based upon MET sessions (Amrhein, et al., 2003; Moyers, et al., 2007; Moyers, et al., 2009). This intervention generated the majority of the experimental stimuli clients heard during the MEG scan. Client language from these sessions was coded by the first author using the client language categories of the MISC 2.5 coding instrument (Houck et al., 2010), enabling the extraction of the client’s own change talk and sustain talk statements for use as experimental stimuli. This also permits comparisons between MEG data, the assessment battery, and change talk measures. Each session was later coded by a masked rater using the complete MISC 2.5 coding system.
The mean time between MI session and MEG scan was 45.3 days, with a mean session length of 42.79 minutes (SD 8.80). To ensure quality and audibility of recorded stimuli, noise removal was performed using spectral noise gating based on a 2-minute recording of the ambient room noise. To permit interpretation of the precise timing information available from MEG, all stimuli were carefully constructed to have clean auditory onsets and offsets by parsing each client language utterance with accuracy of 0.1 milliseconds. All processing of audio files was performed in the Audacity (2010) audio editor. Because of systematic differences in the length of change talk and sustain talk utterances, with generally longer CT utterances than ST utterances (CT M=3.20 sec., sd = 1.82; ST m = 2.32 sec., sd = 1.43) the epoch following the auditory offset of each utterance was selected for the present analysis.
During the MEG scan, participants were presented with a randomly-ordered series of these auditory recordings, including their own spontaneous speech as well as non-spontaneous phrases endorsed and recorded by the participant. Each of the two utterance types (change and sustain) was presented via headphone (Etymotic ER-1) approximately 200 times in order to ensure an adequate signal-to-noise ratio. Each individual stimulus was repeated no more than 15 times. To control for attentional effects, 5% of the trials consisted of a single neutral-speech “target phrase” recorded by the participant. Participants indicated identification of this target phrase by making a motor response using a fiber optic response pad. The epoch between the offset of a target stimulus and the onset of the next utterance was randomly varied between 1100, 1250, and 1400 ms. Stimulus delivery was controlled using an IBM-compatible PC running the Presentation software package (Neurobehavioral Systems, 2007). Stimuli were presented in a unique random order for each participant. To minimize noise in the MEG signal that can be generated by eye movements and blinks, participants were asked to maintain their gaze on a fixation cross projected on a screen, and to blink as cued by a visual prompt. Blink prompts were randomly interspersed between groups of 3–5 verbal stimuli.
MEG data were collected in a magnetically and electrically shielded room (VAC Series Ak3B, Vacuumschmelze GmbH) using a whole-cortex 306-channel MEG array (Elekta Neuromag™) at the Mind Research Network. Before positioning the participant in the MEG, four coils were affixed to the participant’s head, two on the forehead and one behind each ear. These coils allow determination of the position of the participant’s head relative to the position and orientation of the MEG sensors. Additional positioning data was collected using a head position device (Polhemus Fastrak) in order to permit co-localization of MEG activity with the anatomical MRI of each participant. Two channels of electro-oculogram (EOG) were collected, one vertical and one horizontal, simultaneously with MEG. MEG data were sampled at a rate of 1000 Hz, with a bandpass filter of 0.10 to 330 Hz. Head position was monitored continuously throughout the MEG session. Raw single-trial data were collected and stored. Each client’s MEG scan lasted approximately 45 minutes.
Anatomical whole-head MRI data was collected on participants at the Mind Research Network following the MEG scan. High resolution, isotropic T1 [TE (echo time) = 2.74 ms, TR (repetition time) = 2300 ms, TI (inversion time) = 900 ms, 8° flip angle, slice thickness = 1 mm, FOV (field of view) = 256 mm, resolution = 256 × 256, slab thickness = 176 mm, voxel size = 1×1×1 mm, number of echoes = 4, pixel bandwidth = 650 Hz] anatomic images were collected on a Siemens scanner using a multi-echo 3D MP-RAGE pulse sequence. As movement artifacts severely distort high-field MRI data, some participants required multiple scans. A qualified radiologist read each image to ensure that no participant has any clinically relevant structural abnormalities. This MRI scan occurred within 1 month of the MEG scan.
Data analysis
Preprocessing
Artifact removal, correction for head movement, and downsampling to 500 Hz were conducted offline using Elekta Maxfilter software, with 123 basis vectors, a spatiotemporal buffer of 10 seconds, and a correlation limit of .95. The MNE software package (Hämäläinen, 2010) was used to band-pass filter (0.1–40 Hz) and average data off-line over trials, with separate averages computed for the auditory onset and offset of each stimulus type, with baselines of −0.1–0 and 1.1–1.2 s. respectively for onset and offset. Averages based on auditory onset were used only to confirm accurate localization of auditory cortex. All primary analyses were conducted using averages locked to the auditory offset of each phrase. Trials were rejected if magnetic activity greater than 3000 femtotesla (fT) peak-to-peak in any MEG channel occurred, or if there was activity greater than 150 μV peak-to-peak in the EOG channels, resulting in a mean of 149 CT epochs and 141 ST epochs for each subject. Data from the MEG and MRI scans were aligned using the Freesurfer (Dale, Fischl, & Sereno, 1999; Fischl & Dale, 2000; Fischl, Sereno, & Dale, 1999) and MNE (Hämäläinen, 2010) software packages. Participant structural MRI data were processed through Freesurfer and used in MNE to generate realistic single-compartment boundary element models. The MEG inverse operator was calculated in MNE using a loose cortical orientation constraint based upon cortical patch statistics derived from individual anatomical information (Lin, Belliveau, Dale, & Hämäläinen, 2006). Current source distributions were then calculated as dynamic statistical parametric maps (dSPM: Dale, et al., 2000) for CT and ST trials using MNE. After inverse modeling, individual MEG activity estimates were registered to the MNI 305 template brain using a spherical morphing procedure (Fischl, et al., 1999) and grand-averaged across participants to create average images of the whole cortex for the CT and ST conditions.
dSPM-thresholded whole-cortex analysis
Statistical attributes of dSPM (Dale, et al., 2000) were used to identify regions where grand averaged activity differed significantly from baseline levels at a threshold of p < .001. MNE and Freesurfer were used to generate cortical labels (i.e., regions of interest in the cortical surface) for each subject for these regions in standardized (MNI) space. These labels were applied to each subject’s cortical solution. The MNE toolbox was used in Matlab to extract source waveforms from each vertex (i.e., points in the cortical surface after it has been tiled with triangles (tessellated)). Each vertex (triangle) in the present study has an area of approximately 0.5 mm2. Matlab was also used to compute three evoked response field (ERF) measures for the epoch from 100–350 ms following auditory offset of each phrase. Peak amplitude is defined as the maxima for the epoch. Peak latency is identified as the latency of the peak amplitude. Area under the curve (AUC) was computed for the epoch using the trapezoidal rule. AUC was included as a measure of activity because it is independent of peak amplitude and latency. These measures were computed for each vertex in the label for the epoch. Figure 4 illustrates each of these measures. These ERF measures for each subject were compared across conditions using paired t-tests in AFNI (Cox, 1996). The resulting z-scores were converted to Freesurfer paint files for visualization in MNE.
Figure 4.

Illustration of evoked response field measures on the timecourse following change talk (CT) in A.) left Broca’s area, B.) right superior temporal sulcus, and C.) in right superior circular sulcus of the insula – posterior. Horizonal lines represents dynamic statistical parametric map (dSPM) amplitude, intersection of vertical dashed lines with horizontal axis indicates peak latency; intersection of vertical dashed line with dSPM amplitude indicates peak amplitude; shaded blue area illustrates area under the curve (AUC) for the epoch of interest. Zero ms indicates auditory offset. Amplitude for the baseline period for this epoch is shown at the right.
Results
Dynamic statistical parametric maps for MEG represent the three dipole orientations and follow the F distribution. To include only those sources significantly different from baseline levels of activity at p < .001, degrees of freedom 10,50 were used to determine the threshold, resulting in a minimum dSPM of F = 2.68. When applied to the cross-subject whole cortex dSPM solution, this yielded four sources in the 100–350 ms epoch in right hemisphere for CT, three of which were also significantly active in ST. These included two sources in the superior segment of the circular sulcus of the insula, one in the anterior portion and one in the posterior; one source in the inferior part of the precentral sulcus; and a final source in the inferior segment of the circular sulcus of the insula (see Figure 1).
Figure 1.
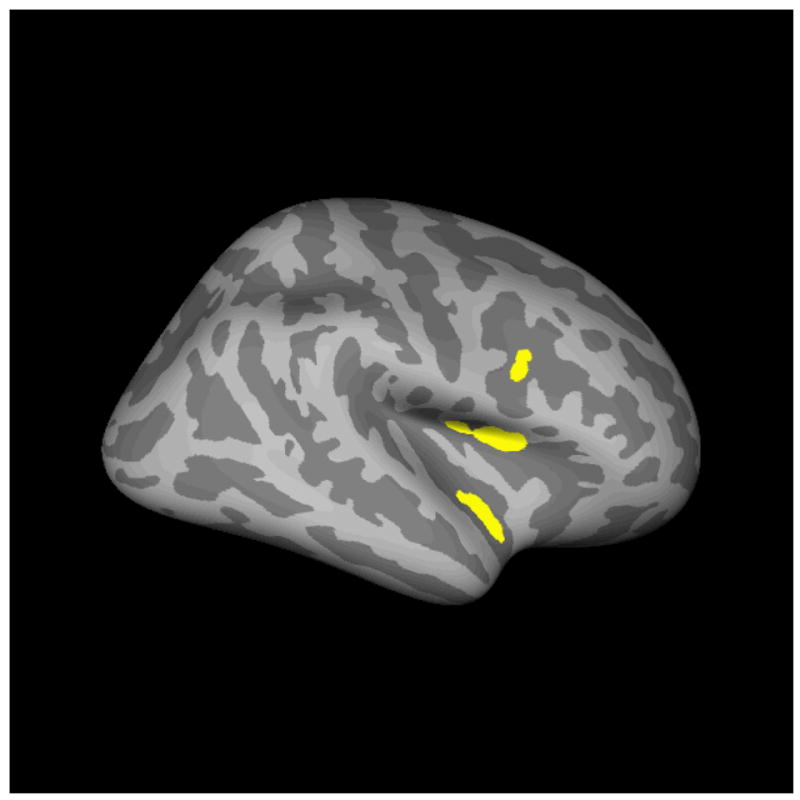
dSPM-thresholded regions of significant activation.
Grand averages of brain activity across subjects for CT and ST in left and right hemisphere are shown in Figures 2–3, with descriptive statistics for evoked response fields (ERF) given in Table 2. AFNI analysis revealed multiple regions with significant differences between CT and ST. In right hemisphere, these regions included cuneus, superior frontal gyrus, lingual gyrus, middle occipital gyrus, and occipital pole. In left hemisphere, these regions included occipital pole, middle temporal gyrus, lingual gyrus, and frontomarginal gyrus. Beyond the regions already discussed in the a priori and dSPM thresholded analysis, however, no additional regions survived the application of a cluster size and z-score threshold. Timecourses for the significant regions are given in Figure 4.
Figure 2.
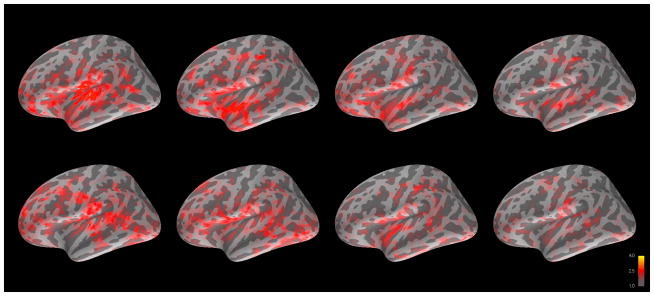
Grand averaged cortical activation (dSPM) in left hemisphere for change talk (top) and sustain talk (bottom) at 100, 200, 300, and 400 ms after auditory offset.
Figure 3.
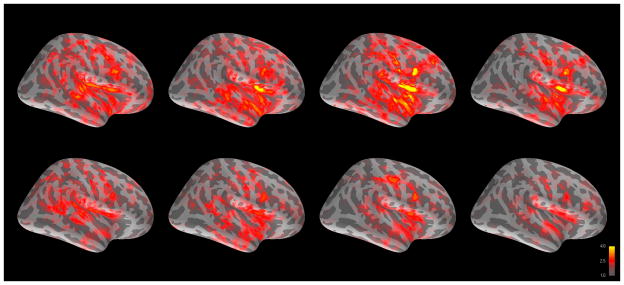
Grand averaged cortical activation (dSPM) in right hemisphere for change talk (top) and sustain talk (bottom) at 100, 200, 300, and 400 ms after auditory offset.
Table 2.
Descriptive statistics on ERF features within left Broca’s area (BA), right superior temporal sulcus (STS), right inferior precentral sulcus, (IFG/BA), right inferior circular sulcus of the insula (ICSI), right superior circular sulcus of the insula – anterior (SCSI-A), and right superior circular sulcus of the insula – posterior (SCSI-P).
| Site | Latency | Amplitude | AUC | ||||
|---|---|---|---|---|---|---|---|
| Mean | SD | Mean | SD | Mean | SD | ||
| BA | CT | 254.60 | 95.09 | 2.35* | 0.69 | 277.03* | 83.55 |
| ST | 247.70 | 86.48 | 3.27* | 0.97 | 461.77* | 236.05 | |
| STS | CT | 195.00 | 94.01 | 3.44* | 1.95 | 488.98 | 504.08 |
| ST | 227.70 | 79.83 | 2.94* | 2.16 | 419.63 | 552.69 | |
| IFG/BA | CT | 223.77 | 64.38 | 4.79 | 2.48 | 727.67 | 538.38 |
| ST | 233.68 | 46.09 | 4.38 | 2.05 | 653.88 | 442.31 | |
| ICSI | CT | 221.17 | 52.58 | 4.10 | 2.93 | 600.84 | 643.01 |
| ST | 238.79 | 58.51 | 3.80 | 2.78 | 551.16 | 638.21 | |
| SCSI-A | CT | 215.09 | 52.79 | 4.37 | 3.00 | 654.94 | 675.82 |
| ST | 216.10 | 59.04 | 4.39 | 2.31 | 607.37 | 513.79 | |
| SCSI-P | CT | 217.81* | 63.08 | 5.12 | 2.93 | 669.80 | 426.60 |
| ST | 196.31* | 48.27 | 4.98 | 1.96 | 687.87 | 359.22 | |
Note:
significant at p < .05;
significant at p < .01;
p < .001
Significant correlations were observed between ERF measures and assessment data. Within Broca’s area, the Recognition scale of the SOCRATES was correlated with peak amplitude for ST (r = .678), drinking intensity (DDD) was correlated with CT peak latency (r = −.642), and three of the four IRI scales were correlated with CT peak latency (perspective taking r = .635, empathic concern r = .654, and personal distress r = .768). Correlations were detected with raw scores of the BSI scales, but were not present after conversion to T-scores using community norms. In superior temporal sulcus, ST peak amplitude and AUC were significantly correlated with the personal distress scale of the IRI (r = .647 and r = .659, respectively). Correlations were detected with raw scores of the BSI scales, but were not present after conversion to T-scores using community norms. Significant correlations for each source are given in Table 3.
Table 3.
Significant correlations between neural activity and assessment scales.
| Scale | AUC CT | AUC ST | Peak amplitude CT | Peak amplitude ST | Peak latency CT | Peak latency ST |
|---|---|---|---|---|---|---|
| Age | ||||||
| ICSI | −.678* | |||||
| STS | −.712* | |||||
| Form 90 QFV: | ||||||
| DDD | ||||||
| BA | −.642* | |||||
| IRI: | ||||||
| Empathic Concern | ||||||
| BA | .654* | |||||
| Fantasy Scale | ||||||
| IFG/BA | .634* | |||||
| SCSI-P | .667* | .635* | ||||
| ICSI | .646* | .679* | ||||
| Personal Distress | ||||||
| BA | .768** | |||||
| STS | .659* | .647* | ||||
| SCSI-A | .801** | .832** | ||||
| IFG/BA | .638* | .793** | .688* | .785** | ||
| SCSI-P | .857** | .653* | .765** | |||
| ICSI | .653* | .709* | .633* | .738** | ||
| Perspective Taking | ||||||
| BA | .635* | |||||
| SOCRATES: | ||||||
| Recognition | ||||||
| BA | .678* | |||||
| SCSI-P | .678* | −.757** | ||||
| InDuC: | ||||||
| Interpersonal | ||||||
| SCSI-A | .839** | |||||
| IFG/BA | .829** |
Note: DDD: drinks per drinking day; CT: Change talk; ST: Sustain talk; Left Broca’s area (BA), right superior temporal sulcus (STS), right inferior circular sulcus of the insula (ICSI), right superior circular sulcus of the insula – anterior (SCSI-A), and right superior circular sulcus of the insula – posterior (SCSI-P). IRI: Interpersonal Reactivity Index; DDD: Drinks per Drinking Day; SOCRATES: Stages of Change Readiness and Treatment Eagerness Scale; InDuC: Inventory of Drug Use Consequences.
significant at p < .05;
significant at p < .01;
p < .001
Discussion
Results indicate that, despite the complex social cognitive nature of the therapeutic milieu in general, and CT and ST perception specifically, differences do exist in the perception and processing of these two theoretically important modes of speech. These differences are apparent in both the localization and dynamics of neural activity occurring after each phrase.
This project was conceived as a study of the role of brain network s related to the processing of change language in motivational interviewing. Of the regions designated a priori as representing these networks, only right insula, left superior temporal sulcus (STS) and right inferior frontal gyrus (IFG) displayed significant activation relative to baseline levels. Significant differences between change talk and sustain talk were also observed in these regions, suggesting some relationship between this network and the perception of one’s own change language. Our original hypotheses were partially supported.
Research using fMRI has detected coupled brain activity between speakers and listeners during story-telling in regions including insula, parietal lobule and temporo-parietal junction (Stephens, Silbert, & Hasson, 2010). Right lateralization of evoked response potentials (ERPs) related to semantic information has been reported as well (Balconi & Amenta, 2010) a finding that is salient given the largely right-lateralized responses observed in the present study following auditory offset. The activity observed in right insula for change language is consistent with the participation of this structure in speech perception (Toyomura, et al., 2007), emotional control (Bechara, 2005) and addiction (Naqvi & Bechara, 2009). Insula has been implicated in both speech production (Dronkers, 1996) and the perception of the motor representations of speech (Fridriksson, et al., 2009; Gazzola, Aziz-Zadeh, & Keysers, 2006), as well in the processing of vocal affect (Campanella & Belin, 2007). Given the role of insula in assigning valence to emotional content (Berntson, et al., 2011), the differential activation of right insula reported here may be related to processing of subtle differences of emotional content between the CT and ST utterances, and may also reflect differences in the participant’s emotional response to these utterances. A recent meta-analysis of nearly 1800 studies indicated functional differentiation in the insular cortex, with a distinct role for anterior insula in emotion and empathy (Kurth, et al., 2010). The only other study that applied neuroimaging to explore change language in MI (Feldstein Ewing, Filbey, Sabbineni, Chandler, & Hutchison, 2011) also observed an effect in insula, although this was seen only for ST statements, and only following an alcohol taste cue. While the implications of that study are complicated by simultaneous auditory and visual presentation of change language, the use of change language from only a single exercise, as well as the use of an alcohol cueing paradigm during stimulus presentation, one consistent finding observed in both studies was activity in insula related to the perception of change language. Given the evidence of a role for insula in cognitive dissonance and attitude change (Izuma, et al., 2010; Qin, et al., 2011; van Veen, Krug, Schooler, & Carter, 2009), the observed activation may provide biological support for the theorized role of cognitive dissonance in motivational interviewing.
The theory of change talk in motivational interviewing holds that ambivalent clients decide what they think about their problematic behavior by hearing themselves talk about that behavior with the clinician. This is grounded in Bem’s (1972) theory of self perception: people form and change their attitudes by observing their behavior. Clients who emit more change talk in the session will experience a shift in the balance of their ambivalence – a change in their perception of their own willingness to change – and will make subsequent behavior changes based on this new self-perception, so as to minimize cognitive dissonance. This is consistent with the integration of self-perception and cognitive dissonance theories (Fazio, Zanna, & Cooper, 1977). Because therapists are able to influence how much change talk clients emit in a session (Glynn & Moyers, 2010; Moyers & Martin, 2006), they partially control the client’s emerging self-perception around the problematic behavior, and contribute to subsequent behavior change (Moyers, et al., 2009). If a relationship can be confirmed between the neural activity described here and subsequent outcomes, this activation may provide a salient marker for the trajectory of the participant’s behavior change.
Each region displayed a different pattern of relationships with assessment data. Given the small sample size of the present study and the issue of multiple comparisons, these relationships should be considered tentative until they can be replicated. Within left Broca’s area, the extent to which participants were likely to spontaneously adopt another’s perspective, experience sympathy and compassion for others, and experience discomfort in response to extreme distress in others were all correlated with peak latency following change talk utterances in our data. This suggests that neural responses to one’s own change talk may be related to the construct of dispositional empathy. Given this structure’s participation in self-reflection, it seems possible that the observed correlation reflects a empathic response to one’s own statements of desire to change problematic behavior. It is possible that MI works, at least in part, by helping a person to view their own reasons, desires and needs for changing in a momentarily more accepting and understanding manner. In this way, their perception of themselves and being willing and ready to change might shift. The relationships observed with measures of empathy suggest that the systems that are active during the perception of change talk and sustain talk may be the same that are active in basic social and emotional processing. This suggests that during treatment sessions, therapists who are able to evoke this special kind of language are tapping into neural circuitry that could be essential for behavior change, mobilizing processes hinted at by Miller and Rose (2009, p. 534), “…covert events that are not directly observable but that result in both increased commitment language and subsequent behavior change.”
Unfortunately it is impossible to say from these data whether specific brain activity is attributable to subtypes of change talk, including desire, ability, reason, and need (DARN); taking steps, or other. Most utterances fell into one of the DARN categories, but were not present individually in sufficient numbers to create averages with adequate signal to noise ratios for analysis. However, the overall relationships observed are suggestive and should benefit from additional data collection.
The pattern of observed activity differs substantially from that reported by Feldstein Ewing and colleagues (2011). The imaging modalities themselves may account for much of this difference: recent work has demonstrated that sustained auditory activity as measured by MEG is only weakly represented in the fMRI BOLD response (Gutschalk, Hämäläinen, & Melcher, 2010). An fMRI study, even one adopting an identical paradigm, would likely observe a very different pattern of activity than that seen in the present study. In addition, the evoked responses analyzed in the present study were time-locked to the end of each phrase, while activity in the Feldstein Ewing report was locked to the beginning of each phrase. Additional differences between the two studies may be related to the absence of an alcohol taste paradigm in the present study, as well as the use of naturalistic auditory stimuli in the present study, rather than simultaneous presentation of auditory and visual stimuli. Finally, the present study used change language that occurred naturally throughout the session or was endorsed by the participant prior to the session, rather than constraining the included client language to an exercise at the end of the session.
Limitations
What remains unclear is whether the experience of listening to one’s own change talk outside of the context of a motivational interviewing session bears any relationship to the processes that occur within treatment sessions. If indeed the engagement of insula, superior temporal sulcus, and Broca’s area following change language phrases indicates a shift in self-perception, does this shift indicate movement toward change (“My drinking really doesn’t fit with my goals”), or does it instead suggest maintenance of the status quo (“I can’t believe I said that; I don’t really want to change at all.”)? Without follow-up data on subsequent substance use outcomes, this is difficult to determine. The collection of ongoing MEG data during treatment sessions, to measure brain activity when speech is originally emitted, would provide more directly-interpretable results. To this end we have begun collecting pilot MEG data in situ during MI sessions to provide additional clarity on the neural substrate of CT and ST.
Another consideration is the potential for changes in alcohol use between MI sessions and subsequent neuroimaging measurements. In the present study alcohol use was measured only during the baseline assessment session. Given that single-session MI can affect drinking, it is possible that research participants changed their alcohol consumption patterns prior to hearing their recorded change language during the MEG session. The effects of hearing one’s own change talk after having already changed one’s behavior are unknown, and could range from reinforcing to aversive. This question should be addressed in future research via longitudinal collection of drinking data, multiple neuroimaging sessions, or, ideally, both. The small sample described in the present effort also limits the generalizability of our findings.
Finally, there are several technical limitations to the dSPM approach to source analysis. As implemented in the current version of MNE, all sources are constrained to the cortical sheet defined in Freesurfer. This omits multiple sources from consideration, including hippocampus, thalamus, cerebellum, and amygdala, all of which are easily measured using MEG. Any activity from these sources would be shifted to the cortical sheet. Although the present study had no explicit hypotheses concerning contributions from these structures, there remains the possibility that important activity from deep sources is either ignored or misattributed to cortical regions.
Conclusions
The present study illustrates the potential of functional neuroimaging techniques in mechanisms of change research. These techniques, including functional MRI and magnetoencephalography, have been used for decades in studies of basic cognitive and social processes. Patterns of activity uncovered in studies of these processes, including constructs such as cognitive dissonance, deception detection, and choice-induced preference change, may be brought to bear in mechanisms of behavior change research to achieve what behavioral research alone has not: to reveal the basic processes by which effective treatments such as motivational interviewing work, how behavior change begins in the brain, and how this process may be supported or accelerated during treatment.
Acknowledgments
This research was funded by a grant from the National Institute on Drug Abuse (NIH/NIDA R21 DA025135).
Footnotes
Theresa B. Moyers is a trainer for motivational interviewing, and is occasionally compensated for training. Jon M. Houck is a trainer for the Motivational Interviewing Skill Code (MISC) coding system, and is occasionally compensated for trianing.
This manuscript is based on Jon M. Houck’s doctoral dissertation.
References
- Abe N. How the Brain Shapes Deception: An Integrated Review of the Literature. Neuroscientist. 2011;17(5):560–574. doi: 10.1177/1073858410393359. [DOI] [PubMed] [Google Scholar]
- Aharonovich E, Amrhein PC, Bisaga A, Nunes EV, Hasin DS. Cognition, commitment language, and behavioral change among cocaine-dependent patients. Psychology of Addictive Behaviors. 2008;22(4):557–562. doi: 10.1037/a0012971. [DOI] [PMC free article] [PubMed] [Google Scholar]
- Amrhein PC, Miller WR, Yahne CE, Palmer M, Fulcher L. Client commitment language during motivational interviewing predicts drug use outcomes. Journal of Consulting and Clinical Psychology. 2003;71:862–878. doi: 10.1037/0022-006X.71.5.862. [DOI] [PubMed] [Google Scholar]
- Apodaca TR, Longabaugh R. Mechanisms of change in motivational interviewing: a review and preliminary evaluation of the evidence. Addiction. 2009;104(5):705–715. doi: 10.1111/j.1360-0443.2009.02527.x. [DOI] [PMC free article] [PubMed] [Google Scholar]
- Audacity. (Version 1.3) 2010 Available from http://audacity.sourceforge.net/
- Baer JS, Beadnell B, Garrett SB, Hartzler B, Wells EA, Peterson PL. Adolescent Change Language within a Brief Motivational Intervention and Substance Use Outcomes. Psychology of Addictive Behaviors. 2008;22(4):570–575. doi: 10.1037/a0013022. [DOI] [PMC free article] [PubMed] [Google Scholar]
- Baillet S, Mosher JC, Leahy RM. Electromagnetic brain mapping. Signal Processing Magazine, IEEE. 2001;18(6):14–30. [Google Scholar]
- Balconi M, Amenta S. “A fighter is a lion”. Neuropsychological indexes in comprehending frozen metaphors. Journal of Pragmatics. 2010;42(12):3246–3257. [Google Scholar]
- Bandura A. Self-efficacy: Toward a unifying theory of behavioral change. Psychological Review. 1977;84:191–215. doi: 10.1037//0033-295x.84.2.191. [DOI] [PubMed] [Google Scholar]
- Bayless SJ, Gaetz WC, Cheyne DO, Taylor MJ. Spatiotemporal analysis of feedback processing during a card sorting task using spatially filtered MEG. Neuroscience Letters. 2006;410(1):31–36. doi: 10.1016/j.neulet.2006.09.073. [DOI] [PubMed] [Google Scholar]
- Bechara A. Decision making, impulse control and loss of willpower to resist drugs: a neurocognitive perspective. Nat Neurosci. 2005;8(11):1458–1463. doi: 10.1038/nn1584. [DOI] [PubMed] [Google Scholar]
- Bem DJ. Self-perception theory. In: Berkowitz L, editor. Advances in Experimental Social Psychology. Vol. 6. New York: Academic Press; 1972. pp. 1–62. [Google Scholar]
- Berntson GG, Norman GJ, Bechara A, Bruss J, Tranel D, Cacioppo JT. The Insula and Evaluative Processes. Psychological Science. 2011;22(1):80–86. doi: 10.1177/0956797610391097. [DOI] [PMC free article] [PubMed] [Google Scholar]
- Bertholet N, Faouzi M, Gmel G, Gaume J, Daeppen J-B. Change talk sequence during brief motivational intervention, towards or away from drinking. Addiction. :no-no–no-no. doi: 10.1111/j.1360-0443.2010.03081.x. [DOI] [PubMed] [Google Scholar]
- Burke BL, Arkowitz H, Menchola M. The efficacy of motivational interviewing: A meta-analysis of controlled clinical trials. Journal of Consulting and Clinical Psychology. 2003;71(5):843–861. doi: 10.1037/0022-006X.71.5.843. [DOI] [PubMed] [Google Scholar]
- Campanella S, Belin P. Integrating face and voice in person perception. Trends in Cognitive Sciences. 2007;11(12):535–543. doi: 10.1016/j.tics.2007.10.001. [DOI] [PubMed] [Google Scholar]
- Carrig MM, Kolden GG, Strauman TJ. Using functional magnetic resonance imaging in psychotherapy research: a brief introduction to concepts, methods, and task selection. Psychotherapy Research: Journal of the Society for Psychotherapy Research. 2009;19(4–5):409–417. doi: 10.1080/10503300902735864. [DOI] [PubMed] [Google Scholar]
- Cohen D. Magnetoencephalography: Evidence of magnetic fields produced by alpha-rhythm currents. Science. 1968;161(3843):784–786. doi: 10.1126/science.161.3843.784. [DOI] [PubMed] [Google Scholar]
- Cox RW. AFNI: Software for Analysis and Visualization of Functional Magnetic Resonance Neuroimages. Computers and Biomedical Research. 1996;29(3):162–173. doi: 10.1006/cbmr.1996.0014. [DOI] [PubMed] [Google Scholar]
- Dale AM, Fischl B, Sereno MI. Cortical surface-based analysis I: Segmentation and Surface Reconstruction. Neuroimage. 1999;9(2):179–194. doi: 10.1006/nimg.1998.0395. [DOI] [PubMed] [Google Scholar]
- Dale AM, Liu AK, Fischl BR, Buckner RL, Belliveau JW, Lewine JD, et al. Dynamic Statistical Parametric Mapping: Combining fMRI and MEG for High-Resolution Imaging of Cortical Activity. Neuron. 2000;26(1):55–67. doi: 10.1016/s0896-6273(00)81138-1. [DOI] [PubMed] [Google Scholar]
- Davis MH. A multidimensional approach to individual differences in empathy. Catalog of Selected Documents in Psychology. 1980;10(MS 2124):85–85. [Google Scholar]
- Derogatis LR. Brief Symptom Inventory (BSI) 18: Administration, Scoring, and Procedures Manual. Minneapolis, MN: Pearson Assessments; 2001. [Google Scholar]
- Dronkers NF. A new brain region for coordinating speech articulation. Nature. 1996;384(6605):159–161. doi: 10.1038/384159a0. [DOI] [PubMed] [Google Scholar]
- Etkin A, Pittenger C, Polan HJ, Kandel ER. Toward a Neurobiology of Psychotherapy: Basic Science and Clinical Applications. J Neuropsychiatry Clin Neurosci. 2005;17(2):145–158. doi: 10.1176/jnp.17.2.145. [DOI] [PubMed] [Google Scholar]
- Fazio RH, Zanna MP, Cooper J. Dissonance and self-perception: An integrative view of each theory’s proper domain of application. Journal of Experimental Social Psychology. 1977;13(5):464–479. [Google Scholar]
- Feldstein Ewing SW, Filbey FM, Sabbineni A, Chandler LD, Hutchison KE. How Psychosocial Alcohol Interventions Work: A Preliminary Look at What fMRI Can Tell Us. Alcoholism: Clinical and Experimental Research. 2011;35(4):643–651. doi: 10.1111/j.1530-0277.2010.01382.x. [DOI] [PMC free article] [PubMed] [Google Scholar]
- Festinger L. A theory of cognitive dissonance. Stanford, CA: Stanford University Press; 1957. [Google Scholar]
- Fischl B, Dale AM. FreeSurfer (Version 4.0.1) 2000 Available at https://surfer.nmr.mgh.harvard.edu/fswiki.
- Fischl B, Rajendran N, Busa E, Augustinack J, Hinds O, Yeo BTT, et al. Cortical Folding Patterns and Predicting Cytoarchitecture. Cerebral Cortex. 2008;18(8):1973–1980. doi: 10.1093/cercor/bhm225. [DOI] [PMC free article] [PubMed] [Google Scholar]
- Fischl B, Sereno MI, Dale AM. Cortical surface-based analysis II: inflation, flattening, and a surface-based coordinate system. Neuroimage. 1999;9(2):195–207. doi: 10.1006/nimg.1998.0396. [DOI] [PubMed] [Google Scholar]
- Forman SD, Cohen JD, Fitzgerald M, Eddy WF, Mintun MA, Noll DC. Improved Assessment of Significant Activation in Functional Magnetic Resonance Imaging (fMRI): Use of a Cluster-Size Threshold. Magnetic Resonance in Medicine. 1995;33(5):636–647. doi: 10.1002/mrm.1910330508. [DOI] [PubMed] [Google Scholar]
- Fridriksson J, Moser D, Ryalls J, Bonilha L, Rorden C, Baylis G. Modulation of Frontal Lobe Speech Areas Associated With the Production and Perception of Speech Movements. J Speech Lang Hear Res. 2009;52(3):812–819. doi: 10.1044/1092-4388(2008/06-0197). [DOI] [PMC free article] [PubMed] [Google Scholar]
- Gaume J, Bertholet N, Faouzi M, Gmel G, Daeppen JB. Counselor motivational interviewing skills and young adult change talk articulation during brief motivational interventions. Journal of Substance Abuse Treatment. 2010;39(3):272–281. doi: 10.1016/j.jsat.2010.06.010. [DOI] [PubMed] [Google Scholar]
- Gazzola V, Aziz-Zadeh L, Keysers C. Empathy and the Somatotopic Auditory Mirror System in Humans. Current Biology. 2006;16(18):1824–1829. doi: 10.1016/j.cub.2006.07.072. [DOI] [PubMed] [Google Scholar]
- Gerber AJ, Peterson BS. Measuring Transference Phenomena with Fmri. J Amer Psychoanal Assn. 2006;54:1319–1325. doi: 10.1177/00030651060540040105. [DOI] [PMC free article] [PubMed] [Google Scholar]
- Glynn LH, Moyers TB. Chasing change talk: The clinician’s role in evoking client language about change. Journal of Substance Abuse Treatment. 2010;39(1):65–70. doi: 10.1016/j.jsat.2010.03.012. [DOI] [PubMed] [Google Scholar]
- Golin CE, Earp J, Tien HC, Stewart P, Porter C, Howie L. A 2-Arm, Randomized, Controlled Trial of a Motivational Interviewing-Based Intervention to Improve Adherence to Antiretroviral Therapy (ART) Among Patients Failing or Initiating ART. JAIDS Journal of Acquired Immune Deficiency Syndromes. 2006;42(1):42–51. doi: 10.1097/01.qai.0000219771.97303.0a. [DOI] [PMC free article] [PubMed] [Google Scholar]
- Gutschalk A, Hamalainen MS, Melcher JR. BOLD Responses in Human Auditory Cortex Are More Closely Related to Transient MEG Responses Than to Sustained Ones. J Neurophysiol. 2010;103(4):2015–2026. doi: 10.1152/jn.01005.2009. [DOI] [PMC free article] [PubMed] [Google Scholar]
- Hämäläinen MJ. MNE (Version 2.7.2) 2010. [Google Scholar]
- Hämäläinen M, Hari R, Ilmoniemi RJ, Knuutila J, Lounasmaa OV. Magnetoencephalography - Theory, instrumentation, and applications to noninvasive studies of the working human brain. Reviews of Modern Physics. 1993;65(2):413–497. [Google Scholar]
- Hettema J, Steele J, Miller WR. Motivational interviewing. Annual Review of Clinical Psychology. 2005;1:91–111. doi: 10.1146/annurev.clinpsy.1.102803.143833. [DOI] [PubMed] [Google Scholar]
- Hodgins DC, Ching LE, McEwen J. Strength of Commitment Language in Motivational Interviewing and Gambling Outcomes. Psychology of Addictive Behaviors. 2009;23(1):122–130. doi: 10.1037/a0013010. [DOI] [PubMed] [Google Scholar]
- Houck JM, Moyers TB. What you do matters: Therapist influence on client behavior during motivational interviewing sessions. Paper presented at the International Addiction Summit.2008. Jun, [Google Scholar]
- Houck JM, Moyers TB, Miller WR, Glynn LH, Hallgren K. Manual for the Motivational Interviewing Skill Code (MISC) version 2.5. 2010 Unpublished manuscript. [Google Scholar]
- Izuma K, Matsumoto M, Murayama K, Samejima K, Sadato N, Matsumoto K. Neural correlates of cognitive dissonance and choice-induced preference change. [10.1073/pnas.1011879108] Proceedings of the National Academy of Sciences. 2010;107(51):22014–22019. doi: 10.1073/pnas.1011879108. [DOI] [PMC free article] [PubMed] [Google Scholar]
- Johnson MM, Rosenfeld JP. Oddball-evoked P300-based method of deception detection in the laboratory II: Utilization of non-selective activation of relevant knowledge. International Journal of Psychophysiology. 1992;12(3):289–306. doi: 10.1016/0167-8760(92)90067-l. [DOI] [PubMed] [Google Scholar]
- Karno MP, Longabaugh R, Herbeck D. What explains the relationship between the therapist structure X patient reactance interaction and drinking outcome? An examination of potential mediators. Psychology of Addictive Behaviors. 2009;70(6):929–936. doi: 10.1037/a0020526. [DOI] [PMC free article] [PubMed] [Google Scholar]
- Kurth F, Zilles K, Fox P, Laird A, Eickhoff S. A link between the systems: functional differentiation and integration within the human insula revealed by meta-analysis. Brain Structure and Function. 2010;214(5):519–534. doi: 10.1007/s00429-010-0255-z. [DOI] [PMC free article] [PubMed] [Google Scholar]
- Langleben DD, Schroeder L, Maldjian JA, Gur RC, McDonald S, Ragland JD, O’Brien CP, et al. Brain Activity during Simulated Deception: An Event-Related Functional Magnetic Resonance Study. Neuro Image. 2002;15(3):727–732. doi: 10.1006/nimg.2001.1003. [DOI] [PubMed] [Google Scholar]
- Le Van Quyen M, Bragin A. Analysis of dynamic brain oscillations: methodological advances. Trends in Neurosciences. 2007;30(7):365. doi: 10.1016/j.tins.2007.05.006. [DOI] [PubMed] [Google Scholar]
- Leahy RM, Mosher JC, Spencer ME, Huang MX, Lewine JD. A study of dipole localization accuracy for MEG and EEG using a human skull phantom. Electroencephalography and Clinical Neurophysiology. 1998;107(2):159–173. doi: 10.1016/s0013-4694(98)00057-1. [DOI] [PubMed] [Google Scholar]
- Lin FH, Belliveau JW, Dale AM, Hämäläinen MS. Distributed current estimates using cortical orientation constraints. Human Brain Mapping. 2006;27(1):1–13. doi: 10.1002/hbm.20155. [DOI] [PMC free article] [PubMed] [Google Scholar]
- Martin T, Moyers TB, Houck JM, Christopher PJ, Miller WR. Motivational Interviewing Sequential Code for Observing Process Exchanges (MI-SCOPE) coder’s manual. Center on Alcoholism, Substance Abuse, and Addictions; The University of New Mexico; 2005. [Google Scholar]
- McClure E, Adler A, Monk C, Cameron J, Smith S, Nelson E, et al. fMRI predictors of treatment outcome in pediatric anxiety disorders. Psychopharmacology. 2007;191(1):97–105. doi: 10.1007/s00213-006-0542-9. [DOI] [PubMed] [Google Scholar]
- Medvedovsky M, Taulu S, Bikmullina R, Ahonen A, Paetau R. Fine tuning the correlation limit of spatio-temporal signal space separation for magnetoencephalography. Journal of Neuroscience Methods. 2009;177(1):203–211. doi: 10.1016/j.jneumeth.2008.09.035. [DOI] [PubMed] [Google Scholar]
- Miller WR. Motivational interviewing with problem drinkers. Behavioural Psychotherapy. 1983;11(2):147–172. [Google Scholar]
- Miller WR. Motivational Enhancement Therapy Manual. 1994. NIH Pub. No. 94–3723. [Google Scholar]
- Miller WR. Motivational Interviewing Skill Code: Coder’s manual. 2000 Available from http://casaa.unm.edu/codinginst.html.
- Miller WR, Rollnick S. Motivational Interviewing: Preparing People to Change Addictive Behavior. New York: Guilford Press; 1991. [Google Scholar]
- Miller WR, Rollnick S. Motivational Interviewing: Preparing People for Change. 2. New York: Guilford Press; 2002. [Google Scholar]
- Miller WR, Rose GS. Toward a Theory of Motivational Interviewing. The American psychologist. 2009;64(6):527–537. doi: 10.1037/a0016830. [DOI] [PMC free article] [PubMed] [Google Scholar]
- Miller WR, Tonigan JS. Assessing drinkers’ motivation for change: The stages of change readiness and treatment eagerness scale (SOCRATES) Psychology of Addictive Behaviors. 1996;10:81–89. [Google Scholar]
- Miller WR, Wilbourne PL. Mesa Grande: A methodological analysis of clinical trials of treatments for alcohol use disorders. Addiction. 2002;97(3):265–277. doi: 10.1046/j.1360-0443.2002.00019.x. [DOI] [PubMed] [Google Scholar]
- Miller WR, Moyers TB, Amrhein PC, Rollnick S. A consensus statement on defining change talk. MINT Bulletin. 2006;13(2):6–7. [Google Scholar]
- Moras K. The value of neuroscience strategies to accelerate progress in psychological treatment research. Canadian Journal of Psychiatry. Revue Canadienne De Psychiatrie. 2006;51(13):810–822. doi: 10.1177/070674370605101303. [DOI] [PubMed] [Google Scholar]
- Morgenstern J, McKay JR. Rethinking the paradigms that inform behavioral treatment research for substance use disorders. Addiction. 2007;102(9):1377–1389. doi: 10.1111/j.1360-0443.2007.01882.x. [DOI] [PubMed] [Google Scholar]
- Moyers TB, Martin T. Therapist influence on client change language during motivational interviewing sessions. Journal of Substance Abuse Treatment. 2006;30:245–251. doi: 10.1016/j.jsat.2005.12.003. [DOI] [PubMed] [Google Scholar]
- Moyers TB, Martin T, Christopher PJ, Houck JM, Tonigan JS, Amrhein PC. Client language as a mediator of motivational interviewing efficacy: Where is the evidence? Alcoholism: Clinical and Experimental Research. 2007;31(S3):40–47. doi: 10.1111/j.1530-0277.2007.00492.x. [DOI] [PubMed] [Google Scholar]
- Moyers TB, Martin T, Houck JM, Christopher PJ, Tonigan JS. From in-session behaviors to drinking outcomes: A causal chain for motivational interviewing. Journal of Consulting and Clinical Psychology. 2009;77(6):1113–1124. doi: 10.1037/a0017189. [DOI] [PMC free article] [PubMed] [Google Scholar]
- Naqvi NH, Bechara A. The hidden island of addiction: the insula. Trends in Neurosciences. 2009;32(1):56–67. doi: 10.1016/j.tins.2008.09.009. [DOI] [PMC free article] [PubMed] [Google Scholar]
- Neurobehavioral Systems. Presentation (Version 11.2) Albany, CA: 2007. [Google Scholar]
- Oser ML, McKellar J, Moos BS, Moos RH. Changes in ambivalence mediate the relation between entering treatment and change in alcohol use and problems. Addictive Behaviors. 2010;35(4):367–369. doi: 10.1016/j.addbeh.2009.10.024. [DOI] [PubMed] [Google Scholar]
- Paquette V, Levesque J, Mensour B, Leroux JM, Beaudoin G, Bourgouin P, et al. “Change the mind and you change the brain”: effects of cognitive-behavioral therapy on the neural correlates of spider phobia. Neuro Image. 2003;18(2):401. doi: 10.1016/s1053-8119(02)00030-7. [DOI] [PubMed] [Google Scholar]
- Peres JFP, Newberg AB, Mercante JP, Simao M, Albuquerque VE, Peres MJP, et al. Cerebral blood flow changes during retrieval of traumatic memories before and after psychotherapy: A SPECT study. Psychological Medicine. 2007;37:1481–1491. doi: 10.1017/S003329170700997X. [DOI] [PubMed] [Google Scholar]
- Phan KL, Fitzgerald DA, Gao K, Moore GJ, Tancer ME, Posse S. Real-time fMRI of cortico-limbic brain activity during emotional processing. Neuro Report. 2004;15(3) doi: 10.1097/00001756-200403010-00029. [DOI] [PubMed] [Google Scholar]
- Qin J, Kimel S, Kitayama S, Wang X, Yang X, Han S. How choice modifies preference: Neural correlates of choice justification. [10.1016/j.neuroimage.2010.11.076] Neuro Image. 2011;55(1):240–246. doi: 10.1016/j.neuroimage.2010.11.076. [DOI] [PubMed] [Google Scholar]
- Razumnikova OM. Creativity related cortex activity in the remote associates task. Brain Research Bulletin. 2007;73(1–3):96–102. doi: 10.1016/j.brainresbull.2007.02.008. [DOI] [PubMed] [Google Scholar]
- Riekert KA, Borrelli B, Bilderback A, Rand CS. The development of a motivational interviewing intervention to promote medication adherence among inner-city, African-American adolescents with asthma. Patient Education and Counseling. 2011;82(1):117–122. doi: 10.1016/j.pec.2010.03.005. [DOI] [PMC free article] [PubMed] [Google Scholar]
- Ritchey M, Dolcos F, Eddington KM, Strauman TJ, Cabeza R. The influence of cognitive therapy on the neural correlates of emotion processing in depression: An event-related fMRI investigation. Paper presented at the 38th Annual Meeting of the Society for Neuroscience; Washinton, D.C. 2008. [Google Scholar]
- Rubak S, Sandbaek A, Lauritzen T, Christensen B. Motivational interviewing: a systematic review and meta-analysis. British Journal of General Practice. 2005;55:305-312(308)–305-312(308). [PMC free article] [PubMed] [Google Scholar]
- Seth AK, Iversen JR, Edelman GM. Single-trial discrimination of truthful from deceptive responses during a game of financial risk using alpha-band MEG signals. Neuro Image. 2006;32(1):465–476. doi: 10.1016/j.neuroimage.2006.02.050. [DOI] [PubMed] [Google Scholar]
- Siegle GJ, Carter CS, Thase ME. Use of fMRI to Predict Recovery From Unipolar Depression With Cognitive Behavior Therapy. Am J Psychiatry. 2006;163(4):735–738. doi: 10.1176/ajp.2006.163.4.735. [DOI] [PubMed] [Google Scholar]
- Stenbacka L, Vanni S, Uutela K, Hari R. Comparison of minimum current estimate and dipole modeling in the analysis of simulated activity in the human visual cortices. Neuro Image. 2002;16:936–943. doi: 10.1006/nimg.2002.1151. [DOI] [PubMed] [Google Scholar]
- Stephens GJ, Silbert LJ, Hasson U. Speaker-listener neural coupling underlies successful communication. Proceedings of the National Academy of Sciences. 2010;107(32):14425–14430. doi: 10.1073/pnas.1008662107. [DOI] [PMC free article] [PubMed] [Google Scholar]
- Thase ME, Fasiczka AL, Berman SR, Simons AD, Reynolds CF., III Electroencephalographic Sleep Profiles Before and After Cognitive Behavior Therapy of Depression. Archives of General Psychiatry. 1998;55(2):138–144. doi: 10.1001/archpsyc.55.2.138. [DOI] [PubMed] [Google Scholar]
- Tonigan JS, Miller WR. The Inventory of Drug Use Consequences (InDUC): Test-retest stability and sensitivity to detect change. Psychology of Addictive Behaviors. 2002;16(2):165. [PubMed] [Google Scholar]
- Tonigan JS, Miller WR, Brown JM. The reliability of Form 90: an instrument for assessing alcohol treatment outcome. Journal of Studies on Alcohol. 1997;58(4):358–364. doi: 10.15288/jsa.1997.58.358. [DOI] [PubMed] [Google Scholar]
- Toyomura A, Koyama S, Miyamaoto T, Terao A, Omori T, Murohashi H, et al. Neural correlates of auditory feedback control in human. Neuroscience. 2007;146(2):499–503. doi: 10.1016/j.neuroscience.2007.02.023. [DOI] [PubMed] [Google Scholar]
- Vader AM, Walters ST, Prabhu GC, Houck JM, Field CA. The language of motivational interviewing and feedback: counselor language, client language, and client drinking outcomes. Psychology of Addictive Behaviors: Journal of the Society of Psychologists in Addictive Behaviors. 2010;24(2):190–197. doi: 10.1037/a0018749. [DOI] [PMC free article] [PubMed] [Google Scholar]
- van Veen V, Krug MK, Schooler JW, Carter CS. Neural activity predicts attitude change in cognitive dissonance. Nat Neurosci. 2009;12(11):1469–1474. doi: 10.1038/nn.2413. [DOI] [PubMed] [Google Scholar]
- Vasilaki EI, Hosier SG, Cox WM. The efficacy of motivational interviewing as a brief intervention for excessive drinking: A meta-analytic review. Alcohol and Alcoholism. 2006;41(3):328–335. doi: 10.1093/alcalc/agl016. [DOI] [PubMed] [Google Scholar]
- Walker DD, Roffman RA, Stephens RS, Wakana K, Berghuis J. Motivational Enhancement Therapy for Adolescent Marijuana Users: A Preliminary Randomized Controlled Trial. Journal of Consulting and Clinical Psychology. 2006;74(3):628. doi: 10.1037/0022-006X.74.3.628. [DOI] [PMC free article] [PubMed] [Google Scholar]
- Wang L, Kakigi R, Hoshiyama M. Neural activities during Wisconsin Card Sorting Test -- MEG observation. Cognitive Brain Research. 2001;12(1):19–31. doi: 10.1016/s0926-6410(01)00022-2. [DOI] [PubMed] [Google Scholar]
- Yamamoto T, Williamson SJ, Kaufman L, Nicholson C, Llinás R. Magnetic localization of neuronal activity in the human brain. Proceedings of the National Academy of Sciences of the United States of America. 1988;85:8732–8736. doi: 10.1073/pnas.85.22.8732. [DOI] [PMC free article] [PubMed] [Google Scholar]