Abstract
Methionine adenosyltransferase (MAT) is an essential enzyme that is responsible for the biosynthesis of S-adenosylmethionine (SAMe), the principal methyl donor and precursor of polyamines. MAT1A is expressed in normal liver and MAT2A is expressed in all extrahepatic tissues. MAT2A expression is increased in human colon cancer and in colon cancer cells treated with mitogens whereas silencing MAT2A resulted in apoptosis. The aim of the current work was to examine the mechanism responsible for MAT2A-dependent growth and apoptosis. We found that in RKO (human adenocarcinoma cell line) cells, MAT2A siRNA treatment lowered cellular SAMe and putrescine levels by 70 to 75%, increased apoptosis and inhibited growth. Putrescine supplementation blunted significantly MAT2A siRNA-induced apoptosis and growth suppression. Putrescine treatment (100 pmol/L) raised MAT2A mRNA level to 4.3-fold of control, increased the expression of c-Jun and c-Fos and binding to an AP-1 site in the human MAT2A promoter and the promoter activity. In human colon cancer specimens, the expression levels of MAT2A, ornithine decarboxylase (ODC), c-Jun and c-Fos are all elevated as compared to adjacent non-tumorous tissues. Overexpression of ODC in RKO cells also raised MAT2A mRNA level and MAT2A promoter activity. ODC and MAT2A are also overexpressed in liver cancer and consistently, similar MAT2A-ODC-putrescine interactions and effects on growth and apoptosis were observed in HepG2 cells. In conclusion, there is a crosstalk between polyamines and MAT2A. Increased MAT2A expression provides more SAMe for polyamines biosynthesis; increased polyamine (putrescine in this case) can activate MAT2A at the transcriptional level. This along with increased ODC expression in cancer all feed forward to further enhance the proliferative capacity of the cancer cell.
Keywords: methionine adenosyltransferase 2A, putrescine, AP-1, colon cancer, liver cancer
INTRODUCTION
Colorectal cancer is a major cause of morbidity and mortality as the third most common cancer worldwide and the fourth most common cause of cancer death1. In the past 20 years, tremendous progress has been made on understanding the molecular pathogenesis of this common cancer. Four signaling pathways commonly aberrant in colorectal cancer are: 1) Wnt, 2) K-ras, 3) transforming growth factor β, and 4) p532. Mutations in these pathways can lead to inactivation of tumor suppressor function and/or activation of proto-oncogenes. In addition, aberrant signaling in several growth factors such as insulin-like growth factor receptor-1 (IGF-1R), epidermal growth factor receptor (EGFR) and leptin has also been shown to be important in colon cancer growth, invasion and metastasis3–6.
Methionine adenosyltransferase (MAT) is an essential enzyme that catalyzes the formation of S-adenosylmethionine (SAMe), the principal biological methyl donor and precursor for polyamine biosynthesis7. Two genes encode for the catalytic subunit of MAT, MAT1A encodes for α1 that is expressed predominantly by normal liver as dimer (MATIII) and tetramer (MATI), and MAT2A encodes for α2 that is expressed by all extrahepatic tissues as the MATII isoenzyme7. We reported that MAT2A expression is induced in human colorectal cancer and in colon cancer cells treated with IGF-1, EGF and leptin8. Importantly, mitogenic effect of these growth factors was abolished if MAT2A induction was prevented8. In addition, knockdown of MAT2A by siRNA in colon cancer cells resulted in increased apoptosis8. Thus, MAT2A expression is a key factor that regulates growth and apoptosis in colon cancer cells.
Given the importance of SAMe in polyamine biosynthesis, a logical hypothesis is that increased MAT2A expression would provide an increased supply of SAMe to enhance polyamine biosynthesis. Polyamines are organic cations with multiple functions that are essential for the cell’s survival9. Mammalian cells have three polyamines: putrescine, spermidine and spermine. They interact with DNA (causing changes in chromatin structure), RNA and proteins and have antioxidant properties10,11. They regulate cell cycle progression and inhibition of polyamine synthesis leads to cell cycle arrest and apoptosis10. Of interest, the expression of ornithine decarboxylase (ODC), the rate-limiting enzyme responsible for the initial step in polyamine biosynthesis, namely formation of putrescine, is often induced and polyamine levels are higher in colon cancer11. However, whether MAT2A regulates growth and apoptosis via polyamines has not been examined. In this work we uncovered a crosstalk between MAT2A and polyamines that has not been previously recognized which can further enhance the growth of the cancer cell.
MATERIALS AND METHODS
Materials
Antibodies used for Western blot analyses of MATII and c-Jun were purchased from Santa Cruz Biotechnology (Santa Cruz, CA), ODC was from Abcam (Cambridge, MA) and β-actin was from Sigma-Aldrich (St. Louis, MO). All other reagents were of analytical grade and obtained from commercial sources.
Cell Culture and Putrescine Treatment
RKO and HepG2 cells were obtained from the Cell Culture Core of the USC Research Center for Liver Diseases at Keck School of Medicine. Cells were grown according to instructions provided by American Type Cell Collection (Rockville, MD). RKO and HepG2 cells were grown to 50 to 60% confluence on six-well plates, and changed to media containing 1% for 24 hours before treatment with 50 to 200 pmol/L or 50 to 200 μmol/L of putrescine (Sigma), respectively, for 24 hours.
Tissue Specimens
Thirteen colon cancers and adjacent non-tumorous tissues were obtained by Prof. Giordano (Whipps Cross University Hospital, London, UK) during surgical resection for primary colon cancer. These tissues were immediately frozen in liquid nitrogen for subsequent RNA and protein extraction. Written informed consent was obtained from each patient. The study protocol conformed to the ethical guidelines of the 1975 Declaration of Helsinki as reflected in a prior approval by Keck School of Medicine University of Southern California’s human research review committee.
RNA Extraction and Real-Time Polymerase Chain Reaction (PCR) Analysis
Total RNA isolated from cells and colons as described8 was subjected to reverse transcription by using M-MLV Reverse Transcriptase (Invitrogen, Carlsbad, CA). One microliter of reverse transcription product was subjected to quantitative real-time PCR analysis. The primers and TaqMan probes for MAT2A, ODC, c-Jun, c-Fos, and Universal PCR Master Mix were purchased from ABI (Foster City, CA). Hypoxanthine phosphoribosyl-transferase 1 and 18S rRNA were used as housekeeping genes as described8. The delta Ct (ΔCt) obtained was used to find the relative expression of genes according to the following formula: relative expression = 2−ΔΔCt, where ΔΔCt = ΔCt of respective genes in experimental groups −ΔCt of the same genes in control group.
RNA Interference and Overexpression Experiments
The pre-designed small interfering RNA (siRNA) targeting human MAT2A (sense sequence: ACACAUUGGAUAUGAUGAUTT) (Invitrogen, Carlsbad, CA) was as described8, ODC (sc-43982, Santa Cruz, CA) and negative control siRNA (Ambion, Austin, TX) were purchased commercially. RKO and HepG2 cells were cultured in six-well plate (3×10⁵ cells/well) and transfected using RNAiMax (5 μL/well) from Invitrogen with MAT2A, ODC siRNA (10 nM) or negative control siRNA for 48 hours following the manufacturer’s instructions.
ODC overexpression vector was purchased from Origene (Rockville, MD). RKO and HepG2 cells were cultured in 12-well plates (0.2× 10⁶ cells/plate), transfected using 7.5 μl of Superfect from Qiagen (Valencia, CA) and 1 μg of target plasmid per well. After 4 hours, the transfection medium was changed to normal medium. Effects of ODC overexpression on mRNA levels and MAT2A promoter activity (see below) were examined 24 hours later.
Cell Proliferation and Apoptosis Assays
Cell proliferation in MAT2A silenced cells and/or treated with putrescine (100 pmol/L for RKO, 100 μmol/L for HepG2) for 24 hours was measured by the incorporation rate of 5-bromo-2’-deoxyuridine (BrdU) into DNA using a BrdU assay kit (CalBiochem, San Diego, CA) as described12 with 3,000 cells per well in 96 well plates and 1 hour of BrdU incorporation time.
For apoptosis, cells were grown on coverslips and treated with siRNA targeting human MAT2A or/and putrescine for 24 hours, and cells were fixed with paraformaldehyde and stained with 8 μg/mL Hoechst 33258 dye for 30 minutes. Cells with bright, fragmented, condensed nuclei were identified as apoptotic cells using the Nikon Eclipse TE300 fluorescent microscope (Melville, NY). At least 5 random fields (at 300X) were counted.
Protein Isolation and Western Blot Analysis
Protein extracts from cells and colon specimens were isolated and subjected to Western blot analyses as described8 and resolved by electrophoresis on 12–13% SDS-polyacrylamide gel. Western blotting was performed following standard protocols (Amersham BioSciences, Piscataway, NJ) using primary antibodies for anti-MATII, ODC, c-Jun and actin. Blots were developed using enhanced chemoluminescence.
MAT2A Promoter Construct and Transient Transfection Assays
The human −571/+60 MAT2A promoter construct was previously described13. Effect of putrescine treatment (100 pmol/L for 24 hours) and ODC overexpression (for 24 hours) on MAT2A promoter activity was examined by measuring luciferase activity driven by the promoter using transient transfection analysis in RKO cells as we previously described13. Each experiment was done in triplicate samples and results are reported as fold of vector control.
Chromatin Immunoprecipitation (ChIP) Assay
ChIP assay was carried out following the ChIP assay kit protocol provided by Upstate (Waltham, MA). RKO cells were treated with putrescine (100 pmol/L for 24 hours) or vehicle control and processed for ChIP assay as we described using anti-c-Jun antibody14. PCRs of the human MAT2A promoter region −571 to −60 used forward primer 5′-AGCACAAAACCTCCGCGATTC-3′ and reverse primer 5′-CTCCAGAGACCGTTCAGCTAT-3′. All PCR products were run on 2% agarose gels and stained with ethidium bromide for 15–30 min.
SAMe and Polyamine Levels
SAMe and polyamine levels from MAT2A siRNA treated RKO cells were determined as previously described8.
Statistical analysis
Data are given as mean±SEM. Statistical analysis was performed using ANOVA and Fisher’s test. For mRNA and protein levels, ratios of respective housekeeping densitometric values were compared. Significance was defined by p<0.05.
RESULTS
Effects of MAT2A Silencing on SAMe and Polyamine Levels, Apoptosis and Proliferation
Treatment of RKO cells with MAT2A siRNA (siMAT2A) for 48 hours lowered cellular SAMe level by 70%, increased % apoptosis more than 3-fold and lowered proliferation (Fig. 1A–E). At this time point cellular putrescine level fell by 75% but spermidine and spermine levels were unchanged (Fig. 1F). However, both spermidine and spermine fell with more prolonged treatment (72 hours, data not shown) but there was also extensive cell death at that time point (>40% apoptosis).
Fig. 1. Effects of MAT2A siRNA treatment on SAMe and polyamine levels, apoptosis, and cell growth.
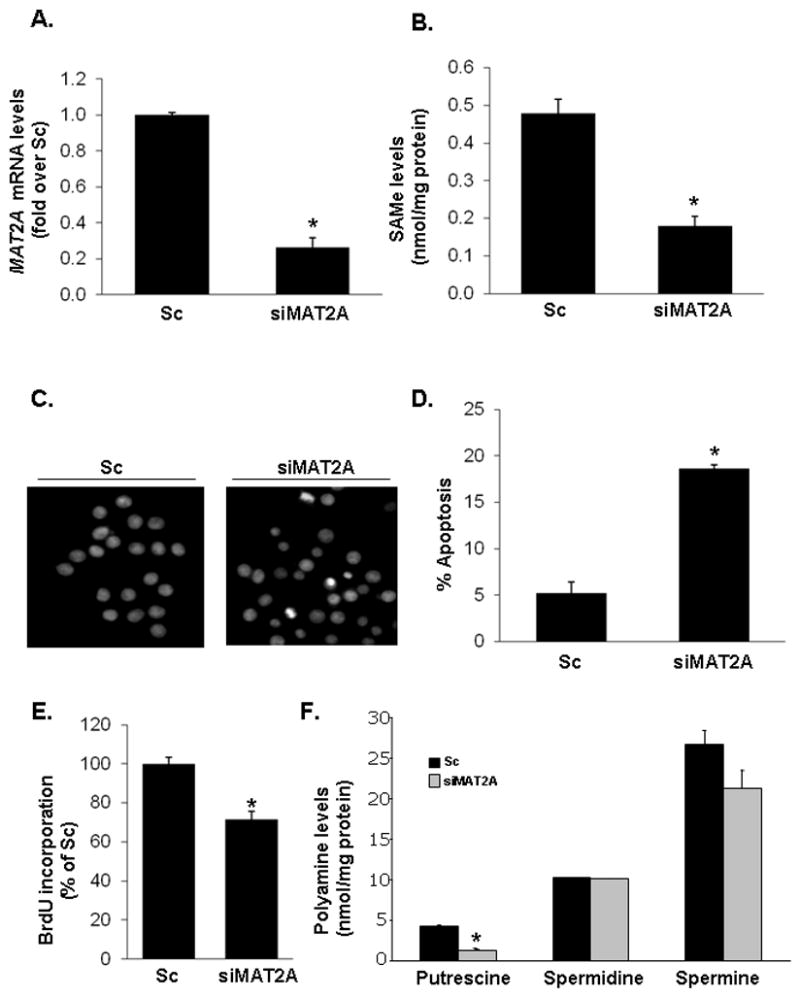
(A) RKO cells were treated with MAT2A siRNA (siMAT2A, 12 pM) or scrambled siRNA (Sc), and MAT2A mRNA levels were measured by real-time PCR after 48 hours. (B) SAMe levels were measured by high-performance liquid chromatography (HPLC). Results are expressed as nmol of SAMe per milligrams of protein. Apoptosis (C, D) and cell growth (E) were determined by Hoechst staining and BrdU incorporation after 48 hours, respectively. (F) Polyamine levels were measured by HPLC. Results are expressed as nmol of putrescine, spermidine and spermine per milligrams of protein. Results represent mean±SEM from 3 independent experiments performed in triplicate for all variables. *p<0.001 vs. Sc.
To evaluate the role of putrescine depletion on MAT2A siRNA-mediated increase in apoptosis and growth suppression, RKO cells were treated with scrambled siRNA (Sc) control or MAT2A siRNA with or without putrescine. Addition of putrescine caused a dose-dependent lowering of apoptosis from 50 to 100 pmol/L but this protective effect was lost at 200 pmol/L concentration (Fig. 2A). Putrescine at 100 pmol/L also blunted the growth suppressive effect of siMAT2A (Fig. 2C).
Fig. 2. Role of putrescine on MAT2A knockdown-induced apoptosis and growth suppression.
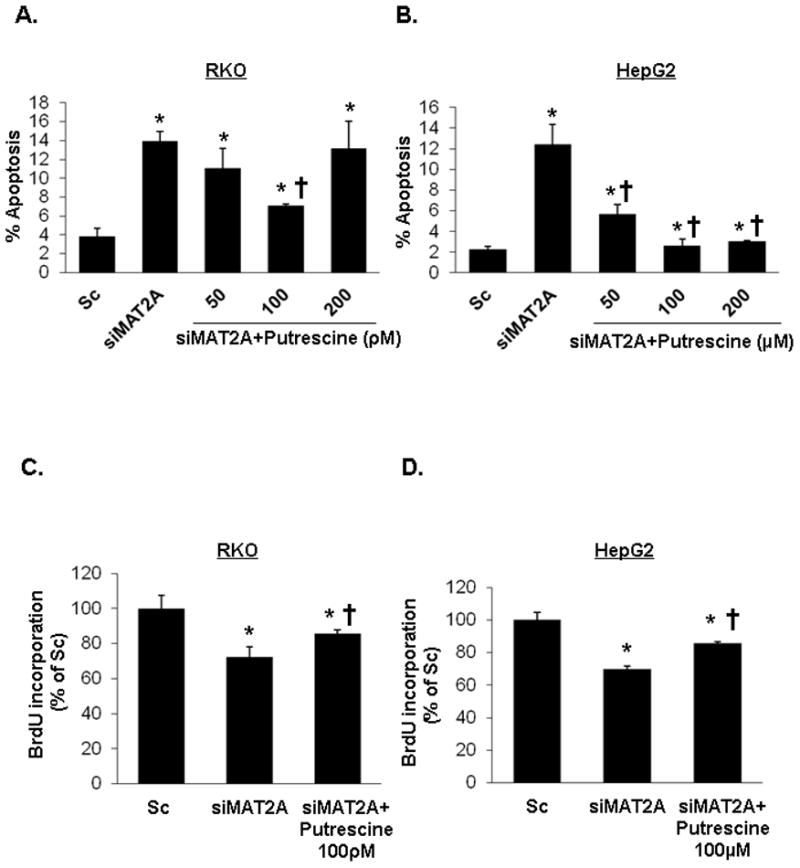
RKO (A and C) and HepG2 (B and D) cells were treated with Sc or siMAT2A (12 pM for 48 hours) ± putrescine in varying doses for the last 24 hours. For A and B, results from 3 experiments are presented as mean percentage of apoptotic cells ± SEM. *p<0.05 vs. Sc, †p<0.05 vs. siMAT2A. For C and D, cell growth was analyzed by BrdU incorporation assay. Mean values ± SD are shown for 3 independent experiments. *p<0.05 vs. Sc, †p<0.05 vs. siMAT2A.
MAT2A expression is also induced in hepatocellular carcinoma (HCC)7 and its induction is required for mitogen-induced growth in HepG2 cells15. In HepG2 cells, knockdown of MAT2A resulted in a 71% reduction in cellular SAMe level15. We next examined whether putrescine might also exert a protective effect in MAT2A knocked down HepG2 cells. Figure 2B shows that in HepG2 cells, treatment with MAT2A siRNA increased apoptosis nearly 6-fold and putrescine supplementation protected against this. A much higher putrescine dose was required in HepG2 cells, which is consistent with previous reports that used 100 μM to 1 mM of putrescine in this cell line16,17. Putrescine also blunted the growth suppressive effect of siMAT2A in HepG2 cells (Fig. 2D).
Effects of Putrescine on MAT2A, ODC, AP-1 Expression
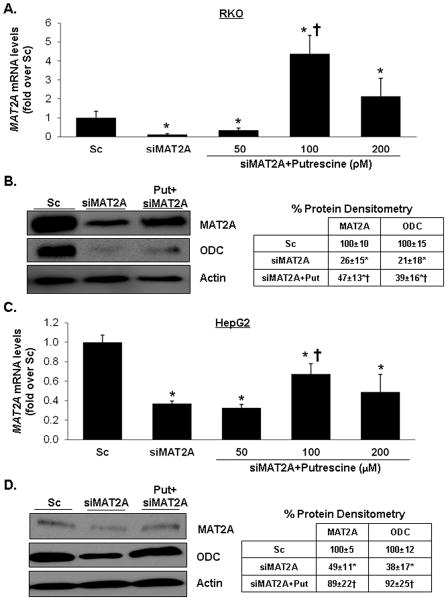
In siMAT2A treated RKO cells, putrescine supplementation (100 pmol/L) increased MAT2A mRNA level over that of Sc control (Fig. 3A). At the protein level, putrescine raised MAT2A protein level above that of siMAT2A treated RKO cells by 81% (Fig. 3B). Putrescine (100 μmol/L) exerted less of an effect on MAT2A mRNA level in HepG2 cells (did not raise it over that of Sc control) (Fig. 3C) but was equally effective in raising MAT2A protein level (Fig. 3D).
Fig. 3. Effects of MAT2A knockdown and putrescine on MAT2A and ODC expression.
RKO (A and B) and HepG2 (C and D) cells were treated with Sc or siMAT2A (12 pM for 48 hours) ± putrescine in varying doses for the last 24 hours. MAT2A and ODC expression was determined by real-time PCR (A and C) and Western blotting (B and D). MAT2A mRNA results represent mean±SEM from 3 to 4 independent experiments performed in duplicate. *p<0.04 vs. Sc, †p<0.03 vs. siMAT2A. Densitometric changes in protein levels are summarized in the boxes adjacent to blots. Results are expressed as % of Sc from 3 to 4 independent experiments, *p<0.01 vs. Sc, †p<0.05 vs. siMAT2A.
In both RKO and HepG2 cells, knockdown of MAT2A had no influence on the mRNA levels of ODC, c-Fos or c-Jun but addition of putrescine raised the mRNA levels of all three genes over that of Sc controls (Fig. 4A,C). Interestingly, although siMAT2A had no effect on ODC mRNA level, it lowered ODC protein level by 79% and 62% in RKO and HepG2 cells, respectively, and putrescine supplementation blunted this effect (Fig. 3B,D). In both cell types, overexpression of ODC also raised MAT2A, c-Fos and c-Jun mRNA levels similar to putrescine treatment (Fig. 4B,D). To see if induction of ODC is required for putrescine to raise MAT2A mRNA level, cells were treated with siODC or putrescine (100 pmol/L for RKO, 100 μmol/L for HepG2) alone or together. Putrescine was able to raise MAT2A mRNA level in both cell types in the presence of ODC knockdown (Fig. 4E,F). In both cell types, ODC knockdown lowered MAT2A mRNA level.
Fig. 4. Effects of MAT2A knockdown, putrescine and ODC on MAT2A, c-Fos and c-Jun expression.
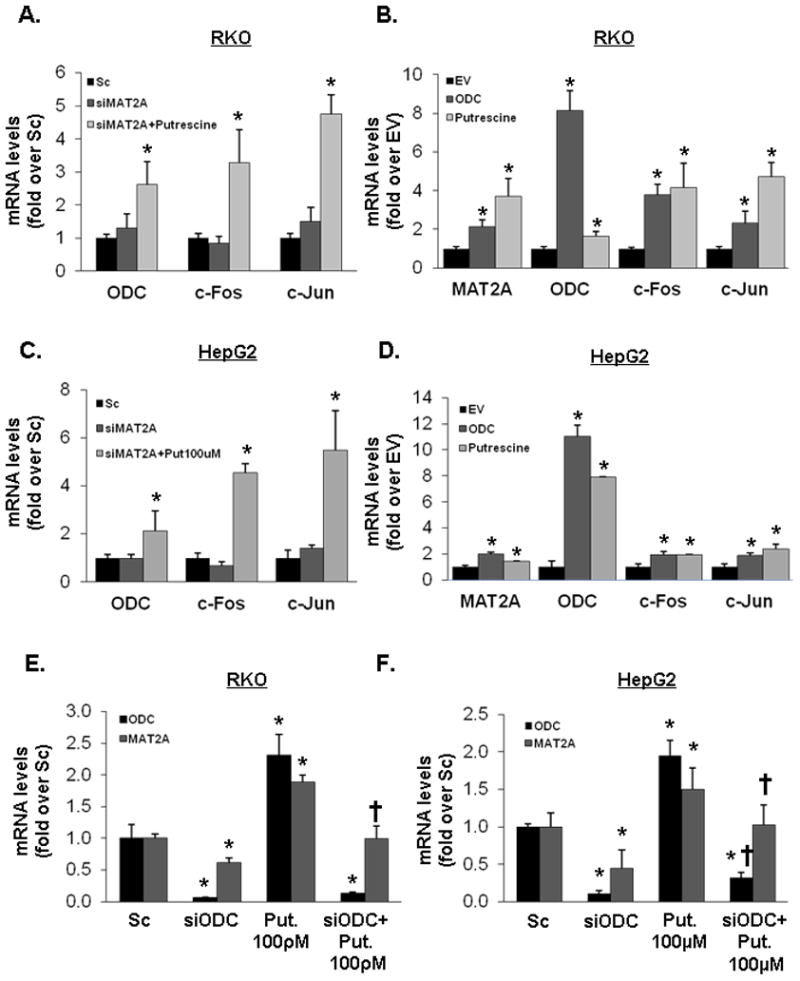
RKO (A, B, E) and HepG2 (C, D, F) cells were treated with siMAT2A (48 hours) or Sc alone, or siMAT2A plus putrescine (100 pM for RKO, 100 μM for HepG2, last 24 hours), ODC overexpression vector (24 hours), empty vector (EV) control or putrescine (same dose as above for 24 hours) and MAT2A, ODC, c-Fos and c-Jun mRNA levels were determinate by real-time PCR. In parts E and F, cells were treated with ODC siRNA or putrescine alone or in combination and ODC and MAT2A mRNA levels were determined. All results are mean±SEM from 3 to 4 independent experiments performed in duplicates. *p<0.05 vs. Sc (A, C, E and F) or EV (B and D), †p<0.05 vs. siODC (E and F).
Effects of Putrescine and ODC overexpression on MAT2A Promoter Activity
The human MAT2A promoter construct −571/60 contains a functional AP-1 cis-acting element13. Overexpression of ODC and putrescine treatment both increased the MAT2A promoter activity to comparable extent (Fig. 5A) and putrescine treatment increased c-Jun binding to the region of the MAT2A promoter that contains the putative AP-1 site (Fig. 5B).
Fig. 5. Effects of ODC overexpression and putrescine on MAT2A promoter activity.
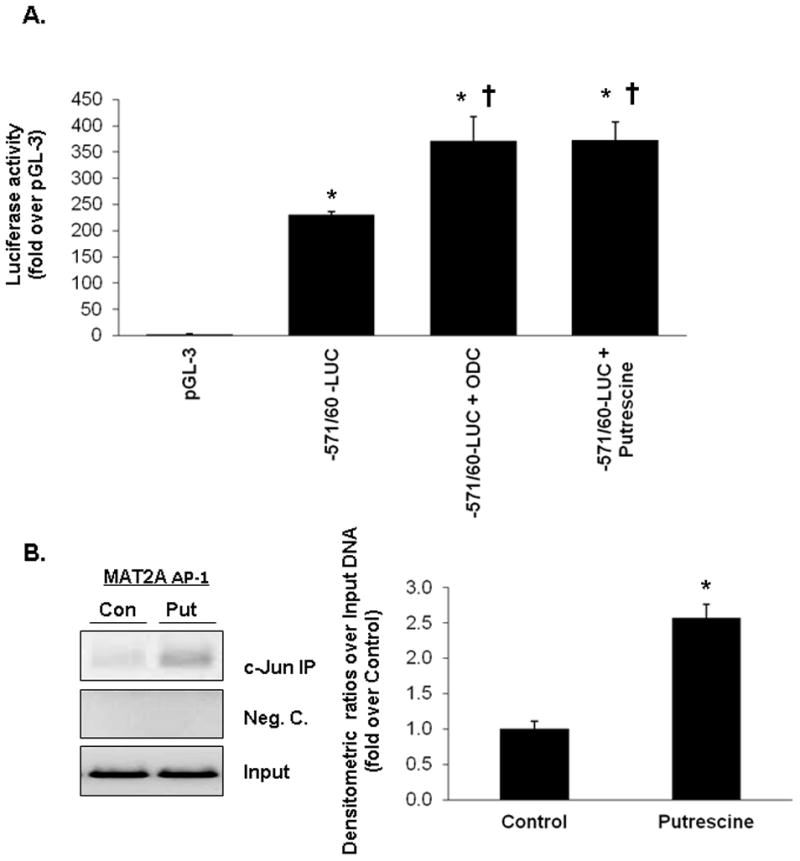
(A) RKO cells were transfected transiently MAT2A promoter construct −571/+60-LUC or pGL-3 enhancer vector and co-transfected with ODC overexpression vector or treated with putrescine (100 pM) for 24 hours. Results represent mean±SEM from 3 independent experiments performed in triplicate. Data are expressed as relative luciferase activity to that of pGL-3 enhancer vector control. *p<0.001 vs. pGL-3, †p<0.002 vs. −571/+60-LUC construct control. (B) Cells were treated with putrescine (100 pM) for 24 hours and processed for ChIP using an anti-c-Jun antibody and a ChIP assay kit according to the manufacturer’s protocol. The AP-1 element in MAT2A promoter fragment from c-Jun immunoprecipitates was amplified by PCR using the corresponding primers. The regulatory fragment was directly amplified by PCR of genomic DNA from each group as input. Value are average of 3 separate experiments ± SEM. *p<0.001 vs. untreated control.
Expression of MAT2A, ODC, AP-1 in Human Colon Cancer
Since ODC overexpression raised MAT2A, c-Fos and c-Jun mRNA level, we examined whether there is any correlation in the expression level of ODC with the expression levels of these genes in colon cancer specimens. Table I shows clinical and pathologic features of the colon cancer specimens. Comparison was made between cancerous to adjacent non-tumorous tissues. Majority of the cancer specimens have higher mRNA levels of all four genes (Table I and Figure 6A). Protein levels of MAT2A, ODC and c-Jun also show significant induction in colon cancer specimens (Fig. 6B). Consistently, there is a significant correlation between the expression level of ODC and MAT2A in colon cancer specimens (Fig. 6C).
Table 1.
MAT2A, ODC, c-Fos and c-Jun Expression in Colon Cancer Specimens.
| Grade | mRNA level in CA, fold over NT | ||||||||||
|---|---|---|---|---|---|---|---|---|---|---|---|
| # | Gender | Age | Site | T | M | N | Histology | MAT2A | ODC | c-Fos | c-Jun |
| 1 | F | 70 | Rectum | T3N0 | 0 | 0 | Moderate | 1.43 | 1.61 | 2.12 | 1.93 |
| 2 | M | 79 | Sigmoid | T3N0 | 0 | 0 | Moderate | 1.78 | 1.10 | 0.90 | 0.75 |
| 3 | F | 54 | Ascending colon | T3N1 | 0 | 1 | Moderate | 4.45 | 6.94 | 2.40 | 2.60 |
| 4 | F | 73 | Ascending colon | T3N0 | 0 | 0 | Moderate | 1.98 | 3.92 | 4.33 | 2.53 |
| 5 | M | 73 | Ascending colon | T3N0 | 0 | 0 | Poor | 1.05 | 0.34 | 0.53 | 0.92 |
| 6 | M | 78 | Sigmoid | T3N0 | 0 | 0 | Moderate | 1.25 | 1.40 | 1.30 | 1.47 |
| 7 | M | 55 | Cecum | T3N0 | 0 | 0 | Moderate | 4.79 | 10.51 | 1.31 | 1.22 |
| 8 | M | 68 | Descending colon | T1N0 | 0 | 0 | High | 1.24 | 5.62 | 4.26 | 1.50 |
| 9 | F | 64 | Ascending colon | T3N0 | 0 | 0 | Moderate | 1.64 | 8.40 | 1.76 | 2.42 |
| 10 | M | 76 | Sigmoid | T2N0 | 0 | 0 | Moderate | 1.24 | 5.01 | 1.61 | 1.46 |
| 11 | M | 68 | Sigmoid | T2N1 | 0 | 1 | Moderate | 1.69 | 3.34 | 1.46 | 0.85 |
| 12 | M | 70 | Sigmoid | T3N1 | 0 | 1 | Moderate | 1.12 | 1.45 | 1.38 | 1.05 |
| 13 | M | 56 | Rectum | T4N2 | 1 | 1 | Poor | 0.79 | 0.40 | 1.03 | 1.39 |
CA = cancer, NT = adjacent non-tumorous tissue
Fig. 6. Expression of MAT2A, ODC, c-Fos and c-Jun in human colon cancer.
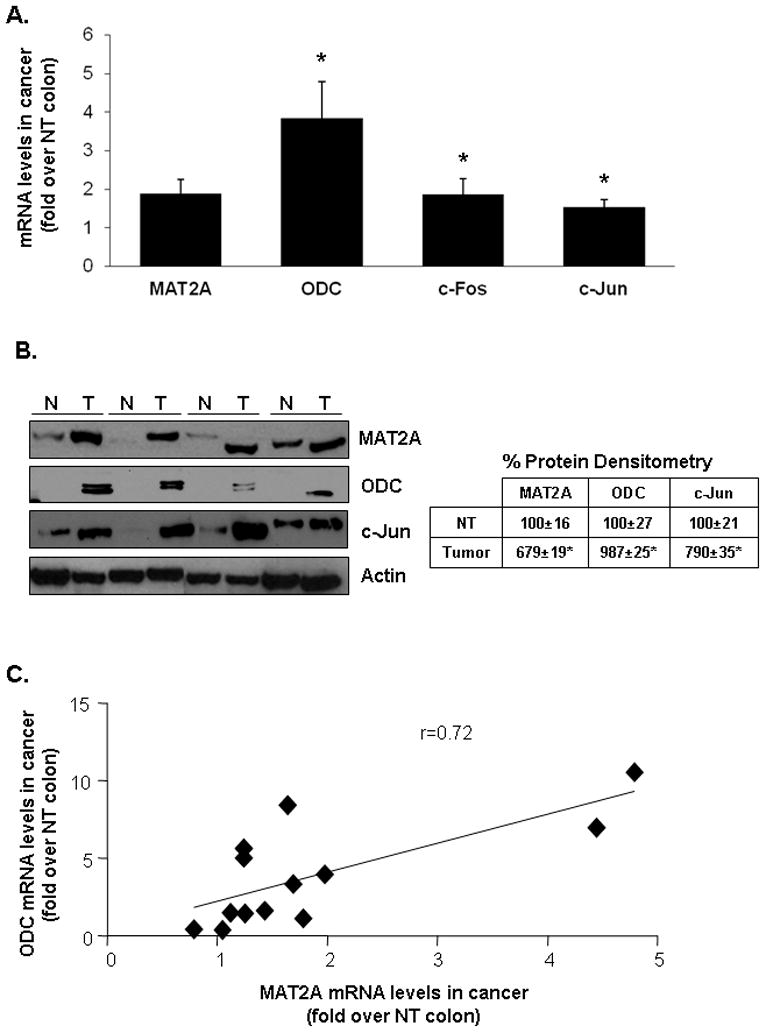
(A) 13 human colon cancer specimens and respective matched adjacent non-tumorous (NT) tissues were processed to measure mRNA levels of MAT2A, ODC, c-Fos and c-Jun by real-time PCR. Results are expressed as fold of matched NT colon tissue (mean±SEM). *p<0.05 vs. NT colon tissue. (B) Western blotting in select paired colon cancer specimens (N for non-tumorous, T for tumor) show increased protein levels of MAT2A, ODC and c-Jun. Densitometric changes are expressed as % of NT tissues and summarized in the box next to the blot. *p<0.04 vs. NT. (C) The direct correlation between the levels of ODC and MAT2A mRNA levels was tested with a Pearson correlation test (r=0.72).
DISCUSSION
Colorectal cancer remains one of the most common malignancies afflicting the world today. Although tremendous progress has been made toward understanding the molecular mechanisms involved, colorectal cancers accounted for 608,000 deaths in 2008 worldwide (World Health Organization Fact sheet N°297, February 2012). Despite improvement treatments, it remains important to identify new paradigms that may lead to additional targets for therapy. We reported that MAT2A expression is increased in colorectal cancer and that the induction of MAT2A was required in order for IGF-1, EGF and leptin to exert their mitogenic effect in colon cancer cells8. In that work we also found that knockdown of MAT2A in colon cancer cells resulted in apoptosis8. Given the fact that MAT is the sole enzyme that catalyzes the biosynthesis of SAMe, which is a precursor for polyamines7, the most likely explanation is that varying MAT2A expression affects growth and apoptosis via changes in polyamine levels since these molecules can modulate growth and apoptosis9,10. However, this link has not been conclusively demonstrated to our knowledge.
We began this investigation by measuring SAMe and polyamine levels following MAT2A siRNA treatment. Consistent with our previous report8, knockdown of MAT2A lowered SAMe level, cell growth and induced apoptosis after 48 hours. However, to our surprise, only putrescine level was lowered at this time point. Putrescine is formed from the decarboxylation of ornithine, catalyzed by ODC, the rate-limiting step in polyamine biosynthetic pathway11. Putrescine combines with decarboxylated SAMe (derived from SAMe via enzymatic reaction catalyzed by SAMe decarboxylase) to generate spermidine via spermidine synthase, and spermine via spermine synthase9. The catabolism of polyamines is essentially a reverse route of their biosynthesis and is catalyzed by spermidine and spermine N′-acetyltransferase and polyamine oxidase18. Regulation occurs at multiple levels involving many of these enzymatic steps. ODC expression is often induced and polyamine levels are higher in colon cancer and loss of APC (Adenomatous polyposis coli) function causes an increase in ODC activity and polyamine levels11. Since SAMe feeds into spermidine and spermine synthesis, we expected SAMe depletion would lower the levels of these two polyamines. However, putrescine depletion occurred before spermidine and spermine levels fell. ODC is regulated at multiple levels, including transcription, translation, and protein degradation19. Although ODC mRNA level was not affected by MAT2A knockdown, ODC protein level was markedly reduced. At the present time we do not know how MAT2A knockdown lowered ODC protein level but this can explain the fall in putrescine level. To our knowledge, SAMe depletion has not been shown to regulate ODC protein level.
Human spermidine synthase and spermine synthase have very low Kms for decarboxylated SAMe (dcSAMe, 7 μM for spermidine synthase and 1 μM for spermine synthase)20. While the intracellular SAMe level is estimated to be around 60 μM21, the intracellular dcSAMe level is low to not detectable in cells under normal conditions7. Thus, both spermidine synthase and spermine synthase are probably working at a concentration of dcSAMe close to or below their Kms. Therefore, biosynthesis of spermidine and spermine may proceed unaffected until cellular dcSAMe level is severely depleted. In addition, SAMe decarboxylase in eukaryotes is activated by putrescine, which lowers the Km for SAMe22,23. When putrescine level falls, SAMe decarboxylase activity is reduced due to an increase in the Km for SAMe and this will lead to a lower dcSAMe content and decreased spermidine/spermine synthesis. These two observations help to explain why putrescine depletion precedes spermidine and spermine.
Putrescine depletion played a key role in both increased apoptosis and growth suppression induced by MAT2A knockdown as supplementation with putrescine in the medium attenuated these effects. However, there is a dose-dependent effect so that higher putrescine concentration (200 pmol/L) lost the protection. This is consistent with reports that excess putrescine can also trigger apoptosis24. Interestingly, we found that putrescine at the optimum dose induced the expression of MAT2A and ODC, in addition to two key AP-1 family members c-Jun and c-Fos. The latter finding is consistent with previous report that increase in intracellular putrescine level induced the expression of c-Jun and c-Fos at the mRNA level25. Increasing intracellular putrescine level by overexpressing ODC also raised MAT2A, c-Jun and c-Fos mRNA levels. MAT2A mRNA level was reduced when ODC was knocked down but exogenous putrescine was able to still raise it, indicating putrescine’s effect on MAT2A expression is independent of ODC. We reported that the human MAT2A promoter contains a functional AP-1 site that is activated by treatment with tumor necrosis factor α and IGF-113,26. This prompted us to examine whether raising putrescine by overexpressing ODC or exogenous treatment can activate the MAT2A promoter activity. Indeed we found that both treatments increased the MAT2A promoter activity and putrescine treatment increased c-Jun binding to the MAT2A promoter region that contains the functional AP-1 site.
Previous studies have shown overexpression of ODC in colon cancer11,25. Our in vitro studies suggest this could increase MAT2A expression at least via AP-1 activation. We next examined whether this crosstalk occurs in colorectal cancer specimens. Consistent with our in vitro results, MAT2A, ODC, c-Jun and c-Fos mRNA levels are higher in cancer specimens as compared to adjacent non-tumorous tissues and the expression level of ODC correlates nicely with that of MAT2A in the cancer specimens. Higher MAT2A, ODC and c-Jun protein levels were confirmed in the same colon cancer specimens.
Since the expression of MAT2A26,27 and ODC28,29 is induced in HCC, we also examined whether there is an interplay among MAT2A, ODC and putrescine in liver cancer cells. We used HepG2 cells because we had previously observed in these cells induction of MAT2A was required for leptin to increase growth15 and MAT2A promoter activity was activated by AP-126. Indeed, essentially the same findings were observed in HepG2 cells, where knockdown of MAT2A induced apoptosis and growth suppression, which were protected by putrescine. Knockdown of MAT2A also lowered ODC protein level, and this was prevented by exogenous putrescine. Finally, putrescine treatment also induced the expression of both MAT2A and ODC. Thus, the same interplay also occurs in liver cancer. The only difference is that the dose of putrescine required was much higher in HepG2 cells, which is consistent with previous reports16,17. The reason for this difference in putrescine dose response between RKO and HepG2 cells is not clear at present.
Taken together, our current study describes a crosstalk between MAT2A and polyamines in colorectal and liver cancer where increased ODC expression can activate the MAT2A gene via AP-1 and increased MAT2A expression in turn provides an increased supply of SAMe for polyamine biosynthesis. In normal cells, ODC expression is tightly regulated so that increased polyamine levels will exert a feedback regulation to lower ODC activity by multiple mechanisms30. However, dysregulation of ODC in colorectal and liver cancer allows this crosstalk to perpetuate and further enhance cancer cell growth.
CONCLUSIONS
There is a crosstalk between MAT2A and polyamine where increased MAT2A expression that occurs in human colon and liver cancer can enhance polyamine biosynthesis and higher polyamine level can increase AP-1 binding and trans-activation of the MAT2A gene. This along with higher ornithine decarboxylase expression that also occurs in colon and liver cancer all feed forward to induce growth. This work is the first to identify this crosstalk and the impact it has on enhancing growth.
Highlights.
MAT 2A knockdown depletes putrescine and leads to apoptosis.
Putrescine attenuates MAT2A knockdown-induced apoptosis and growth suppression.
Putrescine induces AP-1, which activates MAT2A promoter to increase its expression.
Putrescine increases ornithine decarboxylase expression, which induce MAT2A promoter.
Expression of MAT2A correlates with that of ornithine decarboxylase in colon cancer.
Acknowledgments
This work was supported by NIH grants AT004896 (SC Lu and JM Mato), DK51719 (SC Lu and JM Mato) and F32AA020150 (ML Tomasi), Plan Nacional of I+D SAF 2011-29851 and Departamento de Educación del Gobierno Vasco (JM Mato). RKO and HepG2 cells were provided by the Cell Culture Core and SAMe and polyamine levels were measured by the Instrument Core of the USC Research Center for Liver Diseases (P30DK48522).
Abbreviations used (alphabetical order)
- AP-1
activator protein-1
- BrdU
5-bromo-2′-deoxyuridine
- ChIP
chromatin immunoprecipitation
- dcSAMe
decarboxylated SAMe
- EGF
epidermal growth factor
- HCC
hepatocellular carcinoma
- HPLC
high-performance liquid chromatography
- IGF-1
insulin-like growth factor-1
- MAT
methionine adenosyltransferase
- ODC
ornithine decarboxylase
- PCR
polymerase chain reaction
- SAMe
S-adenosylmethionine
- Sc
scrambled siRNA
- siRNA
small interfering RNA
Footnotes
Publisher's Disclaimer: This is a PDF file of an unedited manuscript that has been accepted for publication. As a service to our customers we are providing this early version of the manuscript. The manuscript will undergo copyediting, typesetting, and review of the resulting proof before it is published in its final citable form. Please note that during the production process errors may be discovered which could affect the content, and all legal disclaimers that apply to the journal pertain.
References
- 1.Haggar FA, Boushey RP. Colorectal cancer epidemiology: Incidence, mortality, survival, and risk factors. Clinics Colon Rectal Surgery. 2009;22:191–97. doi: 10.1055/s-0029-1242458. [DOI] [PMC free article] [PubMed] [Google Scholar]
- 2.Piard F, Chapusot C, Ecarnot-Laubriet A, Ponnelle T, Martin L. Molecular markers of heterogeneity in colorectal cancers and adenomas. Eur J Cancer Prevention. 2002;11:85–97. doi: 10.1097/00008469-200202000-00013. [DOI] [PubMed] [Google Scholar]
- 3.Reinmuth N, Fan F, Liu S, Parikh AA, Stoeltzing O, Jung YD, Bucana CD, Radinsky R, Gallick GE, Ellis LM. Impact of insulin-like growth factor receptor-1 function on angiogenesis, growth, and metastasis of colon cancer. Lab Invest. 2002;82:1377–89. doi: 10.1097/01.lab.0000032411.41603.c2. [DOI] [PubMed] [Google Scholar]
- 4.Roberts RB, Min L, Washington MK, Olsen SJ, Settle SH, Coffey RJ, Threadgill DW. Importance of epidermal growth factor receptor signaling in establishment of adenomas and maintenance of carcinomas during intestinal tumorigenesis. Proc Natl Acad Sci. 2002;99:1521–26. doi: 10.1073/pnas.032678499. [DOI] [PMC free article] [PubMed] [Google Scholar]
- 5.Hardwick JCH, Van Den Mrink GR, Offerhaus GJ, Van Deventer SJH, Peppelenbosch MP. Leptin is a growth factor for colonic epithelial cells. Gastroenterology. 2001;121:79–90. doi: 10.1053/gast.2001.25490. [DOI] [PubMed] [Google Scholar]
- 6.Attoub S, Noe V, Pirola L, Bruyneel E, Chastre E, Mareel M, Wymann MP, Gespach C. Leptin promotes invasiveness of kidney and colonic epithelial cells via phosphoinositide 3-kinase, Rho- and Rac-dependent signaling pathways. FASEB J. 2000;14:2329–38. doi: 10.1096/fj.00-0162. [DOI] [PubMed] [Google Scholar]
- 7.Lu SC, Mato JM. S-adenosylmethionine in liver health, injury and cancer. Physiol Reviews. 2012;92:1515–42. doi: 10.1152/physrev.00047.2011. [DOI] [PMC free article] [PubMed] [Google Scholar]
- 8.Chen H, Xia M, Lin M, Yang H, Kuhlenkamp J, Li T, Sodir NM, Chen YH, Josef-Lenz H, Laird PW, Clarke S, Mato JM, et al. Role of methionine adenosyltransferase 2A and S-adenosylmethionine in mitogen-induced growth of human colon cancer cells. Gastroenterology. 2007;133:207–18. doi: 10.1053/j.gastro.2007.03.114. [DOI] [PubMed] [Google Scholar]
- 9.Thomas T, Thomas TJ. Polyamines in cell growth and cell death: molecular mechanisms and therapeutic applications. Cell Mol Life Sci. 2001;58:244–58. doi: 10.1007/PL00000852. [DOI] [PMC free article] [PubMed] [Google Scholar]
- 10.Nitta T, Igarashi K, Yamamoto N. Polyamine depletion induces apoptosis through mitochondria–mediated pathway. Exp Cell Res. 2002;276:120–28. doi: 10.1006/excr.2002.5517. [DOI] [PubMed] [Google Scholar]
- 11.Gerner EW, Meyskebs FL., Jr Polyamines and cancer: old molecules, new understanding. Nature Rev Cancer. 2004;4:781–92. doi: 10.1038/nrc1454. [DOI] [PubMed] [Google Scholar]
- 12.Ramani K, Yang HP, Kuhlenkamp J, Tomasi ML, Tsukamoto H, Mato JM, Lu SC. Changes in methionine adenosyltransferase and S-adenosylmethionine during hepatic stellate cell activation. Hepatology. 2010;51:986–95. doi: 10.1002/hep.23411. [DOI] [PMC free article] [PubMed] [Google Scholar]
- 13.Yang HP, Li TWH, Peng J, Mato JM, Lu SC. Insulin-like growth factor 1 activates methionine adenosyltransferase 2A transcription by multiple pathways in human colon cancer cells. Biochem J. 2011;436:506–16. doi: 10.1042/BJ20101754. [DOI] [PMC free article] [PubMed] [Google Scholar]
- 14.Ramani K, Tomasi ML, Yang HP, Ko K, Lu SC. Mechanism and significance of changes in glutamate-cysteine ligase expression during hepatic fibrogenesis. J Biol Chem. 2012;287:36341–55. doi: 10.1074/jbc.M112.370775. [DOI] [PMC free article] [PubMed] [Google Scholar]
- 15.Ramani K, Yang HP, Xia M, Iglesias Ara A, Mato JM, Lu SC. Leptin’s mitogenic effect in human liver cancer cells requires induction of both methionine adenosyltransferase 2A and 2B. Hepatology. 2008;47:521–531. doi: 10.1002/hep.22064. [DOI] [PMC free article] [PubMed] [Google Scholar]
- 16.Desiderio MA, Pogliaghi G, Dansi P. Regulation of spermidine.spermine N1-acetyltransferase expression by cytokines and polyamines in human hepatocarcinoma cells (HepG2) J Cell Physiol. 1998;174:125–134. doi: 10.1002/(SICI)1097-4652(199801)174:1<125::AID-JCP14>3.0.CO;2-E. [DOI] [PubMed] [Google Scholar]
- 17.Fujimoto S, Yano Y, Nishiguchi S, Koh N, Tamon A, Shiomi S, Kuroki T, Otani S. Identification of genes differentially expressed by putrescine in HepG2 hepatoblastoma cells. Hepatol Res. 2001;20:207–215. doi: 10.1016/s1386-6346(00)00138-8. [DOI] [PubMed] [Google Scholar]
- 18.Wallas HM, Fraser AV, Hughes A. A perspective of polyamine metabolism. Biochem J. 2003;376:1–14. doi: 10.1042/BJ20031327. [DOI] [PMC free article] [PubMed] [Google Scholar]
- 19.Nowotarski SL, Origanti S, Shantz LM. Posttranscriptional regulation of ornithine decarboxylase. Methods Mol Biol. 2011;720:279–292. doi: 10.1007/978-1-61779-034-8_17. [DOI] [PMC free article] [PubMed] [Google Scholar]
- 20.Kajander EO, Kauppinen LI, Pajula RL, Karkola K, Eloranta TO. Purification and partial characterization of human polyamine synthases. Biochem J. 1989;259:879–86. doi: 10.1042/bj2590879. [DOI] [PMC free article] [PubMed] [Google Scholar]
- 21.Finkelstein JD. Methionine metabolism in mammals. J Nutr Biochem. 1990;1:228–37. doi: 10.1016/0955-2863(90)90070-2. [DOI] [PubMed] [Google Scholar]
- 22.Coppoc GL, Kallio P, Williams-Ashman HG. Characteristics of S-adenosylmethionine decarboxylase from various organisms. Intern J Biochem. 1971;2:673–81. [Google Scholar]
- 23.Williams-Ashman HG, Coppoc GL, Weber G. Imbalance in ornithine metabolism in hepatomas of different growth rates as expressed in formation of putrescine, spermidine, and spermine. Cancer Res. 1972;32:1924–32. [PubMed] [Google Scholar]
- 24.Erez O, Goldstaub D, Friedman J, Kahana C. Putrescine activates oxidative stress dependent apoptotic death in ornithine decarboxylase overproducing mouse myeloma cells. Exp Cell Res. 2002;281:148–56. doi: 10.1006/excr.2002.5662. [DOI] [PubMed] [Google Scholar]
- 25.Ancheta AA, Hawel L, III, Byus CV. Acute increase in intracellular putrescine lead to the increase in steady-state levels of c-fos, c-jun, RING3, and Id-1 mRNAs. In: Wang Y, Casero RA Jr, editors. Polyamine cell signaling: Physiology, Pharmacology, and Cancer. Totowa, NJ: Humana Press; 2006. pp. 25–39. [Google Scholar]
- 26.Yang HP, Sadda MR, Yu V, Zeng Y, Lee TD, Ou XP, Chen LX, Lu SC. Induction of human methionine adenosyltransferase 2A expression by tumor necrosis factor alpha: Role of NF-κB and AP-1. J Biol Chem. 2003;278:50887–96. doi: 10.1074/jbc.M307600200. [DOI] [PubMed] [Google Scholar]
- 27.Yang HP, Huang ZZ, Wang JH, Lu SC. The role of c-Myb and Sp1 in the up-regulation of methionine adenosyltransferase 2A gene expression in human hepatocellular carcinoma. FASEB J. 2001;15:1507–1516. doi: 10.1096/fj.01-0040com. [DOI] [PubMed] [Google Scholar]
- 28.Gan FY, Gesell MS, Moshier JA, Alousi M, Luk GD. Detection of ornithine decarboxylase messenger RNA in human hepatocellular carcinoma by in situ hybridization. Epithelial Cell Biol. 1992;1:13–17. [PubMed] [Google Scholar]
- 29.Tamori A, Nishiguchi S, Kuroki T, Seki S, Kobayashi K, Kinoshita H, Otani S. Relationship of ornithine decarboxylase activity and histological findings in human hepatocellular carcinoma. Hepatology. 1994;20:1179–1186. [PubMed] [Google Scholar]
- 30.Palanimurugan R, Scheel H, Hofmann K, Dohmen RJ. Polyamines regulate their synthesis by inducing expression and blocking degradation of ODC antizyme. EMBO J. 2004;23:4857–67. doi: 10.1038/sj.emboj.7600473. [DOI] [PMC free article] [PubMed] [Google Scholar]


