

Abstract
The olfactory bulb (OB) is the first relay station in the brain where odor information from the olfactory epithelium is integrated, processed through its intrinsic neural circuitry, and conveyed to higher olfactory centers. Compared with profound mechanistic insights into olfactory axon wiring from the nose to the OB, little is known about the molecular mechanisms underlying the formation of functional neural circuitry among various types of neurons inside the OB. T-box transcription factor Tbr2 is expressed in various types of glutamatergic excitatory neurons in the brain including the OB projection neurons, mitral and tufted cells. Here we generated conditional knockout mice in which the Tbr2 gene is inactivated specifically in mitral and tufted cells from late embryonic stages. Tbr2 deficiency caused cell-autonomous changes in molecular expression including a compensatory increase of another T-box member, Tbr1, and a concomitant shift of vesicular glutamate transporter (VGluT) subtypes from VGluT1 to VGluT2. Tbr2-deficient mitral and tufted cells also exhibited anatomical abnormalities in their dendritic morphology and projection patterns. Additionally, several non-cell-autonomous phenotypes were observed in parvalbumin-, calbindin-, and 5T4-positive GABAergic interneurons. Furthermore, the number of dendrodendritic reciprocal synapses between mitral/tufted cells and GABAergic interneurons was significantly reduced. Upon stimulation with odorants, larger numbers of mitral and tufted cells were activated in Tbr2 conditional knockout mice. These results suggest that Tbr2 is required for not only the proper differentiation of mitral and tufted cells, but also for the establishment of functional neuronal circuitry in the OB and maintenance of excitatory–inhibitory balance crucial for odor information processing.
Introduction
The olfactory system can perceive a huge number of chemicals in the external world, which profoundly influences the internal homeostasis and output behaviors. The olfactory bulb (OB) is the first relay station in the brain where odor information is integrated and processed (Mori et al., 1999). The OB projection neurons, mitral and tufted cells, send their primary dendrites into single glomeruli, receive inputs from the olfactory sensory neurons, and convey the signals to higher brain centers. Most of mitral and tufted cells extend their secondary dendrites in the external plexiform layer (EPL) where they make dendrodendritic reciprocal synapses with inhibitory interneurons such as granule cells (Mori et al., 1999). Mitral and tufted cells also receive inputs on their primary dendritic tufts within glomeruli from inhibitory and excitatory juxtaglomerular neurons (Aungst et al., 2003). These local neuronal circuits in the OB play critical roles in synchronized firing of sister mitral cells (Dhawale et al., 2010) as well as lateral inhibition among nonsister mitral cells that are important for enhancement of odor-tuning specificity and discrimination (Yokoi et al., 1995; Abraham et al., 2010). Therefore, proper differentiation of various types of OB neurons and establishment of correct synaptic circuits among them are critical for sound functions of the olfactory system. However, molecular and cellular mechanisms underlying these processes remain largely unknown.
Transcription factors belonging to the T-box family play central roles in cellular specification and differentiation in a wide range of tissues including the nervous system (Naiche et al., 2005). Among them, the Tbr1 subfamily consists of three members: Tbr1, Tbr2 (Eomes), and Tbx21 (T-bet). In the developing cerebral neocortex, Tbr1 and Tbr2 are sequentially expressed and regulate the differentiation of excitatory projection neurons (Hevner et al., 2006; Arnold et al., 2008; Sessa et al., 2008; Bedogni et al., 2010). Tbr2 also plays a role in differentiation of retinal ganglion cells and development of optic nerves (Mao et al., 2008). In the OB, Tbr1 subfamily members exhibit cell type-specific and developmentally regulated expression (Faedo et al., 2002). Although they could be candidate transcription factors regulating OB neuron differentiation, their detailed expression patterns as well as their functional roles in the olfactory system have been poorly understood.
In this study, we performed a detailed immunohistochemical analysis of Tbr1, Tbr2, and Tbx21 in the developing and adult OB and found that they show unique combinatorial expression patterns in distinct types of OB neurons. Furthermore, by analyzing the conditional knockout mice with Tbr2 gene deletion specifically in mitral and tufted cells, we found that Tbr2 plays a critical role not only in the proper differentiation of mitral and tufted cells, but also in the formation of functional neural circuitry in the OB.
Materials and Methods
Animals.
Tbr2 (Eomes)flox/flox mice (Mao et al., 2008), protocadherin21 (Pcdh21)-Cre mice (Nagai et al., 2005), and mOR-EG-ires-gapEGFP mice (Oka et al., 2006) were kindly provided by Dr. W. H. Klein (University of Texas), Dr. M. Yokoi (Kyoto University), and Dr. K. Touhara (The University of Tokyo), respectively. Tbr2flox/flox mice were crossed with Pcdh21-Cre mice to obtain Tbr2wt/flox; Cre+/− mice. Mitral and tufted cell-specific Tbr2-deficient (Tbr2flox/flox; Cre+/−) mice were generated by mating Tbr2flox/flox male mice with Tbr2wt/flox; Cre+/− female mice. For the analysis, Tbr2wt/flox; Cre−/− mice were used as control littermates. All animal experiments were approved by the Animal Care and Use Committee of RIKEN and conformed to National Institutes of Health (NIH) guidelines.
Immunohistochemistry.
Immunohistochemistry was performed essentially as described previously (Yoshihara et al., 2005). Briefly, mice were anesthetized with intraperitoneal injection of sodium pentobarbital and perfused with PBS, followed by 4% paraformaldehyde (PFA) in PBS. The brain was removed, postfixed with 4% PFA for 3–4 h at 4°C, and immersed in 30% sucrose for 2 d for cryoprotection. Coronal sections at 50 μm thickness were made with a sliding microtome (REM-700; Yamato Kohki). The sections were blocked with PBS-T (0.2% Triton X-100) containing 5% normal horse serum for 1 h, and incubated with primary antibodies overnight at room temperature. Primary antibodies used were as follows: rabbit anti-Tbr1 (1:2000; Millipore AB9616), rat anti-Eomes (Tbr2) (1:200; eBioscience 12-4875, PE-conjugated), guinea pig anti-Tbx21 (1:10,000) (Yoshihara et al., 2005), mouse anti-Cre (1:1000; Millipore MAB3120 2D8), mouse anti-PGP9.5 (1:40; Abcam ab8189 13C4), rabbit anti-Pcdh21 (1:2000) (Kaneko-Goto et al., 2008), mouse anti-neurofilament-165 kDa (1:1000; American Research Products 01-20082), rabbit anti-calretinin (1:2000; Swant 7699/4), rabbit anti-Arx (1:1000; a gift from Dr. K. Kitamura, Mitsubishi Kagaku Institute of Life Science), mouse anti-parvalbumin (1:5000; Swant PV235), rabbit anti-5T4 (1:500) (Imamura et al., 2006), rabbit anti-calbindin (1:1000; Millipore AB1778), rabbit anti-tyrosine hydroxylase (TH) (1:300; Millipore AB152), guinea pig anti-vesicular glutamate transporter (VGluT) 1 (1:1000; Millipore AB5905), rabbit anti-VGluT2 (1:700; a gift from Drs. T. Kaneko and K. Nakamura, Kyoto University), mouse anti-vesicular GABA transporter (VGAT) (1:500; Synaptic Systems 131 011 117G4), mouse anti-synaptophysin (1:100; Boehringer Mannheim 902 314), and rabbit anti-phosphorylated nuclear factor κB p65 (Ser276) (pNFκB) (1:200; Cell Signaling Technology #3037). Cy3- and Cy5-conjugated secondary antibodies were purchased from Jackson ImmunoResearch. Alexa 488-conjugated secondary antibodies were purchased from Invitrogen. All secondary antibodies were used at 1:400 dilutions.
Western blot analysis.
Whole OB homogenates were prepared from adult control and Tbr2 conditional knockout mice. Western blot analysis was performed as described previously (Yoshihara et al., 1991). For SDS-PAGE, 15 μg of total protein was applied to each lane. Primary antibodies used were as follows: rabbit anti-Tbr1 (1:10,000; Millipore AB9616), rabbit anti-Tbr2/Eomes (1:1000; Abcam ab23345), and rabbit anti-Tbx21 (1:10,000) (Yoshihara et al., 2005). Horseradish peroxidase-conjugated secondary antibodies were purchased from Jackson ImmunoResearch. Specific bands for each protein were detected at ∼74 kDa (Tbr1), 72 kDa (Tbr2), and 58 kDa (Tbx21) with a chemiluminescence reaction kit (GE Healthcare EPL plus Western Blotting Detection Reagents, GE Healthcare). Intensities of individual bands were measured with the public domain ImageJ program (NIH). Statistical analysis was performed using data obtained from three different OB samples of each genotype.
Double-label fluorescence in situ hybridization/immunohistochemistry.
A partial cDNA fragment of VGluT1 (525 bp) was obtained by RT-PCR from adult mouse brain cDNA as a template using the following primers: 5′-TCGTGGGTGCAATGACCAAGCACA-3′ and 5′-CCTTGAAACTGCTAGTGTGCAGCT-3′. A partial cDNA fragment of mouse VGluT2 (1106 bp) was PCR-amplified from FANTOM3 clone (RIKEN clone B230114L05) using the following primers: 5′-GAGACCATGTTAAGGCAGGAAG-3′ and 5′-ACACATCCATAATGCACTCTGG-3′. In situ hybridization was performed on cryosections of the OB using digoxigenin (DIG)-labeled cRNA probes as previously described (Inaki et al., 2004, Sato et al., 2005), except that hybridization and washing procedures were performed at 68°C. After hybridization, sections were incubated with either anti-Tbr1 or anti-Tbr2 antibody overnight at room temperature, washed three times with PBS-T, and then incubated with Alexa 488-labeled secondary antibody for 2 h. After washing, sections were incubated with anti-DIG-AP antibody (1:2000; Roche Applied Science) for overnight at room temperature. Signals of DIG-labeled probes were visualized with HNPP/Fast Red (Roche Applied Science).
Image acquisition and morphological quantification.
Fluorescent digital images were captured using Axio Imager Z1 epifluorescence microscope (Carl Zeiss) and Fluoview FV1000 confocal laser scanning microscope (Olympus).
For measurement of thickness of the EPL, OB coronal sections were immunostained for PGP9.5, which is predominantly localized to secondary dendrites of mitral cells in the inner EPL. Thickness of the total EPL (distance from the middle of the mitral cell layer [MCL]) to the inner edge of the glomeruli), the inner EPL (distance from the middle of the MCL to the border of PGP9.5-positive and -negative regions), and the outer EPL (total EPL − inner EPL) were measured at six different points (dorsomedial, medial, ventromedial, dorsolateral, lateral, and ventrolateral) in each OB section. The mean values from five different animals from each genotype were analyzed. Statistical differences between control and Tbr2 conditional knockout mice were validated by Welch's t test.
For measurement of projection angles of mitral cell primary dendrites toward target glomeruli, OB coronal sections were immunostained for neurofilament-165 kDa, which is present in a subpopulation of mitral cells located in the medial part of the OB. Images of the EPL were obtained from three different animals for each genotype. A line perpendicular to the OB layer boundaries was drawn, and an angle between this line and a primary dendrite of each mitral cell at the middle of the EPL was measured with ImageJ program (NIH). Thirty-nine different mitral cells were analyzed for each genotype and their dendrite angles were represented in cumulative plots.
For counting the numbers of parvalbumin-positive EPL interneurons, four coronal sections (50 μm thickness) at equal intervals from each OB of control and Tbr2 conditional knockout mice were immunostained with anti-parvalbumin antibody. The numbers of parvalbumin-positive cells in the EPL were counted in whole OB sections and averaged for individuals. Data were collected from five different animals from each genotype and statistically analyzed.
For measurement of the OB volume, coronal sections were cut from six different animals for each genotype (control and Tbr2 conditional knockout mice). Twenty-four to twenty-six sections were obtained at 100 μm intervals from anterior tip to the posterior end of the OB. A picture of each OB section was captured and printed on paper (80 g/m2) at 40× magnification. Series of OB sections were cut out from papers along outside edge of the glomerular layer (GL) and total weight (milligrams) was measured. This weight was defined as the arbitrary volume of the OB, and the difference between control and Tbr2 conditional knock-out mice was statistically evaluated.
For quantification of numbers of dendrodendritic synapses, OB coronal sections were triply immunostained with anti-VGluT1, VGluT2, and VGAT antibodies, and immunoreactive signals in the inner and the outer EPL were captured with a confocal laser scanning microscopy with a 100× oil-immersion objective lens. The signals of each marker were cut off at 40% intensities, and the numbers of VGAT-positive puncta, which were isolated or apposed to either VGluT1 or VGluT2-positive puncta, were counted. Statistical analysis was performed using data obtained from three different animals of each genotype.
Intracellular injection of fluorescent dye into mitral cells.
Intracellular dye injection was performed essentially as described previously (Naritsuka et al., 2009). Control and Tbr2 conditional knockout mice at the age of P16–P18 were anesthetized and transcardially perfused with 4% PFA and postfixed for 7 h at 4°C. OB coronal slices at 300 μm thickness were prepared with a vibratome. The slices were placed on a chamber filled with 0.1 m phosphate buffer, pH7.4. Mitral cells were identified by infra-red camera under 40× water-immersion lens (Nikon). Lucifer yellow (5% in 50 mm Tris-Cl, pH7.4) was put into glass micropipettes and iontophoretically injected into a soma of randomly chosen mitral cells at least for 15 min. After labeling, slices were fixed in 4% PFA overnight and washed with PBS. Fluorescent images of the injected cells were captured with a multiphoton laser scanning microscope (Olympus Fluoview FV1000MPE) with 25× water-immersion lens.
Odorant-induced neuronal activation assessed by phosphorylation of NFκB.
Adult male mice of indicated genotypes were individually housed at least for 1 week. Test animals were deprived of food and water overnight before the experiment. Five milliliters of odorant solution (2% isoamyl acetate, 5% eugenol, or 5% octanal in mineral oil) or vehicle (mineral oil) was absorbed in cotton swabs and presented at the corner of the cage for 2 min. After 8 min, mice were anesthetized for 5 min and transcardially perfused with 4% PFA. The brains were removed and postfixed with 4% PFA for 3 h at 4°C, followed by immersion in 30% sucrose for 2 d. OB coronal sections at 50 μm thickness were prepared with a sliding microtome.
Ten OB sections at 200 μm intervals along the anteroposterior axis were picked up from each tested animal. Immunohistochemistry with anti-pNFκB antibody was performed, followed by DAPI staining. The number of pNFκB-immunoreactive mitral and tufted cells and juxtaglomerular neurons was counted from three different animals for each test condition and statistically analyzed. The following criteria were used for identification of each cell type. Mitral cells reside in the mitral cell layer, have large nuclei, and are weakly stained by DAPI. Tufted cells reside in the EPL and GL, have large nuclei, and are weakly stained by DAPI. Juxtaglomerular neurons reside in the GL, have small nuclei, and are strongly stained by DAPI.
Results
Combinatorial expression of three T-box transcription factors in the OB
We first examined detailed expression patterns of three Tbr1 subfamily members (Tbr1, Tbr2, and Tbx21) in the developing and adult mouse OB. Triple immunofluorescence labeling using anti-Tbr1, anti-Tbr2, and anti-Tbx21 antibodies revealed that the three molecules exhibited dynamic expression patterns during development (Fig. 1A–P). At embryonic day 14 (E14), Tbr1 and Tbr2 were strongly expressed in many mitral cells, while only a small population of them expressed Tbx21 (Fig. 1A–D). As development proceeded toward birth, the expression of Tbx21 became stronger, and each mitral cell expressed different levels of Tbr1 subfamily members (Fig. 1E–L). By P7, tufted cells and juxtaglomerular neurons emerged in the EPL and GL, and the Tbr1 subfamily started to show segregated expression patterns in these neurons (Fig. 1M–P). In the adult OB, an overlapping but distinct expression pattern of each Tbr1 subfamily member defines different subpopulations of OB neurons (Fig. 1Q–X); in the GL, a subset of juxtaglomerular neurons was strongly positive for only Tbr2, but not for Tbr1 or Tbx21 (Fig. 1X, red neurons). Two anatomically separated subpopulations of tufted cells were clearly identified by the complementary expression of Tbr1 and Tbr2/Tbx21. The subpopulation of external tufted cells in the GL expressed a high level of Tbr1, but not Tbr2 or Tbx21 (Fig. 1X, blue neurons). In contrast, external/middle/internal tufted cells in the EPL expressed Tbr2 strongly and Tbx21 moderately, but Tbr1 only very weakly (Fig. 1X, yellow neurons). On the other hand, Tbr1, Tbr2, and Tbx21 were altogether coexpressed in mitral cells, although the expression levels of individual molecules varied from cell to cell (Fig. 1U–X). The dynamic and unique combinatorial expression of Tbr1, Tbr2, and Tbx21 suggests their possible roles in specification of different types of OB neurons and formation of functional olfactory neural circuitry.
Figure 1.
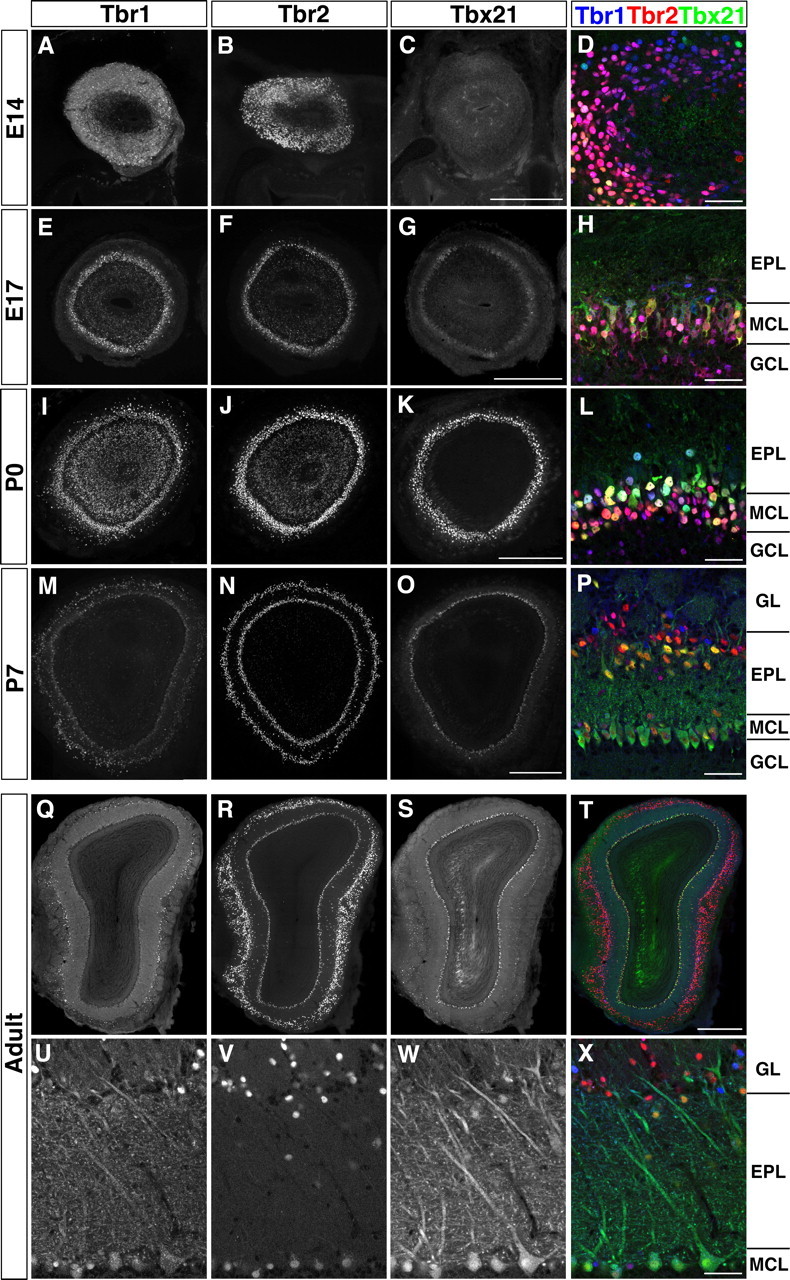
Expression of Tbr1 subfamily members in the developing and adult mouse OB. Triple immunofluorescence labeling of Tbr1 (A, E, I, M, Q, U), Tbr2 (B, F, J, N, R, V), Tbx21 (C, G, K, O, S, W), and merged views (D, H, L, P, T, X) (Tbr1, blue; Tbr2, red; Tbx21, green) on coronal sections of developing (A–P) and adult (Q–X) mouse OB. A–C, E–G, I–K, M–O, Q–T, Whole OB images. D, H, L, P, U–X, Higher magnifications. Tbr1, Tbr2, and Tbx21 show dynamic expression patterns during development, and exhibit partially overlapping but distinct expression in the adult OB. GCL, Granule cell layer. Scale bars: C (for A–C), G (for E–G), K (for I–K), O (for M–O), T (for Q–T), 500 μm; D, H, L, P, U–X, 50 μm.
Conditional knockout of Tbr2 gene in mitral and tufted cells
To explore the roles of Tbr1 subfamily in mitral and tufted cells, we set out to analyze the loss-of-function phenotypes of Tbr2 using gene-targeting strategy. Tbr2-null mutant mice are reported to die at early embryonic stages due to a defect in trophoectoderm differentiation (Russ et al., 2000). Hence, to inactivate functional Tbr2 alleles specifically in mitral and tufted cells, we crossed Tbr2flox/flox mice (Mao et al., 2008) with Pcdh21-Cre transgenic mice that express Cre recombinase predominantly in mitral and tufted cells (Nagai et al., 2005) (Fig. 2A,B–K). In mitral cells, the expression of Cre started around E17 in the dorsal part of the OB (Fig. 2B,G, arrowheads), and increased thereafter throughout the OB by early postnatal days (Fig. 2C,D,H,I). In tufted cells, Cre protein was detected as early as P7, which was slightly later than the emergence of tufted cells in the EPL (Fig. 2D,I). By P14, all of the mitral and tufted cells robustly expressed Cre protein (Fig. 2E,J). Concomitantly with the Cre expression, Tbr2 protein was gradually lost during the neonatal development (Fig. 2C,D,M,N) and was completely absent at P14 and adult stage (Fig. 2E,F,O,P,V,X) in Cre-expressing mitral and tufted cells in Tbr2 conditional knockout mice (Tbr2flox/flox; Cre+/−). In contrast, Cre-negative juxtaglomerular neurons maintained Tbr2 expression even in the adult stage (Fig. 2F,P,V,X), validating the mitral and tufted cell-specific inactivation of the Tbr2 gene. Therefore, the phenotypic analyses of these Tbr2 conditional knockout mice were focused on the roles of Tbr2 in mitral and tufted cells at relatively late developmental stages, but not at early embryonic stages.
Figure 2.
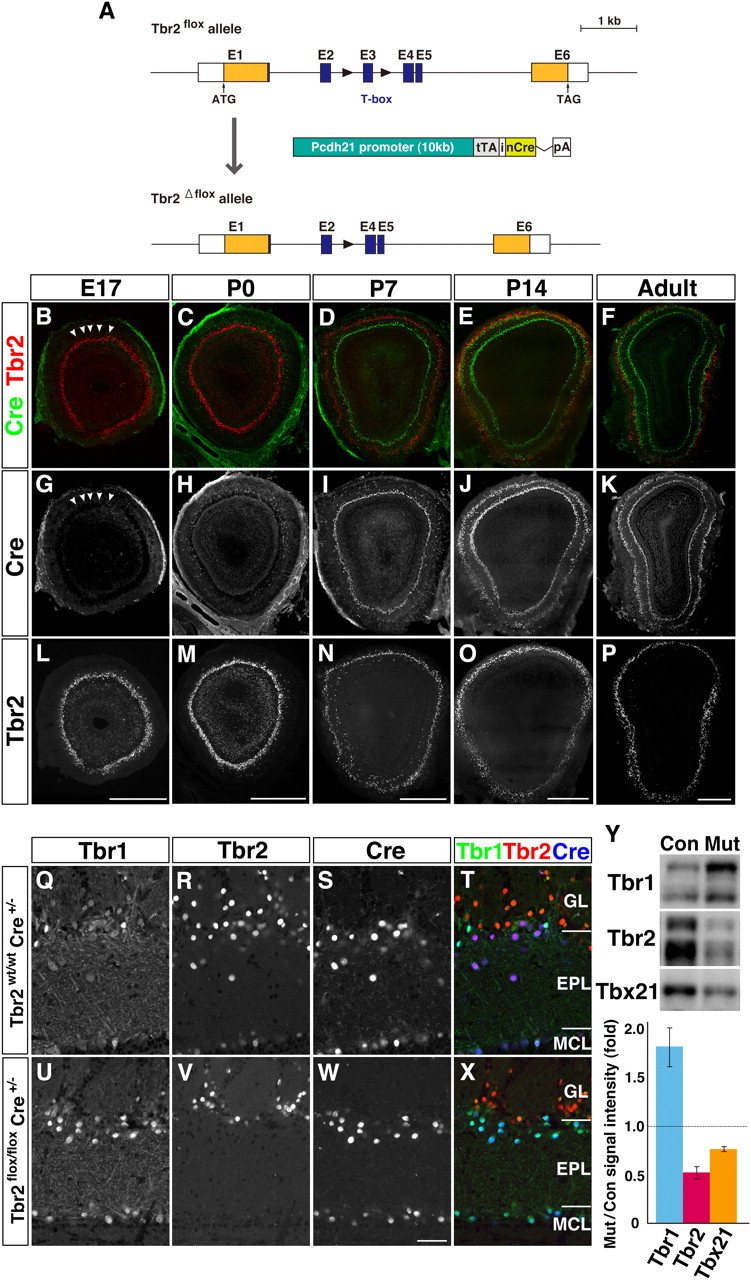
Tbr1 upregulation in Tbr2-deficient mitral and tufted cells. A, Generation of mitral/tufted cell-specific Tbr2 conditional knockout mice. Genomic organization of Tbr2flox allele, Tbr2flox allele, and Pcdh21-Cre transgene construct. Black triangles represent loxP sites. Pcdh21-Cre transgene includes tTA (tetracycline transactivator) and nCre (Cre recombinase with a nuclear localization signal) intervened by internal ribosome entry sequence (i) from human fibroblast growth factor 2 gene, followed by a rabbit β-globin polyadenylation signal (pA). B–P, Expression of Cre recombinase (green) and Tbr2 (red) in OB coronal sections of developing and adult Tbr2 conditional knockout (Tbr2flox/flox Cre+/−) mice. Cre protein is first detectable in mitral cells in the dorsal region of the OB at E17 (B, G; arrowheads). At P14 and later, Cre is strongly expressed in all the mitral and tufted cells where Tbr2 protein is specifically lost. Q–X, Triple immunofluorescence labeling of Tbr1 (Q, U), Tbr2 (R, V), and Cre (S, W) on adult OB coronal sections from Tbr2wt/wt; Cre+/− (Q–T) and Tbr2flox/flox; Cre+/− (U–X) mice. T, X, merged images (Tbr1, green; Tbr2, red; Cre, blue). Tbr2 protein is detectable in Cre-expressing mitral and tufted cells of Tbr2wt/wt mice (R–T), but not of Tbr2flox/flox mice (V–X). On the contrary, Tbr1 expression is increased in Cre-positive mitral and tufted cells in Tbr2flox/flox mice (U, W, X). Y, Quantification of Tbr1 subfamily proteins. OB homogenates from control (Con) and Tbr2 conditional knockout mice (Mut) were subjected to Western blot analysis. Intensity of each band was measured and statistically analyzed (bottom; values are mean ± SEM, n = 3 for each). For Tbr1 and Tbr2, intensities of both upper and lower bands were added. In Tbr2 conditional knockout mice, the amount of Tbr1 protein is increased by 1.82 ± 0.16-fold compared with control littermates, while Tbx21 protein is decreased by 0.76 ± 0.01-fold. Scale bars: B–P, 500 μm; Q–X, 50 μm.
These mice showed no obvious abnormalities in the gross anatomy of the OB, although the volume of the OB was slightly but significantly smaller (83.5 ± 0.10%, p < 0.0005). Axonal projection and glomerular targeting of the olfactory sensory neurons appeared normal, as assessed by immunohistochemical staining of various molecules in olfactory axons (OMP, OCAM, NQO1, neuropilin1, neuropilin2, MOR28, mOR-EG, and I7; data not shown) (Keller and Margolis, 1975; Yoshihara et al., 1997; Nagao et al., 2000; Gussing and Bohm, 2004; Kaneko-Goto et al., 2008).
On the other hand, the expression level of Tbr1 was greatly increased in Cre-positive mitral and tufted cells (Fig. 2Q,T,U,X,Y), indicating that the loss of Tbr2 led to compensatory induction of Tbr1 in a cell-autonomous manner. In contrast, slight but significant reduction of Tbx21 protein was observed by Western blot analysis (Fig. 2Y), although the difference was not obvious by immunohistochemistry (Fig. 4A,E). These results suggest a mutual regulatory mechanism among Tbr1 subfamily members in mitral and tufted cells; Tbr2 negatively regulates the expression of Tbr1, but the expression of Tbx21 is partially dependent on Tbr2.
Figure 4.
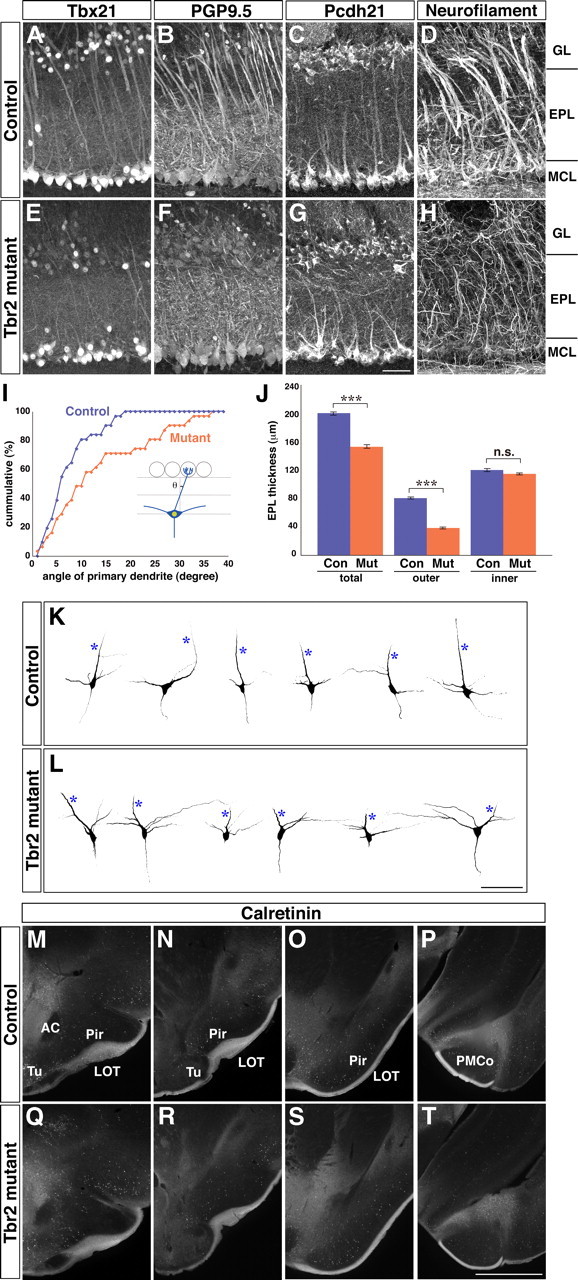
Abnormal dendritic morphology of Tbr2-deficient mitral and tufted cells. A–H, Immunofluorescence labeling of Tbx21 (A, E), PGP9.5 (B, F), Pcdh21 (C, G), and neurofilament-165 kDa (D, H) on OB coronal sections from control (A–D) and Tbr2 conditional knockout (E–H) mice. Dendritic morphology of mitral and tufted cells is abnormal in Tbr2 conditional knockout mice. I, Cumulative plots of the projection angles of mitral cell primary dendrites. Angles between the orientation of primary dendrites (as visualized by immunolabeling of neurofilament) and a line perpendicular to the OB layers were measured at the middle of the EPL (inset) from control (blue) and Tbr2 conditional knock-out (orange) mice (n = 39 mitral cells for each genotype). In contrast to control mice in which most primary dendrites project vertically toward target glomeruli, primary dendrites of Tbr2-deficient mitral cells extend into more random directions. J, Quantitative analysis of the EPL sublayer organization. Thickness of the total EPL, PGP9.5-negative outer EPL, and PGP9.5-positive inner EPL was measured from control and Tbr2-mutant OB sections. The thickness of outer EPL is significantly reduced in Tbr2 conditional knockout mice. Values are mean ± SEM (n = 5), ***p < 0.001 (two-tailed t test). K, L, Representative morphology of individual mitral cells of control (K) and Tbr2 conditional knockout (L) mice. Lucifer yellow was intracellularly injected into single mitral cells in fixed OB coronal slices of P16–P18 mice. Projected images of whole-cell shapes taken by a two-photon microscope are presented. Primary dendrites are indicated with asterisks. M–T, Anatomy of the LOT at different anteroposterior levels. Axons of mitral and tufted cells were visualized by immunofluorescence labeling of calretinin. The gross morphology of the LOT is not apparently affected in Tbr2 conditional knockout mice. AC, anterior commissure; Tu, olfactory tubercle; Pir, piriform cortex; PMCo, posteromedial cortical amygdaloid nucleus. Scale bars: (in G) A–H, K, L, 50 μm; (in T) M–T, 1 mm.
Subtype change of VGluTs in Tbr2-deficient mitral and tufted cells
The above-mentioned results demonstrate that Tbr2-deficient mitral and tufted cells express an altered combination of Tbr1 subfamily members, which may lead to some changes in expression of their downstream molecules. Hence, we examined the expression of VGluTs, which are late differentiation markers for mitral and tufted cells (Nakamura et al., 2005). To observe the expression of VGluT1 and VGluT2 mRNAs in Tbr1- and Tbr2-positive cells, we performed in situ hybridization (VGluT1 or VGluT2) combined with immunohistochemistry (Tbr1 or Tbr2) in adult OB sections (Fig. 3). In control mice, Tbr2-positive tufted cells strongly expressed VGluT1 (Fig. 3A), but not VGluT2 (Fig. 3B). On the other hand, Tbr1-positive tufted cells expressed VGluT1 moderately and VGluT2 weakly (Fig. 3C,D). Thus, Tbr1- and Tbr2-positive tufted cells represent distinct subtypes of tufted cells with different VGluT subtype expression. In Tbr2 conditional knockout mice, tufted cells that originally expressed Tbr2 became Tbr1-positive, and these cells expressed moderate levels of both VGluT1 and VGluT2 (Fig. 3G,H). Therefore, a change of Tbr1 subfamily expression led to a concomitant alteration of the subtype of VGluTs in tufted cells. In mitral cells of control mice, where both Tbr1 and Tbr2 are present (Fig. 1U,V,X), we observed high expression of VGluT1 and weak but significant expression of VGluT2 (Fig. 3I–L). The loss of Tbr2 and concomitant increase of Tbr1 led to a marked increase of VGluT2 (Fig. 3J,N,L,P). These results indicate that the expression of Tbr1 and Tbr2 are closely related to the expression levels of VGluT2 and VGluT1, respectively, and suggest that they may be critical determinants of the VGluT subtypes in mitral and tufted cells.
Figure 3.

Subtype change of VGluTs in Tbr2-deficient mitral and tufted cells. Double fluorescence labeling of Tbr2 (A, B, E, F, I, J, M, N, magenta) and Tbr1 (C, D, G, H, K, L, O, P, magenta) proteins with VGluT1 (A, C, E, G, I, K, M, O, green) and VGluT2 (B, D, F, H, J, L, N, P, green) mRNAs in tufted (A–H) and mitral (I–P) cells. In control mice, Tbr2-positive tufted cells express a high level of VGluT1 (A), but not VGluT2 (B), while Tbr1-positive tufted cells coexpress VGluT1 moderately (C) and VGluT2 weakly (D). In mitral cells where both Tbr1 and Tbr2 are present, VGluT1 and VGluT2 are also colocalized (I–L). In Tbr2-deficient mitral and tufted cells, expression of Tbr1 is increased and concomitantly the level of VGluT2 is upregulated (F, H, N, P). Asterisks in B indicate Tbr2-positive cells that are colocalized with VGluT2 mRNA, which may probably correspond to excitatory juxtaglomerular neurons. Scale bar, 50 μm.
Abnormal dendritic morphology of Tbr2-deficient mitral and tufted cells
We next investigated whether the Tbr2 gene disruption leads to cell-autonomous alternations in the anatomical properties of mitral and tufted cells. Immunohistochemistry using several markers for mitral and tufted cells (Tbx21, PGP9.5, Pcdh21, and neurofilament-165 kDa) revealed that dendritic morphology of mitral cells was dramatically changed in Tbr2 conditional knock-out mice (Fig. 4A–H). In control mice, mitral cells sent thick primary dendrites straight toward glomeruli in a radial direction (Fig. 4A–D). In contrast, primary dendrites of Tbr2-deficient mitral cells were thinner, winded, and projected in random directions (Fig. 4E–I).
Secondary dendrites of mitral cells predominantly distribute in the inner half of the EPL, delineating the EPL into two anatomically and functionally distinct sublayers: outer EPL and inner EPL (Mori et al., 1983). This segregation was clearly visualized by anti-PGP9.5 immunostaining in control mice (Fig. 4B). In Tbr2 conditional knockout mice, however, the PGP9.5-positive inner EPL occupied most of the EPL (Fig. 4F). We quantitated the average thickness of PGP9.5-positive (inner) and PGP9.5-negative (outer) EPLs in control and Tbr2 conditional knockout mice (Fig. 4J). Although the thickness of inner EPL did not differ between the two genotypes, the outer EPL was significantly thinner in Tbr2 conditional knockout mice, which led to the reduction of total EPL by ∼25% (Fig. 4J). The EPL mainly consists of dendrites of mitral and tufted cells, and cell bodies and dendrites of interneurons that make dendrodendritic synaptic connections onto mitral and tufted cells. Therefore, this result indicates that dendritic architectures and probably the connectivity among those neurons are altered in Tbr2 conditional knockout mice.
To examine the detailed dendritic morphology of individual mitral cells, a fluorescent dye, Lucifer yellow, was intracellularly injected into single mitral cells in fixed OB slices. Figure 4K and L show the representative examples of obtained images from control and Tbr2 conditional knockout mice, respectively. In control mice, primary dendrites were easily identified by their thick and straight morphology (asterisks). In addition, most secondary dendrites projected horizontally to the EPL. In contrast, Tbr2-deficient mitral cells projected both primary and secondary dendrites into various directions. Therefore, it was difficult to discriminate primary dendrites from the secondary dendrites in some mitral cells. These results demonstrate that Tbr2 is required for proper dendritic morphogenesis of mitral cells.
In contrast, general morphology of the lateral olfactory tract (LOT), where axons of mitral and tufted cells project, was not significantly altered in Tbr2 conditional knockout mice (Fig. 4M–T). This suggests that axonal projection patterns of mitral and tufted cells are not drastically changed, although we cannot exclude the possibility that morphology of individual axons might be altered inside the LOT.
Non-cell-autonomous defects in OB interneurons
The above observation on abnormal dendritic morphology of mitral cells and anatomical disorganization of the EPL prompted us to examine whether OB interneurons making dendrodendritic synaptic connections with mitral and tufted cells were also affected in Tbr2 conditional knockout mice. A homeobox transcription factor Arx is expressed in virtually all types of GABAergic local interneurons in the OB including granule cells and juxtaglomerular neurons (Yoshihara et al., 2005). The number and distribution of Arx-positive OB interneurons in Tbr2 conditional knockout mice did not apparently differ from those in control mice (Fig. 5C,G).
Figure 5.
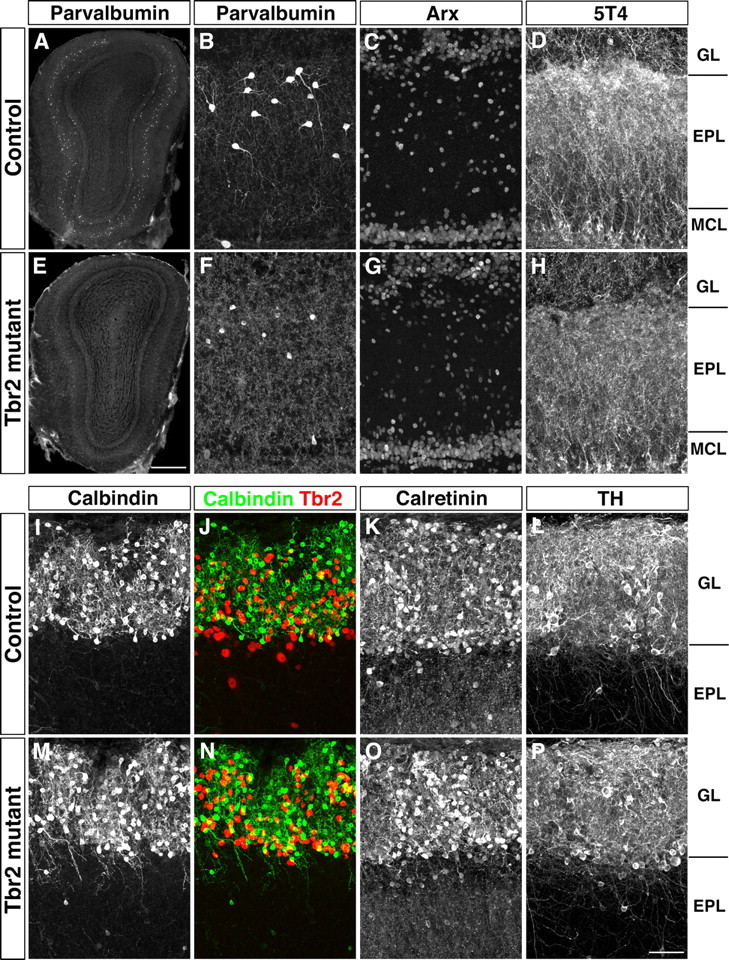
Non-cell-autonomous defects in OB inhibitory interneurons. A, B, E, F, Reduction and morphological alteration of parvalbumin-positive EPL interneurons in Tbr2 conditional knockout mice. OB sections from control (A) and Tbr2 conditional knockout (E) mice were immunostained with anti-parvalbumin antibody. Magnified views of the EPL are shown in B and F, respectively. C, G, Immunofluorescence labeling of Arx. D, H, Abnormal dendritic arborization of 5T4-positive granule cells. The density of 5T4-positive granule cell dendrites in the outer EPL is reduced in Tbr2 conditional knockout mice. I–P, Abnormal dendritic projections of calbindin-positive juxtaglomerular neurons. Immunofluorescence labeling of calbindin (I, J, M, N), calretinin (K, O), and TH (L, P) on OB coronal sections from control (I–L) and Tbr2 conditional knockout (M–P) mice. Merged images of calbindin (green) and Tbr2 (red) are shown in J and N. In Tbr2 conditional knockout mice dendrites of calbindin-positive juxtaglomerular neurons extend out of glomeruli into the EPL while they are restricted inside the GL in control mice. Calretinin- and TH-positive juxtaglomerular neurons are not morphologically different from control (K, L) and Tbr2 conditional knockout (O, P) mice. Scale bars: A, E, 500 μm; B–D, F–H, I–P, 50 μm.
The OB interneurons in GL and EPL can be classified into several types according to their morphology, cellular position, and characteristic expression of neuronal markers including TH, parvalbumin, calbindin, and calretinin (Batista-Brito et al., 2008; Kosaka and Kosaka, 2008, 2010). We noticed that the number of parvalbumin-positive interneurons in the EPL was markedly reduced in Tbr2 conditional knockout mice by more than two-fold (Fig. 5A,B,E,F; control, 843 ± 51; Tbr2 conditional knockout, 357 ± 33; p < 0.001). In addition, the morphology of individual parvalbumin-positive neurons was abnormal with shrunken soma and less arborized dendrites (Fig. 5B,F), suggesting the impaired development and function of parvalbumin-positive interneurons. In contrast, the numbers of calbindin-positive, calretinin-positive, and TH-positive neurons in the GL did not obviously change (Fig. 5I–P). However, dendrites of calbindin-positive juxtaglomerular neurons projected abnormally out of glomeruli, which was never observed in control mice (Fig. 5I,J,M,N).
A leucine-rich repeat-containing membrane protein 5T4 is expressed in a subset of granule cells whose dendrites preferentially arborize in the outer EPL (Imamura et al., 2006; Yoshihara et al., 2012). We also found that the 5T4 immunoreactivity in the outer EPL was clearly decreased in Tbr2 conditional knockout mice, suggesting the defective dendritic arborization of 5T4-positive granule cells (Fig. 5D,H). These results indicate that the loss of Tbr2 in mitral and tufted cells affects several types of OB interneurons, including parvalbumin-positive EPL interneurons, calbindin-positive juxtaglomerular neurons, and 5T4-positive granule cells in a non-cell-autonomous manner.
Impaired formation of dendrodendritic synapses
In the EPL, secondary dendrites of mitral and tufted cells make characteristic reciprocal synapses with dendrites of the inhibitory interneurons including granule cells. These dendrodendritic synapses importantly contribute to olfactory information processing in the OB by refinement of odor-tuning specificity (Yokoi et al., 1995; Mori et al., 1999; Abraham et al., 2010). We next asked whether the dendrodendritic synapses were properly organized in Tbr2 conditional knockout mice.
For this purpose, we performed triple-label immunohistochemistry for VGluT1, VGluT2, and VGAT in adult OB sections. Consistent with the results of in situ hybridization (Fig. 3), we detected in control mice strong VGluT1 signals throughout the EPL and inner plexiform layer (IPL) where dendrites and axons of mitral/tufted cells densely exist, respectively (Fig. 6A), whereas VGluT2 signals were weaker in these areas (Fig. 6B). In Tbr2 conditional knockout mice, significant decrease in VGluT1 signals and a concomitant increase of VGluT2 immunoreactivity in the EPL and IPL were observed (Fig. 6E,F), which was also consistent with the in situ hybridization results that the loss of Tbr2 in mitral/tufted cells led to the downregulation and upregulation of VGluT1 and VGluT2, respectively (Fig. 3). In contrast, the expression pattern and intensity of VGAT in GABAergic interneurons were not obviously different between control and Tbr2 conditional knockout mice (Fig. 6C,G).
Figure 6.
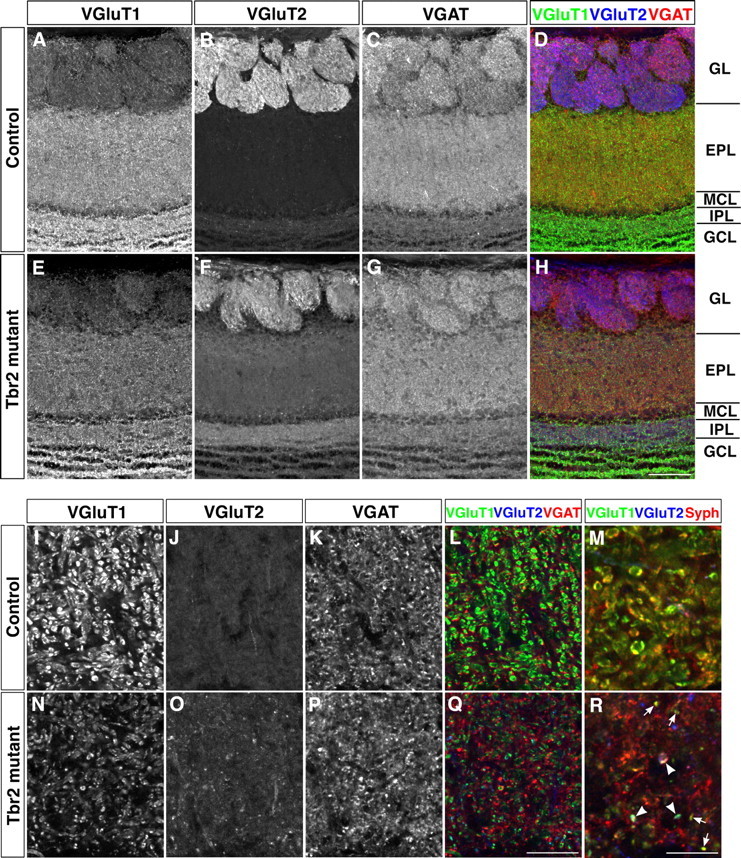
Molecular and structural alterations of dendrodendritic synapses in the EPL. Triple immunofluorescence labeling of VGluT1 (A, E, I, N), VGluT2 (B, F, J, O), and VGAT (C, G, K, P) on OB coronal sections from control (A–D, I–L) and Tbr2 conditional knockout (E–H, N–Q) mice. Merged images are shown in D, H, L, and Q (VGluT1, green; VGluT2, blue; VGAT, red). A–H, In the EPL and IPL of Tbr2 conditional knockout mice, VGluT1 signals are reduced, whereas VGluT2 signals are increased, reflecting the subtype transformation of VGluTs in mitral and tufted cells. I–R, Magnified views of the inner EPL. In control mice, many large VGluT1-positive puncta are observed that are closely apposed to VGAT signals (I, K, L), corresponding to dendrodendritic reciprocal synapses between mitral/tufted cells and inhibitory interneurons. In Tbr2 conditional knockout mice, the size of VGluT1-positive puncta is smaller, and most of them are found isolated from VGAT signals (N, P, Q). VGluT1 or VGluT2 signals are closely overlapped with synaptophysin (Syph)-positive puncta both in control and Tbr2 conditional knockout mice (M, R), demonstrating that VGluT proteins are localized in presynaptic specifications. Arrows and arrowheads in R indicate VGluT1- and VGluT1/VGluT2-positive puncta colocalized with Syph, respectively. Scale bars: A–H, 100 μm; I–L, N–Q, 20 μm; M, R, 10 μm.
At higher magnification, many of the VGluT1-positive puncta were observed in close apposition to VGAT-positive small puncta in the EPL of control mice (Fig. 6I,K,L), which likely reflects the sites of dendrodendritic synapses between the glutamatergic mitral/tufted cells and the GABAergic interneurons. In Tbr2 conditional knockout mice, both the size and the number of VGluT1-positive puncta were markedly decreased, whereas the number of VGluT2-positive puncta was conversely increased (Fig. 6N,O). Triple immunohistochemistry revealed that most of the VGluT1- and VGluT2-positive puncta were closely colocalized with the presynaptic marker, synaptophysin, in both control and Tbr2 conditional knockout mice, confirming that VGluT1 and VGluT2 reside in presynaptic specifications in both genotypes (Fig. 6M,R). Although the size and total number of VGAT-positive puncta did not apparently differ between two genotypes (Fig. 6K,P), the VGAT-positive puncta in close proximity to VGluT1- or VGluT2-positive puncta were much fewer in mutant mice (Fig. 6L,Q). Quantitative analysis revealed that the ratio of VGAT-positive puncta that were apposed to either VGluT1- or VGluT2-positive puncta was reduced by ∼2-fold in Tbr2 conditional knockout mice both in outer EPL (control, 46.4 ± 2.8%; Tbr2 conditional knockout, 22.0 ± 3.5%; p < 0.01) and inner EPL (control, 42.7 ± 1.1%; Tbr2 conditional knockout, 25.5 ± 2.8%; p < 0.05). These results imply that the formation of dendrodendritic synapses between the mitral/tufted cells and the inhibitory interneurons is severely impaired in Tbr2 conditional knockout mice.
Hyperactivation of Tbr2-deficient mitral and tufted cells by odor stimulation
The above results imply that Tbr2-deficient mitral and tufted cells may receive less inhibitory inputs from OB local interneurons. Therefore, we finally examined whether Tbr2 conditional knockout mice show any defects in odor-induced neuronal responses.
Phosphorylations of intracellular signaling molecules such as Erk (MAP kinase) and CREB have been used as indicators for neuronal activation in many systems including the OB (Sgambato et al., 1998; Moon et al., 1999; Mirich et al., 2004; Miwa and Storm, 2005). NFκB is a transcription factor expressed in various types of cells including immune cells and neurons, which is rapidly phosphorylated upon cellular activation for subsequent translocation into the nucleus. Recently, Fujikawa et al. (2011) demonstrated that the phosphorylation of NFκB could also be used as a reliable marker for somatosensory stimuli-induced neuronal activation in dorsal root ganglia.
Using transgenic mice (mOR-EG-ires-gapEGFP) in which eugenol-responsive glomeruli are specifically labeled by EGFP, we found that the odorant stimulation of mice also rapidly and robustly induced the phosphorylation of NFκB in cohort of neurons in the OB, including juxtaglomerular neurons, tufted cells, mitral cells, and granule cells surrounding the activated glomeruli (Fig. 7A–D). Thus, pNFκB can serve as a suitable marker for detecting odor-induced activation of OB neurons including mitral and tufted cells.
Figure 7.

Hyperactivation of Tbr2-deficient mitral and tufted cells by odor stimulation. A–D, Induction of NFκB phosphorylation in OB neurons upon odor exposure. mOR-EG-ires-gapEGFP transgenic mice were stimulated by either vehicle (A, B) or 5% eugenol (C, D) for 15 min, and the OB sections were immunostained with an antibody specifically recognizing pNFκB. In the eugenol-stimulated mouse, pNFκB signals are observed in the nuclei of juxtaglomerular neurons surrounding GFP-positive glomerulus, tufted cells (large nuclei; arrows), mitral cells, and granule cells that reside beneath the glomerulus (C, D). E–H, Neuronal activation in OB sections from odor-stimulated control (E, F) and Tbr2 conditional knockout (G, H) mice. Mice were exposed to 2% isoamyl acetate for 15 min and activated OB neurons were detected by pNFκB immunohistochemistry. Lateral areas of the OB sections are magnified in F and H. Larger numbers of pNFκB-positive mitral and tufted cells are observed in Tbr2 conditional knockout mice. I–K, Quantitative data showing the numbers of pNFκB-positive tufted cells (I), mitral cells (J), and juxtaglomerular neurons (K) from control and Tbr2 conditional knockout mice stimulated with either vehicle (mineral oil), 2% isoamyl acetate (IAA), 5% eugenol (EG), or 5% octanal (OCT). Values are mean ± SEM (n = 3), *p < 0.05, **p < 0.01, ***p < 0.001 (two-tailed t test). Scale bars: (in D) A–D, 100 μm; (in G) E, G, 500 μm; (in H) F, H, 200 μm.
By using this marker, we examined whether odor-induced activation of mitral and tufted cells was affected in Tbr2 conditional knockout mice. When mice were exposed to an odorant, isoamyl acetate, the numbers of pNFκB-positive mitral and tufted cells were significantly larger in Tbr2 conditional knock-out mice compared with control mice (Fig. 7E–J). In addition, the activated mitral and tufted cells were observed in a broader area of the OB (Fig. 7E–H), suggesting a decrease in the extent of lateral inhibition among mitral and tufted cells via inhibitory interneurons. This hyperactivation of mitral and tufted cells was observed also with other odorant stimuli such as eugenol and octanal (Fig. 7I,J). Even in a control (vehicle-treated) condition, the numbers of pNFκB-positive mitral and tufted cells in Tbr2 conditional knockout mice were ∼2-fold larger than those in control mice (Fig. 7I,J). These results indicate that Tbr2-deficient mitral and tufted cells are more susceptible to odorant stimulation, probably due to reduced inputs from inhibitory interneurons in the OB. Interestingly, the numbers of pNFκB-positive juxtaglomerular neurons, the majority of which are inhibitory, were significantly reduced in Tbr2 conditional knockout mice stimulated by odorants (Fig. 7K). Juxtaglomerular neurons are known to contribute to intraglomerular and interglomerular inhibitions of mitral and tufted cells (Aungst et al., 2003). Therefore, it is likely that the impaired interaction between mitral/tufted cells and juxtaglomerular neurons in Tbr2 conditional knockout mice have led to the less inhibitory signals on mitral and tufted cells, rendering them more excitable. Thus, Tbr2 is required not only for proper differentiation of OB neurons in both cell-autonomous and non-cell-autonomous manners, but also for establishment of functional neuronal circuitry in the OB and maintenance of excitatory–inhibitory balance crucial for odor information processing.
Discussion
In this study, we analyzed in vivo loss-of-function phenotypes of Tbr2 in mitral and tufted cells and clarified that Tbr2 is required for establishing proper neuronal circuitry in the OB. The loss of Tbr2 in mitral and tufted cells led to multiple defects of OB neurons both cell-autonomously and non-cell-autonomously with respect to their molecular expression, dendritic morphogenesis, and synapse formation. As a result, Tbr2-deficient mitral and tufted cells received less inhibitory inputs from local interneurons and became more susceptible to be activated by odor stimuli. These results demonstrate that Tbr2 plays an important role in maintenance of excitatory–inhibitory balance in the OB neural circuitry.
Specification of glutamatergic neuronal lineages by T-box transcription factors
Our immunohistochemical analysis revealed that Tbr1 subfamily members exhibit distinct and overlapping expression patterns in OB neurons including mitral and tufted cells. The unique combinatorial expression of Tbr1 subfamily members subdivides mitral and tufted cells into at least three different populations: Tbr1-positive external tufted cells, Tbr2/Tbx21-positive external/middle/internal tufted cells, and Tbr1/Tbr2/Tbx21-positive mitral cells. In addition, Tbr2 is expressed in a subset of neurons surrounding glomeruli, which do not express any well known markers for juxtaglomerular inhibitory interneurons such as calbindin, calretinin, TH, or Arx. Recent reports described that there are glutamatergic excitatory juxtaglomerular interneurons that express Tbr2 (Brill et al., 2009; Winpenny et al., 2011). Because Tbr1 subfamily members are mostly expressed in glutamatergic neurons in many brain regions including the cerebral neocortex, hippocampus, retina, cerebellum, and OB (with the exception of cerebellar Purkinje cells, in which Tbr1 is expressed in GABAergic neurons) (Bulfone et al., 1995; Englund et al., 2005; Fink et al., 2006; Hevner et al., 2006; Hong and Hsueh, 2007; Méndez-Gómez et al., 2011), it is likely that they commonly promote the glutamatergic neuronal differentiation. At the same time, their combinatorial expression may determine the sublineages of individual glutamatergic neurons.
Actually, in situ hybridization analysis revealed that Tbr1- and Tbr2-positive mitral and tufted cells express different combinations of VGluT subtypes; tufted cells that are positive for Tbr2 but not Tbr1 express only VGluT1, while mitral/tufted cells positive for Tbr1 express both VGluT1 and VGluT2. Loss of Tbr2 and increase of Tbr1 in these cells was accompanied by a concomitant shift of VGluT expression. Thus, Tbr1 and Tbr2 may specify different subtypes of glutamatergic neurons by regulating the distinct expression of two VGluTs. Although functional differences between VGluT1 and VGluT2 have not been clearly identified, a recent study reported that hippocampal synapses bearing VGluT1 and VGluT2 have different physiological properties (Weston et al., 2011). Therefore, Tbr1 and Tbr2 may indirectly regulate the synaptic functionalities of mitral and tufted cells through their distinct downstream target molecules.
Requirement of Tbr2 for proper differentiation of mitral and tufted cells
In addition to the changes in molecular expression, including Tbr1 and VGluTs, Tbr2-deficient mitral and tufted cells exhibited abnormalities in their dendritic morphology (Fig. 4A–L). In contrast to the dramatic changes in the dendritic organization, the gross anatomy of the LOT consisting of mitral and tufted cell axons was not obviously affected in Tbr2 conditional knockout mice (Fig. 4M–T).
Many aspects of mitral/tufted cell differentiation occur at different time points during development. For example, axons of mitral cells start to project as early as E12 (Inaki et al., 2004; Blanchart et al., 2006), but differentiation of the dendrites takes place at later developmental stages. In our mutant mice, the onsets of Cre in mitral (E17) and tufted (P7) cells were later than those of endogenous Tbr2 (Fig. 2B–P). Therefore, the phenotypes represent the functions of Tbr2 at relatively later differentiation events, and may have been especially emphasized in dendritic differentiation. Initially, from late embryonic to early postnatal stages, mitral and tufted cells extend numerous uniform dendrites that innervate into multiple glomeruli. They undergo extensive remodeling afterward, and it is not until approximately P10 when functional glomeruli are formed between single primary dendrites of mitral/tufted cells and axons of olfactory sensory neurons (Malun and Brunjes, 1996; Blanchart et al., 2006). Simultaneously, secondary dendrites differentiate from primary dendrites. In Tbr2 conditional knockout mice, both primary and secondary dendrites projected into aberrant directions (Fig. 4K,L), suggesting that dendritic remodeling might not have properly proceeded. By analyzing our Tbr2 conditional knockout mice, it may be possible to address the molecular mechanisms of dendritic differentiation of mitral/tufted cells without interference from defects in early differentiation, such as proliferation, survival, and/or migration of the neurons.
Non-cell-autonomous defects of OB interneurons caused by Tbr2 deficiency
Loss of Tbr2 in mitral and tufted cells also caused non-cell-autonomous defects in several types of OB interneurons. We detected severe loss and impaired differentiation of parvalbumin-positive interneurons in the EPL. In somatosensory and visual cortices, TrkB receptor is expressed by parvalbumin-positive interneurons whose development is regulated by brain-derived neurotrophic factor (BDNF) (Patz et al., 2004; Itami et al., 2007). It is also known that mice lacking BDNF show significant loss of parvalbumin immunoreactivity in the EPL interneurons, while other calcium-binding protein-containing neurons in the OB appeared unaffected (Berghuis et al., 2006). Several previous reports described the expression of BDNF in mitral cells (McLean et al., 2001; Cao et al., 2007; Biju et al., 2008). Therefore, it is likely that the loss of Tbr2 may have resulted in impaired expression or secretion of BDNF, leading to insufficient neurotrophic effects on parvalbumin-positive interneurons.
Tbr2 conditional knockout mice also exhibited defects in dendritic patterning of a subset of granule cells that expressed 5T4 protein. Normally, their dendrites preferentially arborize in the outer EPL in a sensory input-dependent manner, targeting the secondary dendrites of tufted cells (Imamura et al., 2006, Yoshihara et al., 2012). In Tbr2 conditional knockout mice, the layer organization of the EPL was disturbed, especially in the outer part, indicating that the dendritic architecture of the tufted cells was altered. Therefore, impaired interaction of 5T4-positive granule cells with tufted cells may have led to defects in their proper dendritic development. A similar phenotype was observed in the calbindin-positive juxtaglomerular neurons. Normally, they elaborate dendrites only within glomeruli to form synapses onto the primary dendrites of mitral and tufted cells. In Tbr2 conditional knockout mice, however, many dendrites abnormally extended out of glomeruli into the EPL. This abnormality may also have been caused by the impaired dendritic formation of mitral and tufted cells, the synaptic targets of calbindin-positive juxtaglomerular neurons.
Our data demonstrate that Tbr2-positive mitral and tufted cells play critical roles for proper differentiation and wiring of subsets of OB interneurons. The Tbr2-positive mitral and tufted cells may serve as a source of trophic factors, scaffolds for dendritic targeting, or compartmentalization of the sublayer structure of the OB. Most OB interneurons are continuously generated and differentiate even in adulthood, and they are involved in functional plasticity of the OB. Therefore, sustained expression of Tbr2 in mitral and tufted cells may also play important roles in maintaining the functional integrity of the OB.
Disrupted excitatory–inhibitory balance of OB neural circuitry
Abnormal dendritic morphology of both mitral/tufted cells and several types of GABAergic interneurons in the OB suggested that their physical and functional interactions may have been impaired in Tbr2 conditional knockout mice. Indeed, we observed a significantly smaller number of sites where VGAT and VGluTs were closely apposed in the EPL (Fig. 6L,Q). This implies that dendrodendritic synapses between excitatory projection neurons and GABAergic interneruons are reduced in Tbr2 conditional knockout mice. This finding suggests that Tbr2-deficient mitral and tufted cells cannot properly receive reciprocal feedback and lateral inhibition via the local OB circuit.
Lateral inhibition is important for enhancement of odor-tuning specificity of mitral and tufted cells (Yokoi et al., 1995; Abraham et al., 2010). In Tbr2 conditional knockout mice, larger numbers of mitral and tufted cells were activated by various odorant stimuli. This result indicates that the odorant sensitivity is higher and the molecular receptive range is broader in Tbr2-deficient mitral and tufted cells than in control mice, presumably by the disruption of the excitatory–inhibitory balance in OB neural circuitry. Because the regional specificities of activated mitral and tufted cells upon stimulation with individual odorants were mostly conserved with the activated areas broadened, it is likely that odor-activated mitral and tufted cells received less local inhibitions by surrounding interneurons rather than randomly activated by nonspecific odors.
Triggered by the present study, it is tempting to ask whether neural activities in higher olfactory centers are also elevated and whether the odor discrimination ability is impaired in Tbr2 conditional knockout mice. Electrophysiological and behavioral analyses using these mice will reveal further insights into the molecular and cellular mechanisms underlying excitatory–inhibitory balance in the olfactory neural circuitry and the higher olfactory functions.
Footnotes
This work was supported in part by a Grant-in-Aid for Young Researchers (R.M.), Scientific Research (B) (Y.Y.), Priority Areas (Cellular Sensor) (Y.Y.), and Innovative Areas (Systems Molecular Ethology) (Y.Y.) from the Ministry of Education, Culture, Sports, Science, and Technology of Japan. We thank K. Matsumura (Osaka Institute of Technology) for helpful suggestions on the use of anti-phosphorylated-NFκB antibody, W. H. Klein (University of Texas) for Eomesflox/flox mice, M. Yokoi (Kyoto University) for Pcdh21-Cre mice, K. Touhara (The University of Tokyo) for mOR-EG-ires-gapEGFP mice, K. Kitamura (Mitsubishi Kagaku Institute of Life Science) for anti-Arx antibody, T. Kaneko and K. Nakamura (Kyoto University) for anti-VGluT2 antibody, BSI-Olympus Collaboration Center and Research Resource Center for technical assistance, and members of the Yoshihara laboratory for valuable discussions.
References
- Abraham NM, Egger V, Shimshek DR, Renden R, Fukunaga I, Sprengel R, Seeburg PH, Klugmann M, Margrie TW, Schaefer AT, Kuner T. Synaptic inhibition in the olfactory bulb accelerates odor discrimination in mice. Neuron. 2010;65:399–411. doi: 10.1016/j.neuron.2010.01.009. [DOI] [PMC free article] [PubMed] [Google Scholar]
- Arnold SJ, Huang GJ, Cheung AF, Era T, Nishikawa S, Bikoff EK, Molnár Z, Robertson EJ, Groszer M. The T-box transcription factor Eomes/Tbr2 regulates neurogenesis in the cortical subventricular zone. Genes Dev. 2008;22:2479–2484. doi: 10.1101/gad.475408. [DOI] [PMC free article] [PubMed] [Google Scholar]
- Aungst JL, Heyward PM, Puche AC, Karnup SV, Hayar A, Szabo G, Shipley MT. Centre-surround inhibition among olfactory bulb glomeruli. Nature. 2003;426:623–629. doi: 10.1038/nature02185. [DOI] [PubMed] [Google Scholar]
- Batista-Brito R, Close J, Machold R, Fishell G. The distinct temporal origins of olfactory bulb interneuron subtypes. J Neurosci. 2008;28:3966–3975. doi: 10.1523/JNEUROSCI.5625-07.2008. [DOI] [PMC free article] [PubMed] [Google Scholar]
- Bedogni F, Hodge RD, Elsen GE, Nelson BR, Daza RA, Beyer RP, Bammler TK, Rubenstein JL, Hevner RF. Tbr1 regulates regional and laminar identity of postmitotic neurons in developing neocortex. Proc Natl Acad Sci U S A. 2010;107:13129–13134. doi: 10.1073/pnas.1002285107. [DOI] [PMC free article] [PubMed] [Google Scholar]
- Berghuis P, Agerman K, Dobszay MB, Minichiello L, Harkany T, Ernfors P. Brain-derived neurotrophic factor selectively regulates dendritogenesis of parvalbumin-containing interneurons in the main olfactory bulb through the PLCγ pathway. J Neurobiol. 2006;66:1437–1451. doi: 10.1002/neu.20319. [DOI] [PubMed] [Google Scholar]
- Biju KC, Mast TG, Fadool DA. Olfactory sensory deprivation increases the number of proBDNF-immunoreactive mitral cells in the olfactory bulb of mice. Neurosci Lett. 2008;447:42–47. doi: 10.1016/j.neulet.2008.09.050. [DOI] [PMC free article] [PubMed] [Google Scholar]
- Blanchart A, De Carlos JA, López-Mascaraque L. Time frame of mitral cell development in the mice olfactory bulb. J Comp Neurol. 2006;496:529–543. doi: 10.1002/cne.20941. [DOI] [PubMed] [Google Scholar]
- Brill MS, Ninkovic J, Winpenny E, Hodge RD, Ozen I, Yang R, Lepier A, Gascón S, Erdelyi F, Szabo G, Parras C, Guillemot F, Frotscher M, Berninger B, Hevner RF, Raineteau O, Götz M. Adult generation of glutamatergic olfactory bulb interneurons. Nat Neurosci. 2009;12:1524–1533. doi: 10.1038/nn.2416. [DOI] [PMC free article] [PubMed] [Google Scholar]
- Bulfone A, Smiga SM, Shimamura K, Peterson A, Puelles L, Rubenstein JL. T-Brain-1: a homolog of Brachyury whose expression defines molecularly distinct domains within the cerebral cortex. Neuron. 1995;15:63–78. doi: 10.1016/0896-6273(95)90065-9. [DOI] [PubMed] [Google Scholar]
- Cao L, Dhilla A, Mukai J, Blazeski R, Lodovichi C, Mason CA, Gogos JA. Genetic modulation of BDNF signaling affects the outcome of axonal competition in vivo. Curr Biol. 2007;17:911–921. doi: 10.1016/j.cub.2007.04.040. [DOI] [PMC free article] [PubMed] [Google Scholar]
- Dhawale AK, Hagiwara A, Bhalla US, Murthy VN, Albeanu DF. Non-redundant odor coding by sister mitral cells revealed by light addressable glomeruli in the mouse. Nat Neurosci. 2010;13:1404–1412. doi: 10.1038/nn.2673. [DOI] [PMC free article] [PubMed] [Google Scholar]
- Englund C, Fink A, Lau C, Pham D, Daza RA, Bulfone A, Kowalczyk T, Hevner RF. Pax6, Tbr2, and Tbr1 are expressed sequentially by radial glia, intermediate progenitor cells, and postmitotic neurons in developing neocortex. J Neurosci. 2005;25:247–251. doi: 10.1523/JNEUROSCI.2899-04.2005. [DOI] [PMC free article] [PubMed] [Google Scholar]
- Faedo A, Ficara F, Ghiani M, Aiuti A, Rubenstein JL, Bulfone A. Developmental expression of the T-box transcription factor T-bet/Tbx21 during mouse embryogenesis. Mech Dev. 2002;116:157–160. doi: 10.1016/s0925-4773(02)00114-4. [DOI] [PubMed] [Google Scholar]
- Fink AJ, Englund C, Daza RA, Pham D, Lau C, Nivison M, Kowalczyk T, Hevner RF. Development of the deep cerebellar nuclei: transcription factors and cell migration from the rhombic lip. J Neurosci. 2006;26:3066–3076. doi: 10.1523/JNEUROSCI.5203-05.2006. [DOI] [PMC free article] [PubMed] [Google Scholar]
- Fujikawa M, Nishitani N, Ibuki T, Kobayashi S, Matsumura K. Sensory stimuli induce nuclear translocation and phosphorylation of nuclear factor kappa B in primary sensory neurons of mice. Neurosci Res. 2011;71:178–182. doi: 10.1016/j.neures.2011.06.009. [DOI] [PubMed] [Google Scholar]
- Gussing F, Bohm S. NQO1 activity in the main and the accessory olfactory systems correlates with the zonal topography of projection maps. Eur J Neurosci. 2004;19:2511–2518. doi: 10.1111/j.0953-816X.2004.03331.x. [DOI] [PubMed] [Google Scholar]
- Hevner RF, Hodge RD, Daza RA, Englund C. Transcription factors in glutamatergic neurogenesis: Conserved programs in neocortex, cerebellum, and adult hippocampus. Neurosci Res. 2006;55:223–233. doi: 10.1016/j.neures.2006.03.004. [DOI] [PubMed] [Google Scholar]
- Hong CJ, Hsueh YP. Cytoplasmic distribution of T-box transcription factor Tbr-1 in adult rodent brain. J Chem Neuroanat. 2007;33:124–130. doi: 10.1016/j.jchemneu.2007.01.005. [DOI] [PubMed] [Google Scholar]
- Imamura F, Nagao H, Naritsuka H, Murata Y, Taniguchi H, Mori K. A leucine-rich repeat membrane protein, 5T4, is expressed by a subtype of granule cells with dendritic arbors in specific strata of the mouse olfactory bulb. J Comp Neurol. 2006;495:754–768. doi: 10.1002/cne.20896. [DOI] [PubMed] [Google Scholar]
- Inaki K, Nishimura S, Nakashiba T, Itohara S, Yoshihara Y. Laminar organization of the developing lateral olfactory tract revealed by differential expression of cell recognition molecules. J Comp Neurol. 2004;479:243–256. doi: 10.1002/cne.20270. [DOI] [PubMed] [Google Scholar]
- Itami C, Kimura F, Nakamura S. Brain-derived neurotrophic factor regulates the maturation of layer 4 fast-spiking cells after the second postnatal week in the developing barrel cortex. J Neurosci. 2007;27:2241–2252. doi: 10.1523/JNEUROSCI.3345-06.2007. [DOI] [PMC free article] [PubMed] [Google Scholar]
- Kaneko-Goto T, Yoshihara S, Miyazaki H, Yoshihara Y. BIG-2 mediates olfactory axon convergence to target glomeruli. Neuron. 2008;57:834–846. doi: 10.1016/j.neuron.2008.01.023. [DOI] [PubMed] [Google Scholar]
- Keller A, Margolis FL. Immunological studies of the rat olfactory marker protein. J Neurochem. 1975;24:1101–1106. doi: 10.1111/j.1471-4159.1975.tb03883.x. [DOI] [PubMed] [Google Scholar]
- Kosaka T, Kosaka K. Heterogeneity of parvalbumin-containing neurons in the mouse main olfactory bulb, with special reference to short-axon cells and bIV-spectrin positive dendritic segments. Neurosci Res. 2008;60:56–72. doi: 10.1016/j.neures.2007.09.008. [DOI] [PubMed] [Google Scholar]
- Kosaka T, Kosaka K. Heterogeneity of calbindin-containing neurons in the mouse main olfactory bulb: I. General description. Neurosci Res. 2010;67:275–292. doi: 10.1016/j.neures.2010.04.009. [DOI] [PubMed] [Google Scholar]
- Malun D, Brunjes PC. Development of olfactory glomeruli: temporal and spatial interactions between olfactory receptor axons and mitral cells in opossums and rats. J Comp Neurol. 1996;368:1–16. doi: 10.1002/(SICI)1096-9861(19960422)368:1<1::AID-CNE1>3.0.CO;2-7. [DOI] [PubMed] [Google Scholar]
- Mao CA, Kiyama T, Pan P, Furuta Y, Hadjantonakis AK, Klein WH. Eomesodermin, a target gene of Pou4f2, is required for retinal ganglion cell and optic nerve development in the mouse. Development. 2008;135:271–280. doi: 10.1242/dev.009688. [DOI] [PMC free article] [PubMed] [Google Scholar]
- McLean JH, Darby-King A, Bonnell WS. Neonatal olfactory sensory deprivation decreases BDNF in the olfactory bulb of the rat. Brain Res Dev Brain Res. 2001;128:17–24. doi: 10.1016/s0165-3806(01)00144-4. [DOI] [PubMed] [Google Scholar]
- Méndez-Gómez HR, Vergaño-Vera E, Abad JL, Bulfone A, Moratalla R, de Pablo F, Vicario-Abejón C. The T-box brain 1 (Tbr1) transcription factor inhibits astrocyte formation in the olfactory bulb and regulates neural stem cell fate. Mol Cell Neurosci. 2011;46:108–121. doi: 10.1016/j.mcn.2010.08.011. [DOI] [PubMed] [Google Scholar]
- Mirich JM, Illig KR, Brunjes PC. Experience-dependent activation of extracellular signal-related kinase (ERK) in the olfactory bulb. J Comp Neurol. 2004;479:234–241. doi: 10.1002/cne.20325. [DOI] [PubMed] [Google Scholar]
- Miwa N, Storm DR. Odorant-induced activation of extracellular signal-regulated kinase/mitogen-activated protein kinase in the olfactory bulb promotes survival of newly formed granule cells. J Neurosci. 2005;25:5404–5412. doi: 10.1523/JNEUROSCI.1039-05.2005. [DOI] [PMC free article] [PubMed] [Google Scholar]
- Moon C, Sung YK, Reddy R, Ronnett GV. Odorants induce the phosphorylation of the cAMP response element binding protein in olfactory receptor neurons. Proc Natl Acad Sci U S A. 1999;96:14605–14610. doi: 10.1073/pnas.96.25.14605. [DOI] [PMC free article] [PubMed] [Google Scholar]
- Mori K, Kishi K, Ojima H. Distribution of dendrites of mitral, displaced mitral, tufted, and granule cells in the rabbit olfactory bulb. J Comp Neurol. 1983;219:339–355. doi: 10.1002/cne.902190308. [DOI] [PubMed] [Google Scholar]
- Mori K, Nagao H, Yoshihara Y. The olfactory bulb: coding and processing of odor molecule information. Science. 1999;286:711–715. doi: 10.1126/science.286.5440.711. [DOI] [PubMed] [Google Scholar]
- Nagai Y, Sano H, Yokoi M. Transgenic expression of Cre recombinase in mitral/tufted cells of the olfactory bulb. Genesis. 2005;43:12–16. doi: 10.1002/gene.20146. [DOI] [PubMed] [Google Scholar]
- Nagao H, Yoshihara Y, Mitsui S, Fujisawa H, Mori K. Two mirror-image sensory maps with domain organization in the mouse main olfactory bulb. Neuroreport. 2000;11:3023–3027. doi: 10.1097/00001756-200009110-00039. [DOI] [PubMed] [Google Scholar]
- Naiche LA, Harrelson Z, Kelly RG, Papaioannou VE. T-box genes in vertebrate development. Annu Rev Genet. 2005;39:219–239. doi: 10.1146/annurev.genet.39.073003.105925. [DOI] [PubMed] [Google Scholar]
- Nakamura K, Hioki H, Fujiyama F, Kaneko T. Postnatal changes of vesicular glutamate transporter (VGluT)1 and VGluT2 immunoreactivities and their colocalization in the mouse forebrain. J Comp Neurol. 2005;492:263–288. doi: 10.1002/cne.20705. [DOI] [PubMed] [Google Scholar]
- Naritsuka H, Sakai K, Hashikawa T, Mori K, Yamaguchi M. Perisomatic-targeting granule cells in the mouse olfactory bulb. J Comp Neurol. 2009;515:409–426. doi: 10.1002/cne.22063. [DOI] [PubMed] [Google Scholar]
- Oka Y, Katada S, Omura M, Suwa M, Yoshihara Y, Touhara K. Odorant receptor map in the mouse olfactory bulb: in vivo sensitivity and specificity of receptor-defined glomeruli. Neuron. 2006;52:857–869. doi: 10.1016/j.neuron.2006.10.019. [DOI] [PubMed] [Google Scholar]
- Patz S, Grabert J, Gorba T, Wirth MJ, Wahle P. Parvalbumin expression in visual cortical interneurons depends on neuronal activity and TrkB ligands during an early period of postnatal development. Cereb Cortex. 2004;14:342–351. doi: 10.1093/cercor/bhg132. [DOI] [PubMed] [Google Scholar]
- Russ AP, Wattler S, Colledge WH, Aparicio SA, Carlton MB, Pearce JJ, Barton SC, Surani MA, Ryan K, Nehls MC, Wilson V, Evans MJ. Eomesodermin is required for mouse trophoblast development and mesoderm formation. Nature. 2000;404:95–99. doi: 10.1038/35003601. [DOI] [PubMed] [Google Scholar]
- Sato Y, Miyasaka N, Yoshihara Y. Mutually exclusive glomerular innervation by two distinct types of olfactory sensory neurons revealed in transgenic zebrafish. J Neurosci. 2005;25:4889–4897. doi: 10.1523/JNEUROSCI.0679-05.2005. [DOI] [PMC free article] [PubMed] [Google Scholar]
- Sessa A, Mao CA, Hadjantonakis AK, Klein WH, Broccoli V. Tbr2 directs conversion of radial glia into basal precursors and guides neuronal amplification by indirect neurogenesis in the developing neocortex. Neuron. 2008;60:56–69. doi: 10.1016/j.neuron.2008.09.028. [DOI] [PMC free article] [PubMed] [Google Scholar]
- Sgambato V, Pagès C, Rogard M, Besson MJ, Caboche J. Extracellular signal-regulated kinase (ERK) controls immediate early gene induction on corticostriatal stimulation. J Neurosci. 1998;18:8814–8825. doi: 10.1523/JNEUROSCI.18-21-08814.1998. [DOI] [PMC free article] [PubMed] [Google Scholar]
- Weston MC, Nehring RB, Wojcik SM, Rosenmund C. Interplay between VGLUT isoforms and endophilin A1 regulates neurotransmitter release and short-term plasticity. Neuron. 2011;69:1147–1159. doi: 10.1016/j.neuron.2011.02.002. [DOI] [PubMed] [Google Scholar]
- Winpenny E, Lebel-Potter M, Fernandez ME, Brill MS, Götz M, Guillemot F, Raineteau O. Sequential generation of olfactory bulb glutamatergic neurons by Neurog2-expressing precursor cells. Neural Dev. 2011;6:12. doi: 10.1186/1749-8104-6-12. [DOI] [PMC free article] [PubMed] [Google Scholar]
- Yokoi M, Mori K, Nakanishi S. Refinement of odor molecule tuning by dendrodendritic synaptic inhibition in the olfactory bulb. Proc Natl Acad Sci U S A. 1995;92:3371–3375. doi: 10.1073/pnas.92.8.3371. [DOI] [PMC free article] [PubMed] [Google Scholar]
- Yoshihara S, Omichi K, Yanazawa M, Kitamura K, Yoshihara Y. Arx homeobox gene is essential for development of mouse olfactory system. Development. 2005;132:751–762. doi: 10.1242/dev.01619. [DOI] [PubMed] [Google Scholar]
- Yoshihara S, Takahashi H, Nishimura N, Naritsuka H, Shirao T, Hirai H, Yoshihara Y, Mori K, Stern PL, Tsuboi A. 5T4 glycoprotein regulates the sensory input-dependent development of a specific subtype of newborn interneurons in the mouse olfactory bulb. J Neurosci. 2012;32:2217–2226. doi: 10.1523/JNEUROSCI.5907-11.2012. [DOI] [PMC free article] [PubMed] [Google Scholar]
- Yoshihara Y, Oka S, Watanabe Y, Mori K. Developmentally and spatially regulated expression of HNK-1 carbohydrate antigen on a novel phosphatidylinositol-anchored glycoprotein in rat brain. J Cell Biol. 1991;115:731–744. doi: 10.1083/jcb.115.3.731. [DOI] [PMC free article] [PubMed] [Google Scholar]
- Yoshihara Y, Kawasaki M, Tamada A, Fujita H, Hayashi H, Kagamiyama H, Mori K. OCAM: A new member of the neural cell adhesion molecule family related to zone-to-zone projection of olfactory and vomeronasal axons. J Neurosci. 1997;17:5830–5842. doi: 10.1523/JNEUROSCI.17-15-05830.1997. [DOI] [PMC free article] [PubMed] [Google Scholar]