Abstract
Background
Iron overload is associated with increased severity of nonalcoholic fatty liver disease (NAFLD) including progression to nonalcoholic steatohepatitis and hepatocellular carcinoma.
Aims
To identify potential role(s) of iron in NAFLD, we measured its effects on pathways of oxidative stress and insulin signaling in AML-12 mouse hepatocytes.
Methods
Rapid iron overload was induced with 50 μM ferric ammonium citrate and 8-hydroxyquinoline. Insulin response was measured by western blot of phospho-protein kinase B. Lipid content was determined by staining with oil red O. Reactive oxygen species (ROS) were measured by flow cytometry using 5-( -6)-chloromethyl-2′,7′-dichlorodihydrofluorescein diacetate. Oxidative stress was measured by western blots for phospho-jnk and phospho-p38.
Results
Iron increased ROS (p<0.001) and oxidative stress (p<0.001), and decreased insulin signaling by 33% (p<0.001). Treatment with stearic or oleic acids (200 μM) increased cellular lipid content and differentially modulated effects of iron. Stearic acid potentiated iron-induced ROS levels by 2-fold (p<0.05) and further decreased insulin response 59% (p<0.05) vs. iron alone. In contrast, cells treated with oleic acid were protected against iron-mediated injury; ROS levels were decreased by half (p<0.01) vs. iron alone while insulin response was restored to control (untreated) levels. The anti-oxidant curcumin reduced effects of iron on insulin signaling, ROS, and oxidative stress (p<0.01). Curcumin was similarly effective in cells treated with both stearic acid and iron.
Conclusions
An in-vitro model of NAFLD progression is described in which iron-induced oxidative stress inhibits insulin signaling. Pathophysiological effects of iron were increased by saturated fat and decreased by curcumin.
Keywords: Liver, hemochromatosis, fatty acids, nonalcoholic fatty liver disease
Introduction
Insulin resistance (IR) and triglyceride accumulation in the liver (steatosis) are hallmarks of nonalcoholic fatty liver disease (NAFLD), a potentially serious condition that affects more than 20% of the US population [1,2]. A fraction of NAFLD patients develop nonalcoholic steatohepatitis (NASH), the advanced and progressive form of the disease that can result in cirrhosis and liver failure or hepatocellular carcinoma. In addition to elevated serum lipids, especially saturated fat [3], NASH is associated with elevated levels of inflammatory cytokines or other sources of oxidative stress. These contribute to characteristics of hepatotoxicity, fibrosis, and necroinflammation that define the disease [4].
Steatosis is a diagnostic feature of NAFLD but is not by itself a good predictor of progression to NASH. In NAFLD, steatosis primarily reflects increased fatty acid uptake by the liver, a consequence of the elevated serum fatty acids caused partly by IR in adipose tissue [5]. Progression to NASH may also require hepatic IR, which decreases the liver’s ability to dispose of the excess fat and initiates a degenerative cycle in which elevated fatty acids (or their metabolites) further contribute to hepatic IR [6]. Elevated hepatic levels of reactive oxygen species (ROS) are likely important, since ROS-induced oxidative stress is a known cause of IR in muscle and fat [7,8]. Since storing rather than metabolizing excess fat minimizes oxidative stress and the resulting liver damage, steatosis is best thought of as a protective pathway in hepatocytes rather than a pathological process [9]. In contrast, coupled increases in oxidative stress and hepatic insulin resistance appear to be useful predictors of NAFLD progression to NASH [4,6].
Excess body iron can increase oxidative stress in the liver and favor progression of NAFLD to NASH. As a redox-active transition metal, free iron can catalyze the production of ROS through Fenton chemistry [10,11]. Increased oxidative stress in experimental animals and iron overloaded patients has been well documented [12,13]. Increased severity of NAFLD has been reported among patients with iron overload from hereditary hemochromatosis [14,15], and higher body iron was associated with increased severity of NASH [16] and progression to hepatocellular carcinoma [17]. Importantly, iron depletion through phlebotomy was shown to reduce NAFLD progression [13]. These observations support the idea that iron-induced oxidative stress contributes directly to hepatic IR and NASH, but this remains to be experimentally demonstrated.
The present study investigated NASH-related effects of iron overload in AML-12 mouse hepatocytes. As IR accompanies NAFLD progression, we used the insulin response of the cells as a surrogate endpoint. The primary goal was to evaluate the premise that iron overload decreases insulin signaling via an oxidative stress based mechanism. A secondary goal was to determine whether the extent of iron-related injury was altered by elevated fatty acids, as might occur in the iron overloaded NAFLD patient.
Methods
Materials
Free fatty acids (FFA), ferric ammonium citrate (FAC), fatty acid-free bovine serum albumin (BSA), and 8-hydroxyquinoline (8HQ) were obtained from Sigma/Aldrich (St. Louis, MO). Fetal calf serum was from Atlanta Biologicals (Norcross GA). Other cell culture reagents were from GIBCO/Invitrogen (Carlsbad CA). The fluorescent probe 5-(and-6)-chloromethyl 2′,7′ dichlorodihydrofluorescein diacetate (CM-H2DCFDA) was from Molecular Probes/Invitrogen (Eugene OR). C3 complex®, a defined mixture of curcumin (diferuloylmethane), demethoxycurcumin and bisdemethoxycurcumin, was donated by Sabinsa Corp (Piscataway NJ). Antibodies and other specialty reagents were from commercial sources as noted.
Cell culture and cell-based assays
AML-12 cells, a non-neoplastic tgf-α overexpressing mouse cell line, were obtained directly from the originating Fausto laboratory [18]. In general, experiments used subconfluent cells at passage 30 or lower (passage designations of Wu et al. [18]), corresponding to a total time in culture of approximately 9 months (3 months in our hands). They were maintained in DMEM/F12 media supplemented with 10% fetal calf serum, 10 μg/ml insulin, 5 μg/ml transferrin, 7 ng/ml selenium (corresponding to a 1:100 dilution of ITS, GIBCO Corp.), 2mM l-glutamine, 50 μg/ml gentamicin, and 100 nM dexamethasone (growth media), at 37°C in a 5% CO2 atmosphere. Albumin gene expression determined by quantitative PCR [19] confirmed their hepatocyte phenotype (DJM, unpublished). Calcein quenching experiments similar to those reported previously [20] indicated 8-hydroxyquinoline-mediated iron entry was maximal by 15 minutes (the earliest time examined) in AML-12 cells (DJM). Treatment with FFA and iron was performed after switching the cells from growth media to DMEM containing 1000mg/ml glucose, 10% fetal calf serum, 2 mM l-glutamine, 50 μg/ml gentamicin, and 100 nM dexamethasone (treatment media).
FFA were delivered from concentrated 50mM stocks prepared in isopropanol as described by Gores and coworkers [21]. Controls contained the same concentration of vehicle as the experimental cultures (i.e. 0.4% isopropanol was used as control for 200μM FFA). An alternative delivery protocol using de-lipidized BSA as FFA carrier [22] was rejected due to the inhibitory effect of lipid-free BSA on cellular fat content and uptake of iron (DJM, unpublished). All treatments included 10% fetal calf serum. The content of neutral lipid in the cells was measured by staining with oil red O, using a protocol similar to that described by Ramirez-Zacarias et al. [23]. Briefly, cells plated on coverslips were rinsed in PBS, fixed in 3.7% paraformaldehyde, rinsed in PBS, and stained with 0.3% oil red O in 60% isopropanol for 10 minutes. The coverslips were rinsed with water, mounted on slides, and photographed with a Leica DM2500 microscope equipped with a CCD camera and SPOT 4.6 software (Diagnostic Instruments, Sterling Heights MI). Six random fields of each were analyzed for red (lipid) staining using image J software and accompanying protocol for quantifying stained liver tissue liver (NIH, Bethesda MD), with threshold set at 80%.
ROS levels were measured by flow cytometry. Following FFA treatment (3 days at 200 μM), cells were rinsed in Hanks balanced salt solution (HBSS) and loaded with 2 μg/ml 5-( -6)-chloromethyl-2′,7′-dichlorodihydrofluorescein diacetate (CM-H2DCFDA) (Molecular Probes, Eugene OR) in the absence of serum for 30 minutes at 37°C. The cells were rinsed and treated for two hours in complete treatment media +/− 50 μM FAC/20 μM 8-hydroxyquinoline and FFA. The DCF (green) fluorescence in propidium iodide negative cells was quantified in a Cytomics FC500 flow cytometer (Beckman Coulter, Indianapolis IN) after subtracting background fluorescence of control cells not loaded with CM-H2DCFDA. Cell growth/viability was determined using methylthiazolyldiphenyl-tetrazolium bromide (mtt assay) as described [20].
C3 complex® (curcumin) was evaluated and stored in accordance with all requirements and recommendations of the Product Integrity Working Group of the National Advisory Council for Complementary and Alternative Medicine, a primary sponsor of this study. Where indicated, C3 complex® was added at the same time as 8-hydroxyquinoline and iron from a 50 mM stock prepared in dimethylformamide. The curcuminoid concentrations in these stock solutions were stable at −20 °C for more than 1 year (DJM unpublished). Control cultures contained an equal amount of dimethylformamide and/or other solvents.
Biochemical measurements
For insulin signaling and oxidative stress assays, cells were treated as for the ROS assays (i.e. three days +/− FFA and two hours +/− 50 μM FAC/20 μM 8-hydroxyquinoline and FFA as indicated in fresh treatment media), followed by 10 minutes +/− 10 nM insulin at 37°C. After rinsing with ice cold PBS, equal protein aliquots of total cell lysates were analyzed by western blot analyses as described previously [24]. The magnitude of the insulin response was calculated as the difference in phospho-protein kinase B signal +/− insulin. Antibodies to protein kinase B phosphorylated at ser473 (phospho-PKB), to c-jun N-terminal kinase (jnk) dually phosphorylated at thr183/tyr185 (phospho-jnk), and to p38 MAP kinase (p38) dually phosphorylated at thr180/tyr182 (phospho-p38) were from Cell Signaling Technologies, Inc. (Danvers, MA). Antibodies to glyceraldehyde 3-phosphate dehydrogenase (GAPDH) were from Santa Cruz Biotechnology (Santa Cruz CA). Secondary antibodies linked to horseradish peroxidase were from Jackson Immunoresearch (West Grove PA). Detection utilized the ECL-plus system from Amersham/GE Healthcare (Arlington Heights IL). The chemiluminescence signals were quantified using either a Kodak MM4000 gel imager (Rochester NY) or a UVP gel imager (Upland CA) equipped with a Hamamatsu CCD camera (Bridgewater NJ). Alternatively, western blot data were quantified using the Odyssey infrared imaging system from Li-Cor, Inc (Lincoln, NE). All western blot signals were quantified relative to the housekeeping protein GAPDH in the same sample and normalized to control or iron only cells analyzed on the same blot as indicated in the corresponding figure legend. Lipid peroxidation was measured by thiobarbituric reactive substances (TBARS) assay from Cayman Chemical (Ann Arbor, MI).
Statistics
To determine the significance of differences between groups, the data were evaluated using a 2 tailed unpaired t-test for samples with unequal variance, and significance noted at p<0.05 (*), p<0.01 (**), and p<0.001 (***). Normalized values (expressed relative to either untreated cells, insulin only cells, or iron only cells as specified) were used to compile and evaluate data from different experiments. A paired t-test was used when testing significance relative to the normalizing group itself.
Results
Iron overload causes insulin resistance in AML-12 hepatocytes
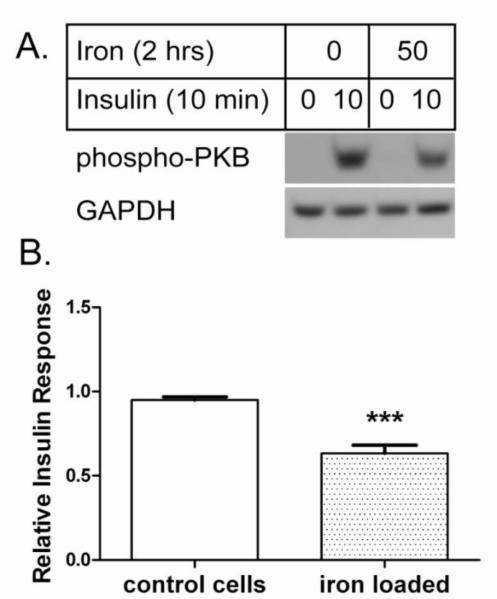
AML-12 is a mouse cell line that displays morphological and gene expression patterns (albumin, transferrin, and connexin 32) characteristic of differentiated hepatocytes [18]. These cells may be used to investigate selected NAFLD-related processes, including hepatic steatosis and IR. To determine effects of iron overload on insulin response, we monitored insulin-stimulated phospho-activation of PKB. Control AML-12 cells displayed an EC50 near 1 nM insulin and a maximal response at 10-100 nM (unpublished data). Iron overload was induced with ferric ammonium citrate (FAC) and the lipophilic iron chelator 8-hydroxyquinoline (8HQ). Ferric ammonium citrate is a relatively stable formulation of ferric citrate, a species of free iron found in blood that increases in hereditary hemochromatosis and other conditions of iron overload [25,26]. 8HQ facilitates rapid (within minutes) entry of iron into cells so as to transiently overload cellular defenses against free iron [20]. The short time course (2 hours or less) emphasizes the protein-level effects of iron overload and largely removes potential transcriptional and translational effects from the analysis. As shown in Figure 1, this iron overload protocol decreased cellular response to 10 nM insulin by approximately 33% (p<0.001).
Figure 1. Iron overload decreases hepatocyte insulin response. A. Representative western blot.
Control (8-hydroxyquinoline only) and iron loaded (50 μM iron with 8-hydroxyquinoline) AML-12 cells were stimulated with 10 nM insulin and analyzed by western blot for phospho-PKB. GAPDH was analyzed as loading control. B. Relative insulin response. The insulin-stimulated phospho-PKB signals from n=18 experiments were quantified relative to GAPDH as described under Methods and normalized to control cells in each experiment; the means +/− se are plotted (*** p<0.001).
Free fatty acids differentially modulate iron-induced IR
NAFLD is defined by accumulation of fat in hepatocytes, caused (in obese individuals) primarily by increased uptake of serum FFA [1,2]. Treatment of AML-12 cells with 200 μM FFA led to a similar accumulation of intracellular triglycerides as assessed by staining with oil red O (Figure 2A). Fat content was greater in cells treated with oleic acid than stearic acid (Figure 2B). As in the NAFLD liver, steatosis in AML-12 cells likely reflects clearance and detoxification of FFA [9].
Figure 2. Triglycerides accumulate in hepatocytes treated with free fatty acids.

Cells loaded with vehicle only (control), 200 μM stearic acid, or 200 μM oleic acid were stained with Oil Red O as described under Methods. A. Representative micrographs. Each field contains approximately 300 cells treated for 24 hours (400x). B. Time course of lipid accumulation. After staining, the % cell area occupied by lipid vacuoles was quantified by photodensitometric analyses of six fields per condition. Data represent the means +/− se of n=3 experiments.
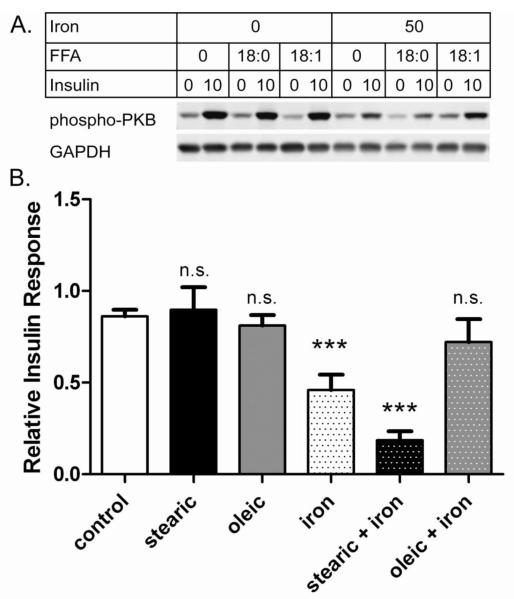
In addition to steatosis, NAFLD is marked by persistently elevated serum FFA [1,2]. To create similar conditions in cell culture we treated with FFA for 3 days to induce steatosis and again for 2 hours to ensure high FFA levels in the media. Under these conditions, there were little or no effects of either stearic or oleic acids alone on the sensitivity of the cells to 10 nM insulin (Figure 3). However, these FFAs did impact effects of iron overload. Stearic acid compounded iron-induced IR: insulin response was further decreased from 53% (iron only) to 33% (stearic acid + iron) (p<0.05). This compounding effect of stearic acid was smaller in magnitude if stearic acid was not re-added with iron at the 2 hour time point (data not shown). In contrast, oleic acid was protective: cells treated with oleic acid and iron appeared unchanged from control (Figure 3B). The differential effects of saturated vs. monounsaturated fatty acids are clearly illustrated by the observation that cells given oleic acid + iron had an insulin response nearly 4-fold higher than those given stearic acid + iron (p<0.01) (Figure 3B).
Figure 3. Fatty acids differentially modulate iron-induced insulin resistance.
Cells were treated as indicated for 3 days +/− 200 μM fatty acid (either stearic acid, 18:0 or oleic acid, 18:1), followed by 2 hours +/− 200 μM fatty acid +/− 50 μM iron + 8-hydroxyquinoline before being tested +/− 10 nM insulin. A. Representative western blots. Samples from a single experiment were analyzed by western blot for phospho-PKB and GAPDH. B. Insulin Response. The relative insulin effect (defined as the difference in normalized phospho-PKB signal +/− insulin) was determined from western blots as shown in A. Results were compiled from ten independent experiments that included cells treated with 8-hydroxyquinoline only (control, n=10) or also with stearic acid (n=4), oleic acid (n=4), iron (n=10), stearic + iron (n=7), and oleic + iron (n=7). Means +/− se are shown (*** p<0.001 vs. control; n.s. not significant).
Oxidative stress mediates iron-induced IR
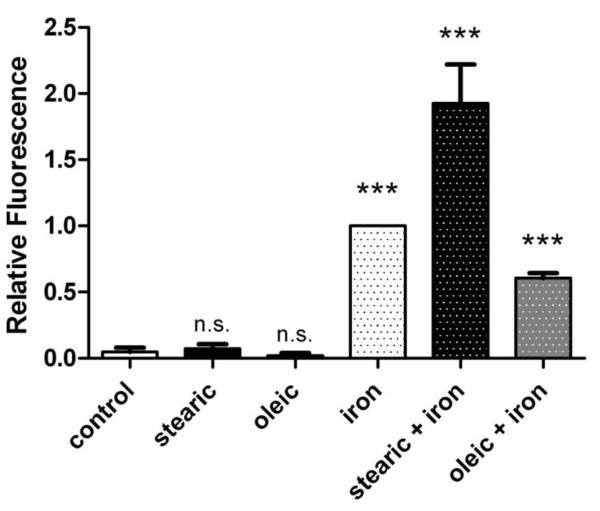
Oxidative stress is a known cause of IR in other cell and tissue types [7,8]. To determine whether this might contribute to decreased insulin response in iron overloaded hepatocytes, we used the redox-sensitive fluorescent probe CM-H2DCFDA as an indicator of ROS in cells. In the presence of iron, this probe detects a wide variety of ROS, including superoxide, hydrogen peroxide, and hydroxyl radicals [27]. We found conditions that caused IR (Figure 3) also increased ROS levels (Figure 4). There were significantly higher levels of ROS in iron overloaded cells compared to control (p<0.001). As was seen for insulin signaling (Figure 3), stearic acid and oleic acid had little or no effect individually on ROS levels, but they differentially modulated effects of iron. Compared to cells subjected to iron overload alone, ROS levels were 2-fold higher in cells treated with stearic acid and iron (p<0.05), and approximately half in cells treated with oleic acid and iron (p<0.001). Direct comparison of the two different fatty acid treatments revealed that cells given stearic acid and iron had ROS levels more than 3-fold higher than cells given oleic acid and iron (p<0.001). As it seems unlikely that the fluorescent probe is preferentially retained in cells treated with stearic acid compared to oleic acid, these data support a ROS-based mechanism for iron induced IR in AML-12 hepatocytes.
Figure 4. Fatty acids differentially modulate iron-induced ROS levels.
Cells were treated for 3 days (+/− 200 μM fatty acid), pulsed for 30 minutes with CM-H2DCFDA, treated for 2 hours (+/− 200 μM fatty acid +/− 50 μM iron + 8-hydroxyquinoline), and analyzed by flow cytometry. The dichlorofluorescein (DCF) fluorescence values from propridium iodide negative (viable) cells were determined in n=10 independent experiments and normalized to cells treated with iron + 8-hydroxyquinoline. Means +/− se are shown (*** p<0.001 vs. control; n.s. not significant).
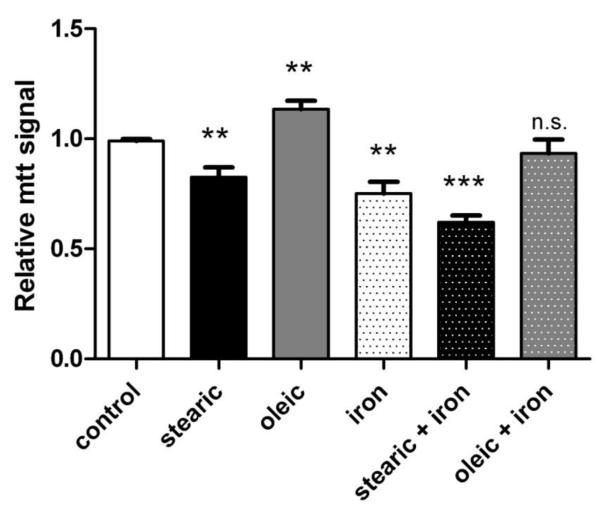
Effects of these treatment protocols on cell growth/viability are shown in Figure 5. Stearic acid alone decreased cell growth by 16% (p<0.01) while oleic acid increased cell growth by 15% (p<0.01). Iron alone decreased cell viability by 24% (p<0.01), whereas stearic acid + iron decreased cell viability by 37% (p<0.001). The growth/viability of cells given oleic acid and iron was unchanged from control cells. In general, iron treatment protocols that dramatically increased ROS levels (Figure 4) and decreased insulin sensitivity (Figure 3) caused parallel but smaller changes in cell growth/viability (Figure 5).
Figure 5. Effects of fatty acids and iron overload on cell viability.
Cells were treated as indicated for 3 days +/− 200 μM fatty acid followed by 2 hours +/− 200 μM fatty acid +/− 50 μM iron + 8-hydroxyquinoline. Cell number and viability were determined by mtt assay relative to untreated cells. Means +/− se from n=5 independent experiments are shown (*** p<0.001 vs. control; ** p<0.01; n.s. not significant).
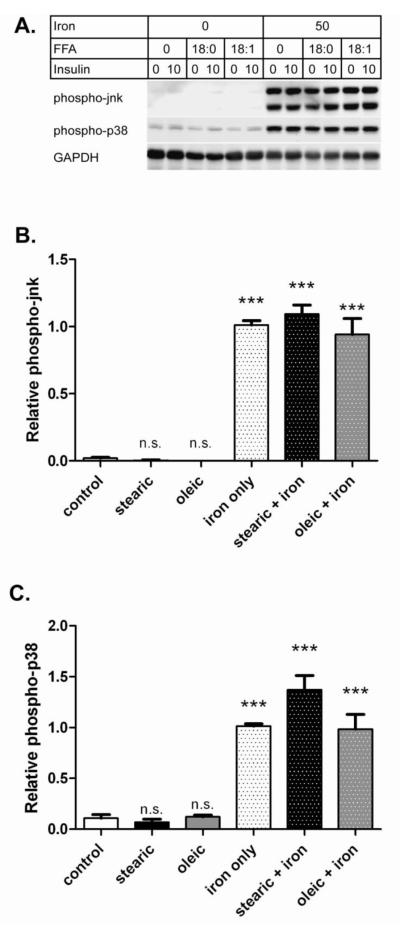
Multiple signaling pathways have been implicated in oxidative stress-induced IR including the stress kinases jnk and p38 [7,28]. Figure 6 illustrates effects of FFA and iron on these enzymes in AML-12 cells. Both pathways were activated in iron overloaded cells (p<0.001) but not by FFA alone, similar to what we found by measuring ROS levels. However, the extent of jnk and p38 activation by iron was only weakly modulated by FFA. For phospho-jnk, stearic acid increased the iron effect by 8% (not significant (ns)), while oleic acid reduced the iron effect by 7% (ns) (Figure 6B). For phospho-p38, stearic acid increased the iron effect by 36% (p<0.01), while oleic acid reduced the iron effect by 3% (ns) (Figure 6C). Activation of these signaling pathways is further support of an oxidative stress based mechanism of iron-induced IR in AML-12 hepatocytes.
Figure 6. Iron overload activates redox-sensitive signaling pathways.
Cells were treated for 3 days (+/− 200 μM fatty acid) followed by 2 hours (+/− 200 μM fatty acid +/− 50 μM iron + 8-hydroxyquinoline) and analyzed by western blot. A. Representativev western blots. Samples from a single experiment were analyzed for phospho-jnk, phospho-p38, and GAPDH. B. Relative phospho-jnk. The means +/− se compiled from ten experiments (as for Figure 3) are shown for phospho-jnk after normalizing to the iron only samples. C. Relative phospho-p38. Results for phospho-p38 are shown as for panel B. (*** p<0.001 vs. control; n.s. not significant).
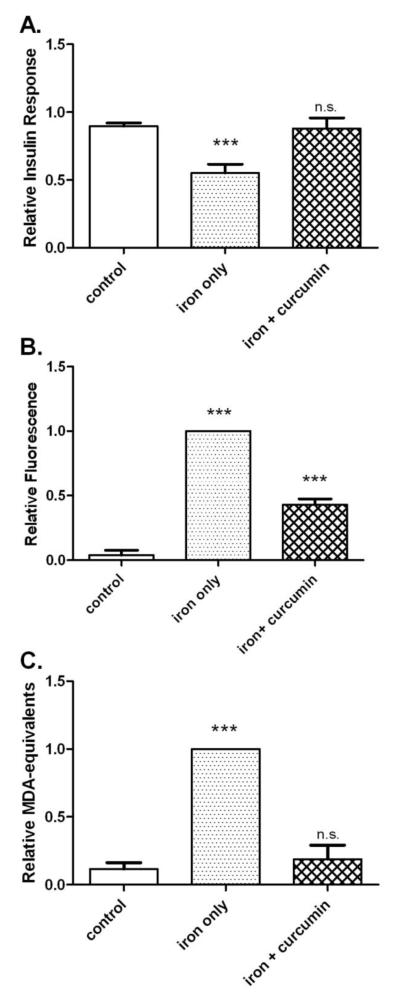
To further examine the link between iron-induced ROS and insulin resistance, we tested whether anti-oxidant treatment could block effects of iron overload. Figure 7 illustrates the preventive effects of the potent anti-oxidant curcumin (C3 complex®) on iron-induced IR and oxidative stress. Insulin response increased from 61% of control in iron overloaded cells to 98% of control in cells also given C3 complex® (p<0.01). This corresponded to a 59% improvement in insulin response (Figure 7A). Under similar conditions curcumin decreased iron-induced ROS levels by 57% (p<0.001) (Figure 7B) and lipid peroxidation in iron overloaded cells was decreased 81% (p<0.01) (Figure 7C).
Figure 7. Curcumin prevents insulin resistance and oxidative stress caused by iron overload.
Cells were treated for 2 hours as indicated (+/− 50 μM iron, + 8-hydroxyquinoline, +/− 50 μM C3 complex® curcumin). A. Insulin response. The relative insulin response (the difference in normalized phospho-PKB signal +/− 10 nM insulin) was determined by western blot. The means +/− se from n=15 experiments are shown. B. ROS levels. ROS was measured by flow cytometry using CM-H2DCFDA and normalized to the iron only samples. The means +/− se of n=10 experiments are shown. C. Lipid peroxidation. Lipid peroxidation was measured in malondialdehyde (MDA) – equivalents by TBARS assay and the values were normalized to iron only samples. The means +/− se of n=4 experiments are shown. (*** p<0.001 vs. control; n.s. not significant).
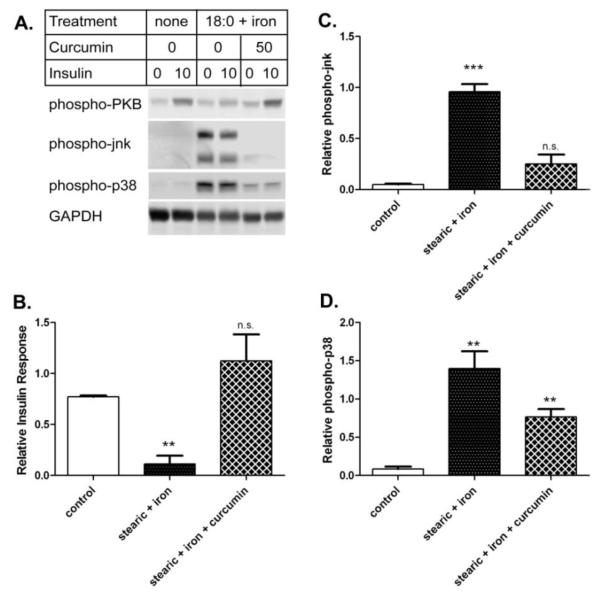
The effects of curcumin on insulin response and stress kinase activation in cells treated with both stearic acid and iron are shown in Figure 8. While stearic acid and iron decreased insulin response by 85% from control cells (p<0.01), this was largely prevented by including curcumin with the iron treatment. The insulin response in cells given stearic acid, iron, and curcumin was comparable to that seen in the control cells (Figure 8B). Similarly, curcumin decreased phospho-activation of jnk caused by stearic acid and iron by 74% (p<0.01) to levels comparable to the control (Figure 8C). Finally, curcumin decreased phospho-activation of p38 caused by stearic acid and iron by 45% (p=0.064) (Figure 8D).
Figure 8. Curcumin prevents iron-induced insulin resistance and oxidative stress in cells treated with stearic acid.
Cells were treated for 3 days (+/− 200 μM stearic acid, 18:0) followed by 2 hours (+/− 200 μM stearic acid and 50 μM iron, +/− 50 μM 50 μM C3 complex® curcumin + 8-hydroxyquinoline) and tested +/− 10 nM insulin. A. Representative western blots. Samples from a single experiment were analyzed for phospho-PKB, phospho-jnk, phospho-p38, and GAPDH. B. Insulin response. The relative insulin response was determined by phospho-PKB western blot. The means +/− se from n=3 experiments are shown after normalizing to control cells. C. Relative phospho-jnk. The means +/− se from n=3 experiments (as for panel B) are shown for phospho-jnk after normalizing to the iron only samples. D. Relative phospho-p38. Results for phospho-p38 are shown as for panel C. (*** p<0.001 vs. control; ** p<0.01; n.s. not significant).
Discussion
This study demonstrated that acute iron overload causes oxidative stress and impairs insulin signaling in AML12 hepatocytes. The strongest effects of iron were seen in cells exposed to the saturated fatty acid stearic acid, but not the mono-unsaturated fatty acid oleic acid. The anti-oxidant curcumin partially prevented these effects of iron. Although oxidative stress is a recognized consequence of iron overload in vitro and in vivo, this is the first demonstration of diminished insulin response in cells treated with iron. Furthermore, these findings extend previous reports of IR caused by high doses of FFA by demonstrating a synergistic effect with iron. Establishing these basic principles in a cultured cell model is an important step towards understanding and minimizing the contributions of iron to NAFLD in humans.
Although most body iron stores are inertly sequestered in transferrin or ferritin, there is a significant pool of “free” iron capable of generating potentially toxic ROS through the Fenton and Haber-Weiss reactions [10,11]. At low levels, ROS are well-tolerated by most cells and induce a range of protective responses important to cell growth, differentiation, and survival [29]. At high levels, ROS can damage cells directly or deplete cellular energy stores via oxidative stress [13,30]. Despite sophisticated mechanisms for maintaining iron homeostasis [31], free iron levels may increase significantly in hemochromatosis and other conditions of iron overload [25,26]. Consequences of severe iron overload include hepatocellular injury, cirrhosis and hepatocellular carcinoma.
Hepatic iron overload in humans, even in patients with hereditary hemochromatosis, is highly variable and subject to many factors. It may take many years to develop, making it difficult to define how it contributes to liver disease. Similarly, iron-induced liver damage is difficult to induce in animal models. With these points in mind, we chose to first identify potential hepatic effects of iron using the AML-12 cell model and 8HQ to induce iron overload. This delivery protocol rapidly overloads cellular defenses and allows the immediate effects of free iron to be investigated [20]. An analogous approach over several decades has used the ionophore A23187 to elucidate effects and cellular targets of calcium action in cells [32]. The 8HQ iron overload protocol provided a clear model with which to study iron dependent ROS induction, oxidative stress, and IR.
Others have shown that FFA alone can increase oxidative stress and cause IR [33]. In general, reported pathological effects of saturated fatty acids (e.g. palmitic or stearic) are greater than monounsaturated fatty acids (e.g. oleic) [21,34]. This may be due partly to lipotoxic effects that are magnified by the serum-free conditions generally used in these experiments. In the presence of serum and without iron overload, we saw little or no FFA-induced ROS, oxidative stress, or IR, only mild steatosis. By these criteria our treatment protocol of low levels of FFA without iron recapitulates hepatocyte conditions observed in early stage human NAFLD.
In contrast, combining iron overload with stearic acid treatment significantly increased ROS, oxidative stress, and IR and so best recapitulates hepatocyte conditions observed at more advanced NAFLD. The potentiation of iron-induced IR by stearic acid appeared unrelated to steatosis, which was higher in cells given oleic acid. Thus although the mechanism of the stearic acid effect in AML 12 cells is unknown, it may be concluded that steatosis per se does not cause insulin resistance in AML-12 cells. The stearic acid effect is consistent with earlier reports that NAFLD severity varies with the fat composition of the diet [3]. It is likely that similar differences (in either lipidomic profiles or dietary fat composition) may influence effects of iron overload in humans, and may partly explain the somewhat mixed results of clinical studies. Hemochromatosis gene mutations have been either associated with increased severity [14,15,35,36] or found to be unrelated [37,38] to NASH. Stainable liver iron or serum transferrin were associated with NASH severity in some [16,35,39] but not all [37,40,41] studies. The hepatic cell model described here will be useful for elucidating mechanistic interactions between fat and iron that may favor NAFLD progression to NASH.
Our demonstration that iron overload can cause insulin resistance supports the increasingly common view that it is a contributing factor in diabetes as well as NAFLD [42]. This effect is generally ascribed to an increase in oxidative stress, although specific downstream mechanisms leading to disease progression are not well defined. It is possible that iron may influence glycemic control by other mechanisms. In one study, depletion of iron from HepG2 cells with desferoxamine under normal (not iron overloaded) culture conditions improved insulin signaling via increased hypoxia signaling [43]. This and other non-oxidative stress based mechanisms may explain why iron depletion by phlebotomy may benefit diabetic patients with normal body iron [44].
In AML-12 cells, iron overload caused phospho-activation of jnk and p38. These ser/thr kinases are known mediators of IR in other settings [7]. They act in part through negative phospho-regulation of IRS proteins [45]. It is worth noting that we saw relatively modest modulation of iron-induced jnk or p38 activation by FFA. In particular, these kinases remained strongly activated in cells treated with oleic acid and iron, conditions that had little effect on insulin response. This suggests that oleic acid is not disrupting the iron overload process itself, but rather that additional lipid-sensitive pathways must influence insulin signaling in iron overloaded hepatocytes. Further work is needed to elucidate the complete mechanism(s) by which iron-induced oxidative stress impairs insulin signaling.
A limitation of our study is that although AML-12 cells are a useful hepatocyte model, NAFLD is a complex disease that involves other cell types. Accumulation of iron in liver macrophages (Kupffer cells) may stimulate secretion of inflammatory cytokines that increase ROS and induce IR in hepatocytes [16]. Additionally, hepatocyte death induced by severe iron overload triggers Kupffer and stellate cells to secrete inflammatory cytokines and fibrogenic factors that favor NAFLD progression to NASH [1,5]. Despite these complexities, hepatocyte iron overload remains a relevant and important area of NASH research that may be dissected using the cell model described here.
We observed significant preventive effects of the antioxidant curcumin in iron-overloaded AML-12 cells. This contrasts with a general lack of efficacy of other anti-oxidants for prevention of NAFLD progression in clinical studies [9]. While our results suggest that lowering high ROS and preventing oxidative stress may be beneficial, the earlier results argue against a ROS-based mechanism for NAFLD progression to NASH. Perhaps this is because lower levels of ROS are less pathological and may even protect the liver through induction of anti-oxidant defense mechanisms [7], making the benefits of chronic antioxidant use equivocal. Alternatively, it may be critical to match the particular antioxidant to the source and type of ROS being generated. We showed previously that curcumin may be particularly effective against iron-induced oxidative stress [20]. The present findings, together with promising results in mouse models of NASH [46-48], justify further in vitro and in vivo studies of curcumin for the prevention of iron-related pathophysiology in nonalcoholic fatty liver disease.
Acknowledgements
We thank Drs. Jean Campbell and Nelson Fausto, the University of Washington, for their gift of AML12 cells. We thank Daniel Godbout, Bastyr University, for estimates of the concentration dependence of insulin signaling in AML-12 cells. We thank Dr. Muhammed Majeed and colleagues at Sabinsa Corporation for generously providing the C3 complex® used in this study. A preliminary version of this manuscript has appeared in abstract form (Messner et al. FASEB J March 29, 2012 26:758.1).
Grant support: Supported by NIH grants from the Institute of Diabetes and Digestive and Kidney Diseases (K24 DK02957 to KVK) and the National Center for Complementary and Alternative Medicine (K01 AT3448 to DJM).
Abbreviations
- NAFLD
nonalcoholic fatty liver disease
- NASH
nonalcoholic steatohepatitis
- FFA
free fatty acids
- FAC
Ferric ammonium citrate
- 8HQ
8-hydroxyquinoline
- CM-H2DCFDA
5-(and-6)-chloromethyl 2′,7′ dichlorodihydrofluorescein diacetate
- ROS
reactive oxygen species
Footnotes
Disclosures: none
References
- 1.Marra F, Gastaldelli A, Svegliati Baroni G, Tell G, Tiribelli C. Molecular basis and mechanisms of progression of non-alcoholic steatohepatitis. Trends Mol Med. 2008;14:72–81. doi: 10.1016/j.molmed.2007.12.003. [DOI] [PubMed] [Google Scholar]
- 2.Preiss D, Sattar N. Non-alcoholic fatty liver disease: An overview of prevalence, diagnosis, pathogenesis and treatment considerations. Clin Sci (Lond) 2008;115:141–150. doi: 10.1042/CS20070402. [DOI] [PubMed] [Google Scholar]
- 3.Yki-Jarvinen H. Nutritional modulation of nonalcoholic fatty liver disease and insulin resistance: Human data. Curr Opin Clin Nutr Metab Care. 2010;13:709–714. doi: 10.1097/MCO.0b013e32833f4b34. [DOI] [PubMed] [Google Scholar]
- 4.Sanyal AJ. Mechanisms of disease: Pathogenesis of nonalcoholic fatty liver disease. Nat Clin Pract Gastroenterol Hepatol. 2005;2:46–53. doi: 10.1038/ncpgasthep0084. [DOI] [PubMed] [Google Scholar]
- 5.Browning JD, Horton JD. Molecular mediators of hepatic steatosis and liver injury. J Clin Invest. 2004;114:147–152. doi: 10.1172/JCI22422. [DOI] [PMC free article] [PubMed] [Google Scholar]
- 6.Videla LA, Rodrigo R, Araya J, Poniachik J. Insulin resistance and oxidative stress interdependency in non-alcoholic fatty liver disease. Trends Mol Med. 2006;12:555–558. doi: 10.1016/j.molmed.2006.10.001. [DOI] [PubMed] [Google Scholar]
- 7.Evans JL, Maddux BA, Goldfine ID. The molecular basis for oxidative stress-induced insulin resistance. Antioxid Redox Signal. 2005;7:1040–1052. doi: 10.1089/ars.2005.7.1040. [DOI] [PubMed] [Google Scholar]
- 8.Houstis N, Rosen ED, Lander ES. Reactive oxygen species have a causal role in multiple forms of insulin resistance. Nature. 2006;440:944–948. doi: 10.1038/nature04634. [DOI] [PubMed] [Google Scholar]
- 9.Neuschwander-Tetri BA. Hepatic lipotoxicity and the pathogenesis of nonalcoholic steatohepatitis: The central role of nontriglyceride fatty acid metabolites. Hepatology. 2010;52:774–788. doi: 10.1002/hep.23719. [DOI] [PubMed] [Google Scholar]
- 10.Kehrer JP. The haber-weiss reaction and mechanisms of toxicity. Toxicology. 2000;149:43–50. doi: 10.1016/s0300-483x(00)00231-6. [DOI] [PubMed] [Google Scholar]
- 11.Galaris D, Pantopoulos K. Oxidative stress and iron homeostasis: Mechanistic and health aspects. Crit Rev Clin Lab Sci. 2008;45:1–23. doi: 10.1080/10408360701713104. [DOI] [PubMed] [Google Scholar]
- 12.Brown KE, Dennery PA, Ridnour LA, Fimmel CJ, Kladney RD, Brunt EM, Spitz DR. Effect of iron overload and dietary fat on indices of oxidative stress and hepatic fibrogenesis in rats. Liver Int. 2003;23:232–242. doi: 10.1034/j.1600-0676.2003.00832.x. [DOI] [PubMed] [Google Scholar]
- 13.Sumida Y, Yoshikawa T, Okanoue T. Role of hepatic iron in non-alcoholic steatohepatitis. Hepatol Res. 2009;39:213–222. doi: 10.1111/j.1872-034X.2008.00442.x. [DOI] [PubMed] [Google Scholar]
- 14.Bonkovsky HL, Jawaid Q, Tortorelli K, LeClair P, Cobb J, Lambrecht RW, Banner BF. Non-alcoholic steatohepatitis and iron: Increased prevalence of mutations of the hfe gene in non-alcoholic steatohepatitis. J Hepatol. 1999;31:421–429. doi: 10.1016/s0168-8278(99)80032-4. [DOI] [PubMed] [Google Scholar]
- 15.Nelson JE, Bhattacharya R, Lindor KD, Chalasani N, Raaka S, Heathcote EJ, Miskovsky E, Shaffer E, Rulyak SJ, Kowdley KV. Hfe c282y mutations are associated with advanced hepatic fibrosis in caucasians with nonalcoholic steatohepatitis. Hepatology. 2007;46:723–729. doi: 10.1002/hep.21742. [DOI] [PubMed] [Google Scholar]
- 16.Nelson JE, Wilson L, Brunt EM, Yeh MM, Kleiner DE, Unalp-Arida A, Kowdley KV. Relationship between the pattern of hepatic iron deposition and histological severity in nonalcoholic fatty liver disease. Hepatology. 2011;53:448–457. doi: 10.1002/hep.24038. [DOI] [PMC free article] [PubMed] [Google Scholar]
- 17.Sorrentino P, D’Angelo S, Ferbo U, Micheli P, Bracigliano A, Vecchione R. Liver iron excess in patients with hepatocellular carcinoma developed on non-alcoholic steato-hepatitis. J Hepatol. 2009;50:351–357. doi: 10.1016/j.jhep.2008.09.011. [DOI] [PubMed] [Google Scholar]
- 18.Wu JC, Merlino G, Fausto N. Establishment and characterization of differentiated, nontransformed hepatocyte cell lines derived from mice transgenic for transforming growth factor alpha. Proc Natl Acad Sci U S A. 1994;91:674–678. doi: 10.1073/pnas.91.2.674. [DOI] [PMC free article] [PubMed] [Google Scholar]
- 19.Fatih N, Camberlein E, Island ML, Corlu A, Abgueguen E, Detivaud L, Leroyer P, Brissot P, Loreal O. Natural and synthetic stat3 inhibitors reduce hepcidin expression in differentiated mouse hepatocytes expressing the active phosphorylated stat3 form. J Mol Med (Berl) 2010;88:477–486. doi: 10.1007/s00109-009-0588-3. [DOI] [PubMed] [Google Scholar]
- 20.Messner DJ, Sivam G, Kowdley KV. Curcumin reduces the toxic effects of iron loading in rat liver epithelial cells. Liver Int. 2009;29:63–72. doi: 10.1111/j.1478-3231.2008.01793.x. [DOI] [PMC free article] [PubMed] [Google Scholar]
- 21.Malhi H, Bronk SF, Werneburg NW, Gores GJ. Free fatty acids induce jnk-dependent hepatocyte lipoapoptosis. J Biol Chem. 2006;281:12093–12101. doi: 10.1074/jbc.M510660200. [DOI] [PubMed] [Google Scholar]
- 22.Cousin SP, Hugl SR, Wrede CE, Kajio H, Myers MG, Jr., Rhodes CJ. Free fatty acid-induced inhibition of glucose and insulin-like growth factor i-induced deoxyribonucleic acid synthesis in the pancreatic beta-cell line ins-1. Endocrinology. 2001;142:229–240. doi: 10.1210/endo.142.1.7863. [DOI] [PubMed] [Google Scholar]
- 23.Ramirez-Zacarias JL, Castro-Munozledo F, Kuri-Harcuch W. Quantitation of adipose conversion and triglycerides by staining intracytoplasmic lipids with oil red o. Histochemistry. 1992;97:493–497. doi: 10.1007/BF00316069. [DOI] [PubMed] [Google Scholar]
- 24.Messner DJ, Ao P, Jagdale AB, Boynton AL. Abbreviated cell cycle progression induced by the serine/threonine protein phosphatase inhibitor okadaic acid at concentrations that promote neoplastic transformation. Carcinogenesis. 2001;22:1163–1172. doi: 10.1093/carcin/22.8.1163. [DOI] [PubMed] [Google Scholar]
- 25.Wheby MS, Umpierre G. Effect of transferrin saturation on iron absorption in man. N Engl J Med. 1964;271:1391–1395. doi: 10.1056/NEJM196412312712704. [DOI] [PubMed] [Google Scholar]
- 26.Grootveld M, Bell JD, Halliwell B, Aruoma OI, Bomford A, Sadler PJ. Non-transferrin-bound iron in plasma or serum from patients with idiopathic hemochromatosis. Characterization by high performance liquid chromatography and nuclear magnetic resonance spectroscopy. J Biol Chem. 1989;264:4417–4422. [PubMed] [Google Scholar]
- 27.Wardman P. Fluorescent and luminescent probes for measurement of oxidative and nitrosative species in cells and tissues: Progress, pitfalls, and prospects. Free Radic Biol Med. 2007;43:995–1022. doi: 10.1016/j.freeradbiomed.2007.06.026. [DOI] [PubMed] [Google Scholar]
- 28.Schenk S, Saberi M, Olefsky JM. Insulin sensitivity: Modulation by nutrients and inflammation. J Clin Invest. 2008;118:2992–3002. doi: 10.1172/JCI34260. [DOI] [PMC free article] [PubMed] [Google Scholar]
- 29.Leonard SS, Harris GK, Shi X. Metal-induced oxidative stress and signal transduction. Free Radic Biol Med. 2004;37:1921–1942. doi: 10.1016/j.freeradbiomed.2004.09.010. [DOI] [PubMed] [Google Scholar]
- 30.Eaton JW, Qian M. Molecular bases of cellular iron toxicity. Free Radic Biol Med. 2002;32:833–840. doi: 10.1016/s0891-5849(02)00772-4. [DOI] [PubMed] [Google Scholar]
- 31.Andrews NC, Schmidt PJ. Iron homeostasis. Annu Rev Physiol. 2007;69:69–85. doi: 10.1146/annurev.physiol.69.031905.164337. [DOI] [PubMed] [Google Scholar]
- 32.Pressman BC, deGuzman NT. Biological applications of ionophores: Theory and practice. Ann N Y Acad Sci. 1975;264:373–386. doi: 10.1111/j.1749-6632.1975.tb31497.x. [DOI] [PubMed] [Google Scholar]
- 33.Samuel VT, Petersen KF, Shulman GI. Lipid-induced insulin resistance: Unravelling the mechanism. Lancet. 2010;375:2267–2277. doi: 10.1016/S0140-6736(10)60408-4. [DOI] [PMC free article] [PubMed] [Google Scholar]
- 34.Ricchi M, Odoardi MR, Carulli L, Anzivino C, Ballestri S, Pinetti A, Fantoni LI, Marra F, Bertolotti M, Banni S, Lonardo A, Carulli N, Loria P. Differential effect of oleic and palmitic acid on lipid accumulation and apoptosis in cultured hepatocytes. J Gastroenterol Hepatol. 2009;24:830–840. doi: 10.1111/j.1440-1746.2008.05733.x. [DOI] [PubMed] [Google Scholar]
- 35.George DK, Goldwurm S, MacDonald GA, Cowley LL, Walker NI, Ward PJ, Jazwinska EC, Powell LW. Increased hepatic iron concentration in nonalcoholic steatohepatitis is associated with increased fibrosis. Gastroenterology. 1998;114:311–318. doi: 10.1016/s0016-5085(98)70482-2. [DOI] [PubMed] [Google Scholar]
- 36.Nelson JE, Brunt EM, Kowdley KV. Lower serum hepcidin and greater parenchymal iron in nonalcoholic fatty liver disease patients with c282y hfe mutations. Hepatology. 2012 doi: 10.1002/hep.25856. [DOI] [PMC free article] [PubMed] [Google Scholar]
- 37.Deguti MM, Sipahi AM, Gayotto LC, Palacios SA, Bittencourt PL, Goldberg AC, Laudanna AA, Carrilho FJ, Cancado EL. Lack of evidence for the pathogenic role of iron and hfe gene mutations in brazilian patients with nonalcoholic steatohepatitis. Braz J Med Biol Res. 2003;36:739–745. doi: 10.1590/s0100-879x2003000600009. [DOI] [PubMed] [Google Scholar]
- 38.Zamin I, Jr., Mattos AA, Mattos AZ, Migon E, Bica C, Alexandre CO. Prevalence of the hemochromatosis gene mutation in patients with nonalcoholic steatohepatitis and correlation with degree of liver fibrosis. Arq Gastroenterol. 2006;43:224–228. doi: 10.1590/s0004-28032006000300013. [DOI] [PubMed] [Google Scholar]
- 39.Bacon BR, Farahvash MJ, Janney CG, Neuschwander-Tetri BA. Nonalcoholic steatohepatitis: An expanded clinical entity. Gastroenterology. 1994;107:1103–1109. doi: 10.1016/0016-5085(94)90235-6. [DOI] [PubMed] [Google Scholar]
- 40.Angulo P, Keach JC, Batts KP, Lindor KD. Independent predictors of liver fibrosis in patients with nonalcoholic steatohepatitis. Hepatology. 1999;30:1356–1362. doi: 10.1002/hep.510300604. [DOI] [PubMed] [Google Scholar]
- 41.Bugianesi E, Manzini P, D’Antico S, Vanni E, Longo F, Leone N, Massarenti P, Piga A, Marchesini G, Rizzetto M. Relative contribution of iron burden, hfe mutations, and insulin resistance to fibrosis in nonalcoholic fatty liver. Hepatology. 2004;39:179–187. doi: 10.1002/hep.20023. [DOI] [PubMed] [Google Scholar]
- 42.Dongiovanni P, Fracanzani AL, Fargion S, Valenti L. Iron in fatty liver and in the metabolic syndrome: A promising therapeutic target. J Hepatol. 2011;55:920–932. doi: 10.1016/j.jhep.2011.05.008. [DOI] [PubMed] [Google Scholar]
- 43.Dongiovanni P, Valenti L, Ludovica Fracanzani A, Gatti S, Cairo G, Fargion S. Iron depletion by deferoxamine up-regulates glucose uptake and insulin signaling in hepatoma cells and in rat liver. Am J Pathol. 2008;172:738–747. doi: 10.2353/ajpath.2008.070097. [DOI] [PMC free article] [PubMed] [Google Scholar]
- 44.Facchini FS. Effect of phlebotomy on plasma glucose and insulin concentrations. Diabetes Care. 1998;21:2190. [PubMed] [Google Scholar]
- 45.Morino K, Petersen KF, Shulman GI. Molecular mechanisms of insulin resistance in humans and their potential links with mitochondrial dysfunction. Diabetes. 2006;55(Suppl 2):S9–S15. doi: 10.2337/db06-S002. [DOI] [PMC free article] [PubMed] [Google Scholar]
- 46.Leclercq IA, Farrell GC, Sempoux C, dela Pena A, Horsmans Y. Curcumin inhibits nf-kappab activation and reduces the severity of experimental steatohepatitis in mice. J Hepatol. 2004;41:926–934. doi: 10.1016/j.jhep.2004.08.010. [DOI] [PubMed] [Google Scholar]
- 47.Shapiro H, Bruck R. Therapeutic potential of curcumin in non-alcoholic steatohepatitis. Nutr Res Rev. 2005;18:212–221. doi: 10.1079/NRR2005106. [DOI] [PubMed] [Google Scholar]
- 48.Weisberg SP, Leibel R, Tortoriello DV. Dietary curcumin significantly improves obesity-associated inflammation and diabetes in mouse models of diabesity. Endocrinology. 2008;149:3549–3558. doi: 10.1210/en.2008-0262. [DOI] [PMC free article] [PubMed] [Google Scholar]


