

Abstract
Study Objectives:
To investigate differences in cortical thickness in patients with obstructive sleep apnea (OSA) syndrome and healthy controls.
Design:
Cortical thickness was measured using a three-dimensional surface-based method that enabled more accurate measurement in deep sulci and localized regional mapping.
Setting:
University hospital.
Patients:
Thirty-eight male patients with severe OSA (mean apnea-hypopnea index > 30/h) and 36 age-matched male healthy controls were enrolled.
Interventions:
Cortical thickness was obtained at 81,924 vertices across the entire brain by reconstructing inner and outer cortical surfaces using an automated anatomical pipeline.
Measurements:
Group difference in cortical thickness and correlation between patients' data and thickness were analyzed by a general linear model.
Results:
Localized cortical thinning in patients was found in the orbitorectal gyri, dorsolateral/ventromedial prefrontal regions, pericentral gyri, anterior cingulate, insula, inferior parietal lobule, uncus, and basolateral temporal regions at corrected P < 0.05. Patients with OSA showed impaired attention and learning difficulty in memory tests compared to healthy controls. Higher number of respiratory arousals was related to cortical thinning of the anterior cingulate and inferior parietal lobule. A significant correlation was observed between the longer apnea maximum duration and the cortical thinning of the dorsolateral prefrontal regions, pericentral gyri, and insula. Retention scores in visual memory tests were associated with cortical thickness of parahippocampal gyrus and uncus.
Conclusions:
Brain regions with cortical thinning may provide elucidations for prefrontal cognitive dysfunction, upper airway sensorimotor dysregulation, and cardiovascular disturbances in OSA patients, that experience sleep disruption including sleep fragmentation and oxygen desaturation.
Citation:
Joo EY; Jeon S; Kim ST; Lee JM; Hong SB. Localized cortical thinning in patients with obstructive sleep apnea syndrome. SLEEP 2013;36(8):1153-1162.
Keywords: Brain, cortical thickness, MRI, obstructive sleep apnea
INTRODUCTION
Obstructive sleep apnea (OSA) is a prevalent sleep disorder characterized by recurrent episodes of complete or partial collapse of the upper airway that are associated with intermittent hypoxemia and recurrent arousals from sleep.1 Deficits in memory, attention, and visuoconstructive abilities frequently accompany OSA.2 The pathophysiology of these deficits remains controversial, although the main contributory factors are presumed to be sleep fragmentation and intermittent nocturnal hypoxemia during sleep apnea.3 Deterioration of cognitive performance has been significantly correlated with the degree of nocturnal hypoxemia and the severity of nocturnal breathing irregularities.4
The structural changes seen via brain magnetic resonance imaging (MRI) imply the chronic state of disease rather than the functional alteration of glucose metabolism or regional blood flow. Differences in brain morphology that are not identifiable by routine visual inspection of individual brain MRI scans can be investigated using voxel-based morphometry (VBM). Previous VBM studies reported equivocal results in patients with OSA. They can display selectively decreased gray matter volume in the limbic-paralimbic structures5 and some cortical areas.6 We reported reduced gray matter concentration (GMC) in prefrontal and limbic cortices and cerebellum in untreated patients with OSA7 and suggested that significant morphological changes in the brains of patients with OSA may explain the incomplete modulation of upper airway motor function or cardiovascular and respiratory control during sleep4 and cognitive decline.7 However, other investigators could not find any gray matter deficits or focal structural changes in patients with OSA.8 The discrepancies in the results between VBM studies mayt be due to differences in the analysis processes used and in the clinical characteristics of patients. Moreover, the VBM methods can be inaccurate in representing gray matter morphology and localization in the sulcal regions, where the fine details of the anatomy are often obscured by a partial volume effect.
Cortical thickness measurement has been suggested in studies of gray matter morphometry as a strategy for overcoming the limitation of volumetric analyses.9 A cortical thickness analysis performed at the nodes of a three-dimensional (3-D) polygonal mesh has the advantage of providing a direct quantitative index of cortical morphology.10 In contrast to VBM, cortical thickness measured from the cortical surfaces differentiates between cortices of opposing sulcal walls within the same sulcal bed, enabling more precise measurement in deep sulci and analysis of the morphology as a cortical sheet.10,11
There have been no studies of brian cortical thickness in OSA patients. The aim of this study was to investigate the differences in cortical thickness between untreated OSA patients and controls using an advanced surface-based method that allows for more precise thickness measurements of the complex cerebral cortical structure and localized regional mapping.
METHODS
Patients
Forty-three male patients with severe OSA were recruited from the sleep disorder clinic of the Sleep Center, Samsung Medical Center, Seoul, South Korea. Inclusion criteria were male sex, age older than18 y but younger than 55 y, and an apnea-hypopnea index (AHI) greater than 30. Thirty-six age-matched controls were recruited using an advertisement in a local community. Each candidate had a detailed clinical interview, sleep questionnaire, and overnight polysomnography (PSG). Control candidates were excluded if they exhibited evidence of OSA (AHI greater than 5) or evidence for other sleep disorders such as periodic limb movement disorders. Exclusion criteria for patients with OSA and controls were: (1) mean daily sleep time < 7 h, (2) abnormal sleep-wake rhythm, (3) other sleep disorders, (4) hypertension, diabetes, and heart and respiratory diseases, (5) history of cerebrovascular disease, (6) other neurological (neurodegenerative diseases, epilepsy, head injury) or psychiatric diseases (psychosis, current depression), (7) alcohol or illicit drug abuse or current intake of psychoactive medications, and (8) a structural lesion on brain MRI. Five patients who showed diffuse brain atrophy on brain MRI were excluded from the patient group. Finally, 38 patients with OSA and 36 controls were included in the current study. Informed consent was obtained from all patients and the institutional review board of this hospital authorized the study protocol.
Overnight PSG
The day before sleep studies, patients were asked to abstain from drinking alcohol or caffeinated beverages. Sleep studies were recorded using Somnologica (Embla; Denver, CO, USA). PSG was recorded from approximately 23:00 to 07:00 the next day. Sleep architecture was scored in 30-sec epochs based on Rechtschaffen and Kales rules for sleep. Apneas and hypopneas were defined by standard scoring12 and arousals were classified according to American Sleep Disorders Association rules.13
Neuropsychological Assessments
Patients with OSA and controls underwent a battery of neuro-psychological tests and an individual standardized intelligence test. Neuropsychological tests consisted of the Korean California Verbal Test and the Rey Complex Figure Test (RCFT) for memory function; digit span tests from the Wechsler Memory Scale-Revised and Corsi block tapping tests (forward and backward) for attention and working memory; and the Korean Boston naming test for verbal function. Detailed information regarding these tests was described in a previous article.14 The battery of tests required 2.5 h to complete.
Magnetic Resonance Imaging
MRI was performed using a Philips 3.0 Tesla scanner (Achieva, Philips Medical Systems, Best, the Netherlands) using a 16-channel head coil. All patients underwent 3-D T1- and T2-weighted, and fluid attenuated inversion recovery (FLAIR) imaging protocols. T1-weighted images were obtained using the following scanning variables: sagittal 0.5 mm thickness, 360 slices, no gap, repetition time/echo time = 9.90/4.60 ms, flip angle = 8°, number of excitations = 1, sensitivity encoding factor = 2.0, overcontiguous slices with 50% overlap, matrix size of 480 × 480 over a field of view of 240 × 240 mm, and reconstructed voxel dimension of T1-weighted images = 0.50 × 0.50 × 0.50 mm. Scans were visually checked for image quality. If an artifact was present, the scan was repeated.
Cortical Surface Extraction and Measurement of Cortical Thickness
All T1-weighted MRI scan data were submitted to the automated anatomical pipeline developed at the laboratory of Alan C. Evans, Montreal Neurological Institute (MNI) for measuring cortical thickness.15,16 T1-weighted images were registered into the ICBM152 template using the affine transform and corrected for intensity variations due to B1-field inhomogeneities.17,18 Registered T1-weighted images were classified into four categories (gray matter, white matter, cerebrospinal fluid, and background) using a neural net algorithm after brain extraction.19 Cortical surfaces were extracted using the Constrained Laplacian Anatomic Segmentation using Proximity (CLASP) method with 40,962 vertices for each hemisphere.20 The extracted surfaces were normalized for corresponding vertexes between individual patients using the surface-based registration.21 Surfaces were transformed back into each patient's native space and cortical thickness was calculated using the t-link method, which measures the Euclidean distances between the corresponding vertices of the inner (gray matter/white matter interfaces) and outer (cerebrospinal fluid/gray matter interface) surfaces.22 Cortical thickness map was subsequently smoothed using surface-based diffusion kernel with a 20 mm full width at half maximum.23
Every result of automated pipeline was carefully checked by two inspectors (blinded to subject information) to confirm the absence of MRI artifact and processing error. Four images were manually corrected for the registration and/or brain extraction error.
Statistical Analyses
Statistical analysis was performed using the Surfstat toolbox created at the laboratory of Keith J. Worsley.24 Both hemispheres were tested together after masking subcortical and ventricular regions out on the cortical surface model. Therefore, a total of 78,570 vertices were included in the statistical test. To estimate the neuroanatomical alterations between patients with OSA and controls, a vertex-wise general linear model (GLM) approach was applied for native cortical thickness with the effect of age and brain size taken into account.10
For the correlation analysis, the demographics (age, body mass index), PSG parameters in Table 1 and scores of neuropsychological tests in Table 2 were tested using GLM against the native cortical thickness with the effect of age and brain size taken into account. Patients with OSA and controls were tested separately to avoid confounding effects of the different clinical states between groups. To test the hypotheses of regional specific covariates effects, the estimates were compared using two linear contrasts (positive or negative correlation). The multiple comparisons were controlled by false discovery rate (FDR) method for the group differences.25 We reported cortical regions reaching a significant level of FDR corrected P < 0.05. Illustration of effect size (Cohen d) between two groups was described. To show the relationship between the tested factors and cortical thickness, we selected a significant level of P < 10-3. The major peak vertices were reported as a scatter plot between significant factors and standardized residuals of cortical thickness.
Table 1.
Subjects characteristics

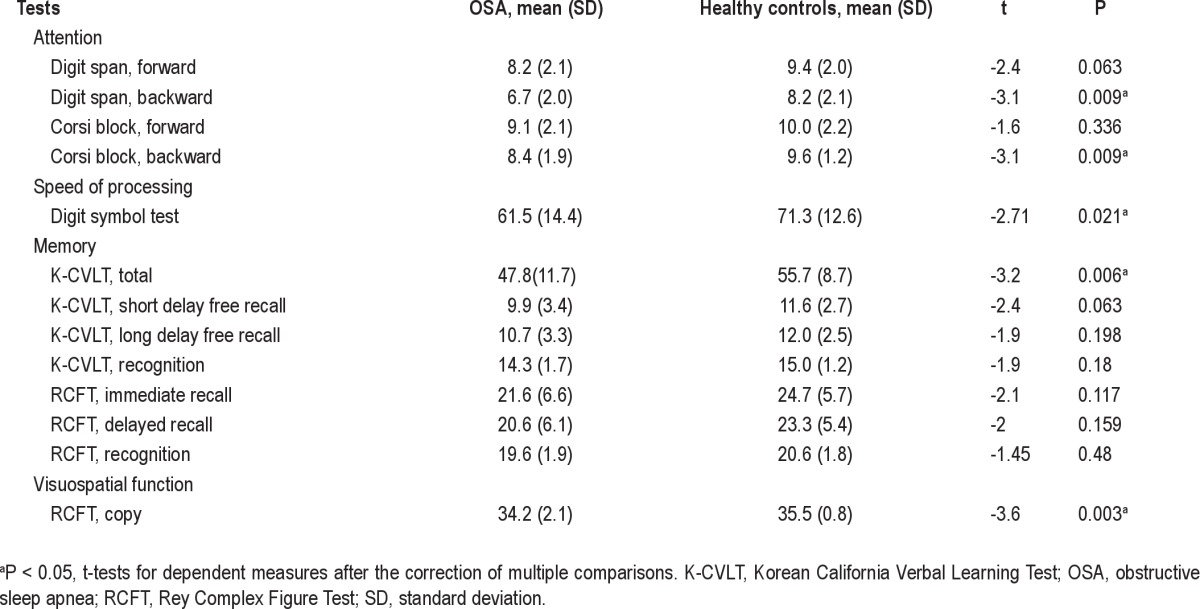
Table 2.
Comparison of neuropsychological tests scores between patients with OSA and healthy controls
RESULTS
Clinical Characteristics
All patients with OSA and controls were right-handed, middle-aged males. T1, T2, and FLAIR images were inspected to exclude patients with OSA or controls who had gross structural abnormalities in brain MRIs. Clinical characteristics and detailed PSG findings of subjects are summarized and compared in Table 1. Three of 38 patients had periodic limb movement during sleep (PLMS) (total PLMX index, 31.5-54.1/h; movement arousal index, 1.5-9.5/h), whereas none of the controls did. Seven patients with OSA who reported severe daytime sleepiness (Epworth Sleepiness Scale 18-20) underwent the Multiple Sleep Latency Test (MSLT) on the day following PSG. Mean sleep latency for the MSLT in these seven patients was 9.0 ± 3.5 min (range, 5.4-15.0). A sleep-onset rapid eye movement period was not observed. Patients with OSA reported significantly more depressed mood than controls (mean Beck Depression Inventory [BDI] score: 12.5 versus 5.0, P = 0.025). Patients experienced more general depressive symptoms than controls (9.4 ± 3.8 versus 2.6 ± 2.1, P = 0.001), but not somatic symptoms of BDI subscales (3.3 ± 1.5 versus 2.4 ± 2.2, P = 0.057).
Neuropsychological Tests
Intelligence quotients were not different between groups, but patients with OSA showed significantly slower speed of processing than controls. Scores of sustained verbal and visual attention were significantly decreased in patients with OSA, whereas scores of momentary attention were spared. Patients showed overall lower performance in verbal and visual memory tests although this result was no longer significant with correction for multiple comparisons. However, patients had significant difficulty in learning of verbal memory and impaired visual vigilance tasks (Table 2).
Cortical Thickness Analysis
The mean cortical thickness across the whole brain was significantly thinner (t = 3.14, P < 0.005) in patients with OSA (3.10 ± 0.78 mm) compared with controls (3.17 ± 0.97 mm) after controlling for age and brain size effect (Figure 1). Significant cortical thinning in patients with OSA was found in the dorsolateral prefrontal regions, the ventromedial prefrontal cortices, bilateral precentral/postcentral gyri, left anterior cingulate gyrus, left insula, left inferior parietal lobule, right supramarginal gyrus, right precuneus, bilateral uncus, left parahippocampal gyrus, right fusiform gyrus, and the lateral temporal regions at the level of FDR corrected P < 0.05, which corresponds to nominal P < 0.0016 (Figure 2). The t-values and regional information of peak vertexes in the cortical thickness comparison are summarized in Table 3. There were no significant brain regions with increased cortical thickness in patients with OSA.
Figure 1.

Group difference of mean cortical thickness. Significant cortical thinning in the patients with OSA (3.10 ± 0.78 mm) compared with controls (3.17 ± 0.97 mm) after controlling for age and brain size (t = -3.14, P < 0.005). In the box plot, the central rectangle spans the 25th to the 75th percentile. A segment inside the rectangle shows the 50th percentile (median) and whiskers above and below the box show the locations of the minimum and maximum value.
Figure 2.

Localized cortical thinning in patients with OSA. Illustration of the statistical map reaching false discovery rate corrected P < 0.05 (A) and effect size (B) of group difference accounting for age and brain size. Blue color indicates thinner cortex. Detailed regional information is presented in Table 3.
Table 3.
Brain regions showing significant decrease of cortical thickness using a surface-based method in patients with OSA compared with controls

Correlation analyses were performed between regional cortical thickness and patients' data. In patients with OSA, significant negative correlations were found between several cortical areas and arousal index (per h), respiratory arousals (%), and the longer apnea maximum duration (sec) (Table 4, Figure 3). Other PSG parameters did not show significant correlations. Among neuropsychological tests, recognition scores in RCFT showed significantly positive correlations with the cortical thickness of right parahippocampal gyrus (x : y : z = 26.6 : -0.6 : -27.7, t = 4.14) and right uncus (x : y : z = 24.5 : 0.6 : -29.9, t = 4.10) at the level of P < 10-3. The t-values and regional information of peak vertexes in the correlation analysis of cortical thickness are summarized in Table 4. In controls, there was no significant correlation of cortical thickness with any data.
Table 4.
Brain regions showing significantly negative correlation between cortical thickness and polysomnographic parameters in patients with OSA

Figure 3.

Brain areas showing significant relationships between local cortical thickness and patients' polysomnography parameters. Significant negative correlations between cortical thickness and arousal index (per hour), respiratory arousal (%), and apnea maximum duration (sec) at the level of P < 10-3 after accounting for the effect of age and brain size. The x-axis indicates polysomnography parameters; the y-axis indicates standardized residuals of cortical thickness at peak vertices. Detailed regional information listed in Table 4.
DISCUSSION
In the current study, a cortical thickness analysis was performed to identify cerebral structural abnormalities in untreated patients with OSA compared with age-matched controls.
Cortical Thinning of the Dorsolateral Prefrontal Regions and Inferior Parietal Lobules in Patients with OSA
The current study showed a significant cortical thinning for patients with OSA in the dorsolateral prefrontal regions (left or right superior to inferior frontal gyri) as well as the left inferior parietal lobule. The dorsolateral prefrontal cortex is responsible for planning, working memory, and attention.26 The inferior parietal lobule also has been implicated in attention processing.27
OSA leads to sleep fragmentation and a chronic sleep-deprived state. Patients with OSA frequently report neurocognitive problems as well as daytime sleepiness.4,5 Sleep disturbances preferentially lead to dysfunction in the prefrontal cortex, a region of the brain that controls behavioral inhibition, set shifting, and self-regulation of affect and arousal.28 These OSA-induced functional deficits cannot be accounted for by sleepiness itself and may represent neuronal damage.29
Previously untreated patients with OSA with impairments in most cognitive areas and mood, and sleepiness have shown focal reductions of gray matter in the superior frontal gyrus and posterior parietal cortex.30 Data from the current patients showed that higher arousal indices and respiratory arousals (%) were closely correlated with cortical thinning in the dorsolateral prefrontal cortices or inferior parietal lobule. Respiratory arousal (%) of the patients with OSA was higher (mean 71.0%) than in controls (29.7%), which may imply that sleep fragmentation of OSA patients occurred mostly due to sleep disordered breathing. In addition, the higher respiratory arousals (%) were related to the longer apnea maximum duration in the patients (r = 0.536, P = 0.001). Apnea maximum durations of the patients (mean, 58.7 sec) were also inversely correlated to cortical thickness in dorsolateral prefrontal regions.
Therefore, these findings suggest that sleep fragmentation (frequent awakenings due to sleep apneas) and accompanying oxygen desaturation are strongly associated with brain tissue damage in regions involved in several cognitive domains such as prefrontal cortices and inferior parietal lobule.
Cortical Thinning of the Pericentral (Precentral and Postcentral) Gyri in Patients with OSA
This study revealed significant cortical thinning of the bilateral pericentral (precentral and postcentral) areas in patients with OSA. Moreover, cortical thinning in the left or right pericentral gyri was correlated with arousal indices, respiratory arousals (%), and apnea maximum duration. Snorers and patients with OSA display upper airway neuromuscular abnormalities during wakefulness. The damage resulting from mechanical vibration or trauma and/or hypoxemia associated with repetitive upper airway collapse may further impair sensorimotor function.31 It has been noted that the tongue of patients with OSA might be vulnerable to fatigue, possibly because of structural changes in muscle fiber types, and that the neuromuscular abnormality of the tongue may contribute to OSA progression.32 The tongue sensory region has been localized to a unique gyral structure at the base of the postcentral gyrus with cortical stimulation.33 Functional MRI had revealed that tongue elevation activates the lateral precentral and postcentral gyri, with larger activation in the left hemisphere34 while a lower face sensory task had activated a characteristic narrowed portion of the postcentral gyrus located immediately above the triangular sensory tongue area.35 In patients with OSA and Cheyne-Stokes breathing, notable functional MRI signal changes have been reported in the inferior part of the postcentral gyri; the signal reduction in the sensory cortex was located in the region receiving information from the face during apneic events.36
Thus, cortical thinning of the inferior part of the postcentral gyri in patients with OSA may provide structural evidence of sensory abnormalities in the tongue, which is one of the upper airway dilator muscles. More frequent arousals due to bouts of sleep apnea and increased thinning in the precentral and post-central gyri support the hypothesis that repetitive upper airway collapse may further impair sensorimotor function and contribute to disease progression.
Cortical Thinning of the Anterior Cingulate and Insula in Patients with OSA
The cingulate and insula are involved in cardiovascular control. The insular cortex receives nociceptive and visceral sensory input, and exerts significant influences on sympathetic and parasympathetic nervous system activity.37 Insular functional MRI signals can be disturbed in Valsalva38 and cold pressor challenges39 in patients with OSA, who display increased sympathetic tone and higher heart rates.40 The cingulate cortex is a key component of the the Papez circuit and is involved in functions of the gut and emotions. This structure is also related to the control of certain autonomic functions, including respiration, blood pressure, and salivary secretion. The cingulate areas are activated by dyspnea, breathlessness, and emotion related to the need for air, which demonstrates that the cingulate cortex has a complex and indirect relationship with central networks that control respiration.41 A recent study confirmed excess cardiac events over a 10-y period in patients with untreated severe OSA.42 VBM analyses of patients with OSA showed reduced GMC in anterior cingulate and insula areas,43 similar to the current findings. It should be acknowledged that the anterior cingulate and anterior insula are the most common regions enrolled by different mental processing and pathologic changes and therefore are the least able to support strong reverse inferences.43 Nevertheless, the significant correlations between higher respiratory arousal percentage and cortical thinning of anterior cingulate region as well as between the longer apnea duration and cortical thinning of the inferior parietal lobule suggest that affective and cardiovascular disturbances may occur in patients with severe OSA.
Cortical Thinning of the Basal and Lateral Temporal Cortices in Patients with OSA
Patients with OSA showed cortical thinning in the uncus, basal temporal (parahippocampal and fusiform gyri), and lateral temporal regions (superior to inferior temporal gyri). Structural abnormalities of the lateral temporal cortices found in patients with OSA have been reported in several VBM studies.6,7,44 In a brain single -photon emission computed tomography study, the regional cerebral perfusions of patients with OSA were significantly reduced in the basal temporo-occipital area (parahippocampal and lingual gyri).45 The parahippocampal gyrus plays an important role in the formation and retrieval of topographic memory and memories of scenes. Significant activation of the parahippocampal gyrus was observed in the episodic autobiographic images of controls in a functional MRI study.46 In an adult rodent model, intermittent hypoxia, which may be observed in patients with OSA, was associated with neurodegenerative changes in the hippocampus and neocortex.47 Rats exposed to chronic hypoxia display significant spatial-learning impairment in the Morris water maze.48 The uncus and lateral temporal neocortex are closely connected to the limbic cortex, which is responsible for memory and mood status, and is susceptible to hypoxic damage in an animal model of OSA.49 Also, we observed that higher arousal indices and longer apnea maximum duration were significantly related to cortical thinning of basal or lateral temporal regions and to decreased ability in verbal and visual attention as well as memory tasks in the patients.
Attention and memory are closely related, and so a person with attention deficits frequently complains of memory impairment rather than difficulties paying attention. In this study, patients had significant problems in maintaining attention and in verbal memory learning. On the contrary, their retention ability for long-term memory (delayed recall and discriminability) was relatively preserved. Although recognition scores in RCFT were not significantly lower in patients with OSA than controls, a substantial correlation was found with cortical thickness in right parahippocampal gyrus and uncus. The cortical thinning in patients with OSA compared with controls was significant at FDR corrected P < 0.05. However, all significant results in the correlation analyses at uncorrected P < 0.001 were not maintained after correcting for multiple comparisons. This might be due to the relatively small sample size and to the interindividual differences in baseline scores of patients' neuropsychological tests. Daytime sleepiness and poor quality of sleep may also affect the cognitive function of patients. A crosssectional study has limitations in evaluating whether cognitive changes were caused by OSA itself or by the brain structural changes. A longitudinal study with follow-up brain MRI and neuropsychological tests in large samples is needed to address this limitation. Memory complaints in patients with OSA appears to be associated with problems in attention and initial registration process of memory. A negative correlation between cortical thickness of the inferior parietal lobule, which is related to the attention processing, and the higher respiratory arousals observed in our patients may support the impaired attention in patients with OSA.
Thus, these findings suggest a significant relationship between poorer sleep quality due to sleep apneas and cortical thinning in basal and lateral temporal cortices as well as inferior parietal lobule, which may be associated with attention, memory impairment, and spatiallearning deficits found in the untreated patients with OSA.
Cortical Thinning of the Ventromedial Prefrontal Cortex in Patients with OSA
Patients with OSA exhibit a high incidence of depression, with up to half of patients experiencing depressive symptoms.50 The patients enrolled in the study reported more depressive feelings on the BDI scores (mean 12.5) than control patients (5.0), although no patient had taken antidepressants and no previous diagnosis of a major depressive disorder had been made. Depressive symptoms seem to contribute to the brain alterations found in patients with OSA, or the neural pathology accompanying OSA fosters development of depressive symptoms.51 The ventromedial prefrontal cortex contributes to awareness and emotional processing.52 A H215O positron emission tomography study of depressive patients revealed reduced cerebral activity and cortical volume loss in the frontal cortex ventral to the genu of the corpus callosum.53
Although statistically significant correlations were not found between orbital cortex and BDI scores, cortical thinning of the orbitorectal gyri of patients implicates the possible relationship of OSA with mood disturbances of the patients.
Comparison of the Cortical Thickness Analysis and Voxel-Based Morphometry Results in Patients with OSA
VBM is a commonly used method to investigate neuroanatomical correlates of neurological disorders.54 Previous VBM studies of OSA have produced inconsistent results.6–8,43,55 Even though these studies used the same VBM method, the detailed processes used (e.g., the SPM version, modulated or unmodulated, grand mean scaling, and absolute or relative thresholding) differed.56 However, differences in subject selection and methodological issues may result in equivocal results. However, the results of a cortical thickness analysis may be less prone to variation between laboratories because thickness measurement procedures are quite consistent.57 Previously, bilateral reduction of GMC was reported in most portions of cingulate gyri, caudate nuclei, thalami, and frontal and temporal cortices including amygdalo hippocampal areas and cerebellar hemispheres in patients with OSA.8 Cortical thinning of the dorsolateral and ventral prefrontal areas, anterior cingulate, insula, and lateral temporal areas in our patients with OSA appears to be consistent with the regions where we observed significant reduced GMC in the previous VBM study.7 The main difference between the two methods was that the regions of interest in the cortical thickness analysis did not involve subcortical areas such as the basal ganglia or thalamus.
We found that unilateral cortical thinning emerged in the ventral lateral frontal cortex, anterior cingulate cortex, insula, and parietal cortex in the left hemisphere. Although the unilateral gray matter deficiency in particular sites provides evidences against global effects of apnea, it should be considered that a greater proportion of regions showing unilateral cortical thinning is located in well-perfused areas and would be less susceptible to ischemic damage. Brain regions might have different susceptibility to ischemic insults58 and numerous neuroimaging studies have shown asymmetrical findings.4–8,11,30,44,45,55 Physiological changes accompanied by OSA were fluctuations in blood pressure, cerebral blood flow,59 or intracranial pressure,60 and altered cerebral vasomotor reactivity.61 These changes might play a role in asymmetric structural and functional changes in patients. It could be assumed that bilateral cortical thinning might result from ischemic or other physiologic changes accompanying obstruction and that unilateral change may originate from an initial brain insult or ischemic event, which leads to a cascade of neural damage resulting in ineffective capabilities to respond to minor respiratory challenges during sleep.6
In conclusion, this work presents a regional decreased pattern of cortical thickness in untreated patients with OSA. The cortical thinning of the dorsolateral and ventromedial prefrontal regions, inferior parietal lobules, anterior cingulate, insula, and basolateral temporal regions may provide possible neuroanatomical substrates related to disturbances in executive function, upper airway sensorimotor dysregulation, cardiovascular disturbances, and attentionmemory and mood problems in patients with OSA. These changes may be closely linked to sleep fragmentation and oxygen desaturation resulting from repetitive episodes of sleep apnea.
DISCLOSURE STATEMENT
This was not an industry supported study. The authors have indicated no financial conflicts of interest.
ACKNOWLEDGMENTS
This study was supported by a grant of the Korean Health Technology R&D Project, Ministry for Health, Welfare and Family Affairs, Republic of Korea (No. A110097). The authors thank So-Mee Yoon, MS (Department of Psychology, Graduate, The Catholic University of Korea, Seoul, Korea) and Eun-Hwa Kim, MS (Department of Neurology, Samsung Medical Center, Sungkyunkwan University, Seoul, Korea) for their assistance with neuropsychological data collection and statistical analyses and Ivy Cheung (Department of Neurology, Northwestern university, Chicago, IL, USA) for her proofreading of English writing. Drs. Joo and Jeon contributed equally to write the manuscript in this study.
REFERENCES
- 1.American Academy of Sleep Medicine Task Force. Sleep-related breathing disorders in adults: recommendations for syndrome definition and measurement techniques in clinical research. Sleep. 1999;22:667–89. [PubMed] [Google Scholar]
- 2.Decary A, Rouleau I, Montplaisir J. Cognitive deficits associated with sleep apnea syndrome: a proposed neuropsychological test battery. Sleep. 2000;23:369–81. [PubMed] [Google Scholar]
- 3.Torelli F, Moscufo N, Garreffa G, et al. Cognitive profile and brain morphological changes in obstructive sleep apnea. Neuroimage. 2011;54:787–93. doi: 10.1016/j.neuroimage.2010.09.065. [DOI] [PMC free article] [PubMed] [Google Scholar]
- 4.Montplaisir J, Bedard MA, Richer F, Rouleau I. Neurobehavioral manifestations in obstructive sleep apnea syndrome before and after treatment with continuous positive airway pressure. Sleep. 1992;15:S17–9. doi: 10.1093/sleep/15.suppl_6.s17. [DOI] [PubMed] [Google Scholar]
- 5.Morrell MJ, McRobbie DW, Quest RA, Cummin AR, Ghiassi R, Corfield DR. Changes in brain morphology associated with obstructive sleep apnea. Sleep Med. 2003;4:451–4. doi: 10.1016/s1389-9457(03)00159-x. [DOI] [PubMed] [Google Scholar]
- 6.Macey PM, Henderson LA, Macey KE, et al. Brain morphology associated with obstructive sleep apnea. Am J Respir Crit Care Med. 2002;166:1382–7. doi: 10.1164/rccm.200201-050OC. [DOI] [PubMed] [Google Scholar]
- 7.Joo EY, Tae WS, Lee MJ, et al. Reduced brain gray matter concentration in patients with obstructive sleep apnea syndrome. Sleep. 2010;33:235–41. doi: 10.1093/sleep/33.2.235. [DOI] [PMC free article] [PubMed] [Google Scholar]
- 8.O'Donoghue FJ, Briellmann RS, Rochford PD, et al. Cerebral structural changes in severe obstructive sleep apnea. Am J Respir Crit Care Med. 2005;171:1185–90. doi: 10.1164/rccm.200406-738OC. [DOI] [PubMed] [Google Scholar]
- 9.Kabani N, Le Goualher G, MacDonald D, Evans AC. Measurement of cortical thickness using an automated 3-D algorithm: a validation study. Neuroimage. 2001;13:375–80. doi: 10.1006/nimg.2000.0652. [DOI] [PubMed] [Google Scholar]
- 10.Im K, Lee JM, Lee J, et al. Gender difference analysis of cortical thickness in healthy young adults with surface-based methods. Neuroimage. 2006;31:31–8. doi: 10.1016/j.neuroimage.2005.11.042. [DOI] [PubMed] [Google Scholar]
- 11.Joo EY, Jeon S, Lee M, et al. Analysis of cortical thickness in narcolepsy patients with cataplexy. Sleep. 2011;34:1357–64. doi: 10.5665/SLEEP.1278. [DOI] [PMC free article] [PubMed] [Google Scholar]
- 12.Iber C, Ancoli-Israel S, Chesson A, Quan S. 1st ed. Westchester, Illinois: American Academy of Sleep Medicine; 2007. The AASM manual for the scoring of sleep and associated events: rules, terminology and technical specifications. [Google Scholar]
- 13.Bonnet MH, Carley D, Carskadon M, et al. EEG arousals: scoring rules and examples: a preliminary report from the Sleep Disorders Atlas Task Force of the American Sleep Disorders Association. Sleep. 1992;15:173–84. [PubMed] [Google Scholar]
- 14.Noh HJ, Joo EY, Kim ST, et al. The relationship betwen hippocampal volume and congnition in patients with chronic primary insomnia. J Clin Neurol. 2012;8:130–8. doi: 10.3988/jcn.2012.8.2.130. [DOI] [PMC free article] [PubMed] [Google Scholar]
- 15.Ad-Dab'bagh Y, Lyttelton O, Muehlboeck JS, et al. The CIVET image-processing environment: A fully automated comprehensive pipeline for anatomical neuroimaging research. In: Corbetta M, editor. Proceedings of the 12th Annual Meeting of the Organization for Human Brain Mapping; 2006; Florence, Italy. [Google Scholar]
- 16.Zijdenbos AP, Forghani R, Evans AC. Automatic “pipeline” analysis of 3-D MRI data for clinical trials: application to multiple sclerosis. IEEE Trans Med Imaging. 2002;21:1280–91. doi: 10.1109/TMI.2002.806283. [DOI] [PubMed] [Google Scholar]
- 17.Collins DL, Neelin P, Peters TM, Evans AC. Automatic 3D intersubject registration of MR volumetric data in standardized Talairach space. J Comput Assist Tomogr. 1994;18:192–205. [PubMed] [Google Scholar]
- 18.Sled JG, Zijdenbos AP, Evans AC. A nonparametric method for automatic correction of intensity nonuniformity in MRI data. IEEE Trans Med Imaging. 1998;17:87–97. doi: 10.1109/42.668698. [DOI] [PubMed] [Google Scholar]
- 19.Zijdenbos AP, Evans AC, Riahi F, Sled JG, Chui J, Kollokian V. Automatic quantification of multiple sclerosis lesion volume using stereotaxic space. Lect Notes Comput Sci; Proc, 4th Intl Conf. on Visualization in BioMed Computing VBC; 1996. pp. 439–48. [Google Scholar]
- 20.Kim JS, Singh V, Lee JK, et al. Automated 3-D extraction and evaluation of the inner and outer cortical surfaces using a Laplacian map and partial volume effect classification. Neuroimage. 2005;27:210–21. doi: 10.1016/j.neuroimage.2005.03.036. [DOI] [PubMed] [Google Scholar]
- 21.Robbins S, Evans AC, Collins DL, Whitesides S. Tuning and comparing spatial normalization methods. Med Image Anal. 2004;8:311–23. doi: 10.1016/j.media.2004.06.009. [DOI] [PubMed] [Google Scholar]
- 22.MacDonald D, Kabani N, Avis D, Evans AC. Automated 3-D extraction of inner and outer surfaces of cerebral cortex from MRI. Neuroimage. 2000;12:340–56. doi: 10.1006/nimg.1999.0534. [DOI] [PubMed] [Google Scholar]
- 23.Chung MK, Worsley KJ, Robbins S, et al. Deformation-based surface morphometry applied to gray matter deformation. Neuroimage. 2003;18:198–213. doi: 10.1016/s1053-8119(02)00017-4. [DOI] [PubMed] [Google Scholar]
- 24.Worsley K, Taylor J, Carbonell F, Chung M, Duerden E. SurfStat: A Matlab toolbox for the statistical analysis of univariate and multivariate surface and volumetric data using linear mixed effects models and random field theory. NeuroImage Organization for Human Brain Mapping 2009 Annual Meeting; 2009. p. S102. [Google Scholar]
- 25.Genovese CR, Lazar NA, Nichols T. Thresholding of statistical maps in functional neuroimaging using the false discovery rate. NeuroImage. 2002;15:870–8. doi: 10.1006/nimg.2001.1037. [DOI] [PubMed] [Google Scholar]
- 26.Chan RC, Shum D, Toulopoulou T, Chen EY. Assessment of executive functions: Review of instruments and identification of critical issues. Arch Clin Neuropsychol. 2008;23:201–16. doi: 10.1016/j.acn.2007.08.010. [DOI] [PubMed] [Google Scholar]
- 27.Cohen RA, Salloway S, Sweet LH. Neuropsychiatric aspects of disorders of attention. In: Yudofsky SC, Hales RE, editors. Textbook of Neuropsychiatry. Washington, DC: American Psychiatric Press; 2008. pp. 405–44. [Google Scholar]
- 28.Beebe DW, Gozal D. Obstructive sleep apnea and the prefrontal cortex: towards a comprehensive model linking nocturnal upper airway obstruction to daytime cognitive and behavioral deficits. J Sleep Res. 2002;11:1–16. doi: 10.1046/j.1365-2869.2002.00289.x. [DOI] [PubMed] [Google Scholar]
- 29.Yun CH, Jung KH, Chu K, et al. Increased circulating endothelial microparticles and carotid atherosclerosis in obstructive sleep apnea. J Clin Neurol. 2010;6:89–98. doi: 10.3988/jcn.2010.6.2.89. [DOI] [PMC free article] [PubMed] [Google Scholar]
- 30.Canessa N, Castronovo V, Cappa SF, et al. Obstructive sleep apnea: brain structural changes and neurocognitive function before and after treatment. Am J Respir Crit Care Med. 2011;183:1419–26. doi: 10.1164/rccm.201005-0693OC. [DOI] [PubMed] [Google Scholar]
- 31.Mayer P, Dematteis M, Pepin JL, et al. Peripheral neuropathy in sleep apnea. A tissue marker of the severity of nocturnal desaturation. Am J Respir Crit Care Med. 1999;159:213–9. doi: 10.1164/ajrccm.159.1.9709051. [DOI] [PubMed] [Google Scholar]
- 32.Eckert DJ, Lo YL, Saboisky JP, Jordan AS, White DP, Malhotra A. Sensorimotor function of the upper-airway muscles and respiratory sensory processing in untreated obstructive sleep apnea. J Appl Physiol. 2011;111:1644–53. doi: 10.1152/japplphysiol.00653.2011. [DOI] [PMC free article] [PubMed] [Google Scholar]
- 33.Picard C, Olivier A. Sensory cortical tongue representation in man. J neurosurg. 1983;59:781–9. doi: 10.3171/jns.1983.59.5.0781. [DOI] [PubMed] [Google Scholar]
- 34.Martin RE, MacIntosh BJ, Smith RC, et al. Cerebral areas processing swallowing and tongue movement are overlapping but distinct: a functional magnetic resonance imaging study. J Neurophysiol. 2004;92:2428–43. doi: 10.1152/jn.01144.2003. [DOI] [PubMed] [Google Scholar]
- 35.Boling W, Reutens DC, Olivier A. Functional topography of the low post-central area. J Neurosurg. 2002;97:388–95. doi: 10.3171/jns.2002.97.2.0388. [DOI] [PubMed] [Google Scholar]
- 36.Henderson LA, Macey KE, Macey PM, Woo MA, Yan-Go FL, Harper RM. Regional brain response patterns to Cheyne-Stokes breathing. Respir Physiol Neurobiol. 2006;150:87–93. doi: 10.1016/j.resp.2005.08.007. [DOI] [PubMed] [Google Scholar]
- 37.Cechetto DF, Chen SJ. Subcortical sites mediating sympathetic responses from insular cortex in rats. Am J Physiol. 1990;258:R245–55. doi: 10.1152/ajpregu.1990.258.1.R245. [DOI] [PubMed] [Google Scholar]
- 38.Henderson LA, Woo MA, Macey PM, et al. Neural responses during Valsalva maneuvers in obstructive sleep apnea syndrome. J Appl Physiol. 2003;94:1063–74. doi: 10.1152/japplphysiol.00702.2002. [DOI] [PubMed] [Google Scholar]
- 39.Harper RM, Macey PM, Henderson LA, et al. fMRI responses to cold pressor challenges in control and obstructive sleep apnea subjects. J Appl Physiol. 2003;94:1583–95. doi: 10.1152/japplphysiol.00881.2002. [DOI] [PubMed] [Google Scholar]
- 40.Somers VK, Dyken ME, Clary MP, Abboud FM. Sympathetic neural mechanisms in obstructive sleep apnea. J Clin Invest. 1995;96:1897–904. doi: 10.1172/JCI118235. [DOI] [PMC free article] [PubMed] [Google Scholar]
- 41.Brannan S, Liotti M, Egan G, et al. Neuroimaging of cerebral activations and deactivations associated with hypercapnia and hunger for air. Proc Natl Acad Sci U S A. 2001;98:2029–34. doi: 10.1073/pnas.98.4.2029. [DOI] [PMC free article] [PubMed] [Google Scholar]
- 42.Marin JM, Carrizo SJ, Vicente E, Agusti AG. Long-term cardiovascular outcomes in men with obstructive sleep apnoea-hypopnoea with or without treatment with continuous positive airway pressure: an observational study. Lancet. 2005;365:1046–53. doi: 10.1016/S0140-6736(05)71141-7. [DOI] [PubMed] [Google Scholar]
- 43.Poldrack RA. Inferring mental states from neuroimaging data: from reverse inference to large-scale decoding. Neuron. 2011;72:692–7. doi: 10.1016/j.neuron.2011.11.001. [DOI] [PMC free article] [PubMed] [Google Scholar]
- 44.Yaouhi K, Bertran F, Clochon P, et al. A combined neuropsychological and brain imaging study of obstructive sleep apnea. J Sleep Res. 2009;18:36–48. doi: 10.1111/j.1365-2869.2008.00705.x. [DOI] [PubMed] [Google Scholar]
- 45.Joo EY, Tae WS, Han SJ, Cho JW, Hong SB. Reduced cerebral blood flow during wakefulness in obstructive sleep apnea-hypopnea syndrome. Sleep. 2007;30:1515–20. doi: 10.1093/sleep/30.11.1515. [DOI] [PMC free article] [PubMed] [Google Scholar]
- 46.Gardini S, Cornoldi C, De Beni R, Venneri A. Left mediotemporal structures mediate the retrieval of episodic autobiographical mental images. Neuroimage. 2006;30:645–55. doi: 10.1016/j.neuroimage.2005.10.012. [DOI] [PubMed] [Google Scholar]
- 47.Bedard MA, Montplaisir J, Richer F, Rouleau I, Malo J. Obstructive sleep apnea syndrome: pathogenesis of neuropsychological deficits. J Clin Exp Neuropsychol. 1991;13:950–64. doi: 10.1080/01688639108405110. [DOI] [PubMed] [Google Scholar]
- 48.Row BW, Liu R, Xu W, Kheirandish L, Gozal D. Intermittent hypoxia is associated with oxidative stress and spatial learning deficits in the rat. Am J Respir Crit Care Med. 2003;167:1548–53. doi: 10.1164/rccm.200209-1050OC. [DOI] [PubMed] [Google Scholar]
- 49.Gozal D, Daniel JM, Dohanich GP. Behavioral and anatomical correlates of chronic episodic hypoxia during sleep in the rat. J Neurosci. 2001;21:2442–50. doi: 10.1523/JNEUROSCI.21-07-02442.2001. [DOI] [PMC free article] [PubMed] [Google Scholar]
- 50.Saunamaki T, Jehkonen M. Depression and anxiety in obstructive sleep apnea syndrome: a review. Acta Neurol Scand. 2007;116:277–88. doi: 10.1111/j.1600-0404.2007.00901.x. [DOI] [PubMed] [Google Scholar]
- 51.Cross RL, Kumar R, Macey PM, et al. Neural alterations and depressive symptoms in obstructive sleep apnea patients. Sleep. 2008;31:1103–9. [PMC free article] [PubMed] [Google Scholar]
- 52.Schneider F, Gur RE, Mozley LH, Smith RJ, Mozley PD, Censits DM, et al. Mood effects on limbic blood flow correlate with emotional self-rating: a PET study with oxygen-15 labeled water. Psychiatry Res. 1995;61:265–83. doi: 10.1016/0925-4927(95)02678-q. [DOI] [PubMed] [Google Scholar]
- 53.Drevets WC, Price JL, Simpson JR, Jr, et al. Subgenual prefrontal cortex abnormalities in mood disorders. Nature. 1997;386:824–7. doi: 10.1038/386824a0. [DOI] [PubMed] [Google Scholar]
- 54.Ashburner J, Friston KJ. Voxel-based morphometry—the methods. neuroimage. 2000;11:805–21. doi: 10.1006/nimg.2000.0582. [DOI] [PubMed] [Google Scholar]
- 55.Morrell MJ, Jackson ML, Twigg GL, et al. Changes in brain morphology in patients with obstructive sleep apnoea. Thorax. 2010;65:908–14. doi: 10.1136/thx.2009.126730. [DOI] [PubMed] [Google Scholar]
- 56.Good CD, Johnsrude IS, Ashburner J, Henson RN, Friston KJ, Frack-owiak RS. A voxel-based morphometric study of ageing in 465 normal adult human brains. Neuroimage. 2001;14:21–36. doi: 10.1006/nimg.2001.0786. [DOI] [PubMed] [Google Scholar]
- 57.Lin JJ, Salamon N, Lee AD, et al. Reduced neocortical thickness and complexity mapped in mesial temporal lobe epilepsy with hippocampal sclerosis. Cereb Cortex. 2007;17:2007–18. doi: 10.1093/cercor/bhl109. [DOI] [PubMed] [Google Scholar]
- 58.Cervos-Navarro J, Diemer NH. Selective vulnerability in brain hypoxia. Crit Rev Neurobiol. 1991;6:149–82. [PubMed] [Google Scholar]
- 59.Bålfors EM, Franklin KA. Impairment of cerebral perfusion during ob-structive sleep apneas. Am J Respir Crit Care Med. 1994;150:1587–91. doi: 10.1164/ajrccm.150.6.7952619. [DOI] [PubMed] [Google Scholar]
- 60.Fischer AQ, Chaudhary BA, Taormina MA, Akhtar B. Intracranial hemo-dynamics in sleep apnea. Chest. 1992;102:1402–6. doi: 10.1378/chest.102.5.1402. [DOI] [PubMed] [Google Scholar]
- 61.Placidi F, Diomedi M, Cupini LM, Bernardi G, Silvestrini M. Impairment of daytime cerebrovascular reactivity in patients with obstructive sleep apnoea syndrome. J Sleep Res. 1998;7:288–92. doi: 10.1046/j.1365-2869.1998.00120.x. [DOI] [PubMed] [Google Scholar]