Abstract
Objectives:
To assess the usefulness of actigraphy for assessment of nighttime sleep measures in patients with Parkinson's disease (PD).
Design:
Participants underwent overnight sleep assessment simultaneously by polysomnography (PSG) and actigraphy.
Setting:
Overnight sleep study in academic sleep research laboratory.
Participants:
Sixty-one patients (mean age 67.74 ± 8.88 y) with mild to moderate PD.
Measurements:
Sleep measures including total sleep time (TST), sleep efficiency (SE), wake after sleep onset (WASO), and sleep onset latency (SOL) were calculated independently from data derived from PSG and from actigraphy. Different actigraphy scoring settings were compared.
Results:
No single tested actigraphy scoring setting was optimal for all sleep measures. A customized setting of an activity threshold of 10, with five consecutive immobile minutes for sleep onset, yielded the combination of mean TST, SE, and WASO values that best approximated mean values determined by PSG with differences of 6.05 ± 85.67 min for TST, 1.1 ± 0.641% for SE, and 4.35 ± 59.56 min for WASO. There were significant but moderate correlations between actigraphy and PSG measurements (rs = 0.496, P < 0.001 for TST, rs = 0.384, P = 0.002 for SE, and rs = 0.400, P = 0.001 for WASO) using these settings. Greater disease stage was associated with greater differences between TST (R2 = 0.099, beta = 0.315, P = 0.018), SE (R2 = 0.107, beta = 0.327, P = 0.014), and WASO (R2 = 0.094, beta = 0.307, P = 0.021) values derived by actigraphy and PSG explaining some of the variability. Using a setting of 10 immobile min for sleep onset yielded a mean SOL that was within 1 min of that estimated by PSG. However SOL values determined by actigraphy and PSG were not significantly correlated at any tested setting.
Conclusions:
Our results suggest that actigraphy may be useful for measurement of mean TST, SE, and WASO values in groups of patients with mild to moderate Parkinson's disease. However, there is a significant degree of variability in accuracy among individual patients. The importance of determining optimal scoring parameters for each population studied is underscored.
Citation:
Maglione JE; Liu L; Neikrug AB; Poon T; Natarajan L; Calderon J; Avanzino JA; Corey-Bloom J; Palmer BW; Loredo JS; Ancoli-Israel S. Actigraphy for the assessment of sleep measures in Parkinson's disease. SLEEP 2013;36(8):1209-1217.
Keywords: Actigraphy, Parkinson's disease, sleep, sleep efficiency, total sleep time
INTRODUCTION
Parkinson's disease (PD), a common neurodegenerative disorder affecting approximately one million people in the United States and five million worldwide,1 is usually characterized by motor symptoms including bradykinesia, rigidity, tremor, and postural instability.2 Nonmotor symptoms also tend to be prominent and are a major source of disability in this population.3,4 Poor sleep is among the most common of these nonmotor symptoms, with a prevalence of 40-90% 3,5,6 and has been shown to substantially affect quality of life.7 Studies investigating sleep and sleep disruptions in this population are therefore critical for the development of treatment strategies to improve quality of life in patients with PD.
Wrist actigraphy has become a widely used assessment tool in sleep research settings and is increasingly used in clinical settings.8,9 An actigraph is a small device worn on the wrist that monitors and records wrist movements over time. Computerized scoring algorithms are used to estimate information about sleep parameters from the activity data. Compared with the gold standard overnight polysomnography (PSG) study for the assessment of sleep, actigraphy offers several advantages that have made it appealing to sleep investigators and clinicians.8 It is less expensive than PSG and therefore more feasible for use over extended periods of time (i.e. days to weeks), thereby allowing for the collection of information about day-to-day variability in sleep patterns. Further, actigraphs are typically used at home and therefore provide objective information about sleep and wake patterns in the patient's natural sleep environment. Actigraphy has been well validated for the estimation of nighttime sleep parameters in healthy populations of adults and children.9–12 However, concerns about validity have been raised in other specific patient populations.13–15
Actigraphy could represent an important and useful tool to study sleep in PD. In fact, actigraphy has already been used to compare sleep parameters in different subgroups of patients with PD16 and to assess the effects of medications, interventions, and other variables on sleep in PD.17–19 However, no systematic study has yet been done to assess how well actigraphy measures sleep in this specific population. Our goal, therefore, was to test how well actigraphy measures nighttime sleep parameters in PD compared with PSG.
METHODS
Participants
As part of a larger study on sleep apnea in PD, participants with a diagnosis of idiopathic PD were recruited through the Department of Neurosciences at University of California, San Diego (UCSD), the San Diego Parkinson's Disease Association, community neurologists, and talks given to PD support groups. Prospective participants were screened by telephone. For those meeting inclusion criteria, a meeting was arranged during which the study was described and signed informed consent obtained. Exclusion criteria were clinically atypical PD, presence of any neurodegenerative disorder other than PD, unmanaged cerebrovascular or coronary illnesses, epilepsy, cardiomyopathy, current treatment for sleep apnea, current alcohol or drug abuse, use of antipsychotic medications, or any behavioral or physical problem (e.g., active psychosis, incontinence) that would have compromised patient participation. Participants were also required to have been stable on the same medications at the same doses for at least 2 months prior to participation in the study. Evaluation by a neurologist included the Hoehn and Yahr rating scale (H&Y) to evaluate PD disease severity, the Mini Mental State Examination (MMSE) to evaluate cognitive status, the REM Behavior Sleep Disorder (RBD) Screening Questionnaire (RBDSQ) to evaluate for symptoms of RBD, and a questionnaire to evaluate for clinical signs of restless legs syndrome (RLS). Evaluation by another physician included review of medications and sleep history. Participants also filled out questionnaires about their subjective sleep quality (Pittsburgh Sleep Quality Index, PSQI) and mood (Beck Depression Inventory, BDI). The protocol was approved by the UCSD Institutional Review Board and all participants gave written informed consent prior to participation in the study.
A flow chart depicting the recruitment and inclusion of participants in this study is provided in Figure 1. Overall, 138 potential participants underwent an initial phone screening. Of these, 91 met inclusion criteria and of these, 82 participants gave consent and underwent an overnight PSG sleep study. Three patients did not have usable PSG data because of equipment malfunction (two patients) or because the patient decided to leave the study before falling asleep (one patient). Eighteen participants did not have usable actigraphy data either because they underwent their PSG screening prior to the addition of the actigraphy component of the protocol (16 patients) or because the actigraph was not correctly set to record in 30-sec epochs (two patients). The analyses presented here are focused on the subgroup of 61 participants who had usable data from both PSG and actigraphy.
Figure 1.
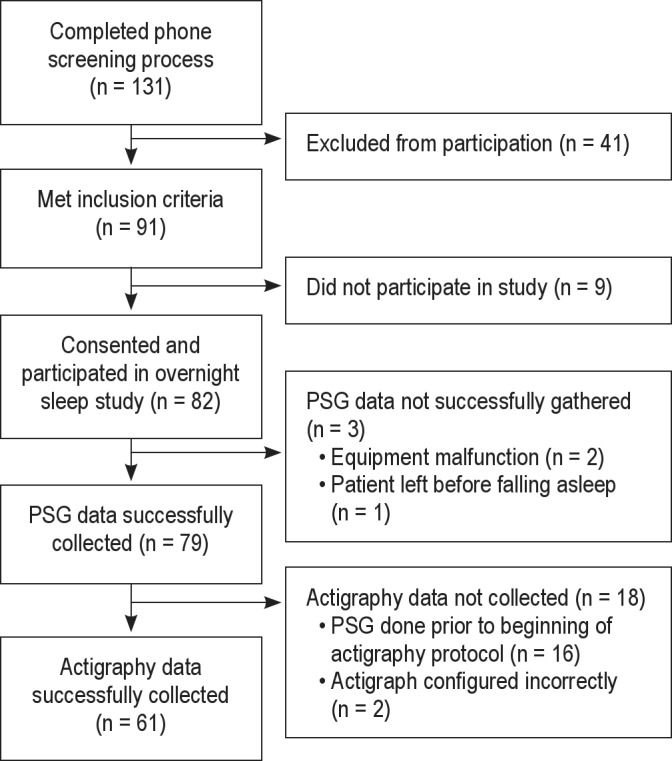
Consort table showing recruitment and inclusion of participants.
The mean age of the sample was 67.4 ± 9.26 y. Most participants (96.7%) were Caucasian and 63.3% of the sample was male. The mean H&Y disease stage was 1.91 ± 0.66. On average, the sample reported poor sleep quality with a mean PSQI score of 7.64 ± 4.37. In 55% of patients obstructive sleep apnea (OSA) was diagnosed, defined by an apnea hypopnea index ≥ 10, whereas 18.3% endorsed symptoms consistent with RLS and 53.3% endorsed symptoms consistent with RBD. The average MMSE score was 28.1 ± 1.9. A minority of patients took antidepressants (23.2%) or benzodiazepines (10%).
Polysomnography
Sleep was recorded with the video-enabled Somtè system (Compumedics, Melbourne, Victoria, Australia). PSG montage included three electroencephalogram channels (F4-A1, C4-A1, O1-A2), left and right electrooculograms, chin and bilateral tibialis anterior electromyograms, II-lead electrocardiogram, nasal pressure transducer, thoracic and abdominal respiratory effort, tracheal microphone, pulse oximeter, and body-position sensor. PSG was scored according to the American Academy of Sleep Medicine (AASM) criteria.20 Lights-off and lights-on times were recorded by a sleep technician. The following sleep variables were derived from data gathered through PSG recordings: time in bed (min between lights on and lights off), total sleep time (TST; min of sleep between sleep onset and wake time), wake after sleep onset (WASO; min awake between sleep onset and wake time), sleep efficiency (SE; percentage of time asleep while in bed from lights off to lights on), and sleep onset latency (SOL; min between lights off and first sleep episode).
Actigraphy
Participants wore an actigraph (Actiwatch-L; Philips Respironics Andover, Ma) on the nondominant wrist while undergoing overnight PSG screening. Actigraphs were configured to record in 30-sec epochs to match the length of the PSG scoring epochs using the same computer used for the PSG recordings so that recording times matched. Sleep measures described previously, including TST, SE, WASO, and SOL, were then estimated from actigraphy data using Actiware 5.0 software (Philips Respironics Andover, Ma). The lights-off and lights-on times recorded by the sleep technician (i.e., the same times used in calculating PSG sleep variables) were used in actigraphy scoring to define the start and end of the rest interval.
Actiware 5.0 software scores each epoch as either sleep or wake by comparing activity counts for that epoch and those surrounding it for 2 min in either direction to a threshold set by the user. A threshold of 20 is the program's normal default setting for low, 40 is considered to be medium, and 80 is the normal default setting for high. If the number of counts exceeds the threshold, the epoch is scored as wake, whereas if the number of counts is equal to or below the threshold the epoch is scored as sleep. A range of activity thresholds (0, 5, 10, 20, 40, 60, 80) were tested in this study to determine which yielded the best estimates of TST, SE, and WASO. The criteria used by the Actiware 5.0 software to define sleep onset and end can also be tailored by the user through definition of the number of immobile min required to detect sleep onset and mobile min required for sleep end. The default settings for the program require it to find 10 consecutive immobile min where there is at least some activity (but less than 1 min) to define sleep onset and 10 consecutive min of activity to define sleep end. Three different settings for the number of immobile min required for sleep onset and end (0 min, 5 min, 10 min) were tested in this study to assess which yielded the best estimates of SOL in this population.
To determine how well the actigraphy scorer was able to estimate the appropriate beginnings and endings of the rest intervals, two independent and trained actigraphy scorers examined the activity data carefully and recorded the times that they would have estimated to be the time into bed and the time out of bed. The scorers were aware of the approximate windows for lights-off and lights-on times employed routinely as part of the overnight sleep study protocol. Focusing on these windows, the data were inspected for changes in activity level (e.g., a transition from active to a sustained period of little or no activity in the typical lights-off time window). Although changes in activity level were considered the primary indicator for time in bed and time out of bed, light data were also inspected for corresponding changes in intensity levels. The estimated in bed and out of bed times were compared with the corresponding lightsoff and lights-on times recorded by the PSG sleep technician.
Analysis
Spearman rank-order correlations were calculated for each sleep measure between values determined by actigraphy at each setting tested and the value determined by PSG. Approximate t-tests based on the asymptotic distribution of the rank correlation statistic were used to determine the significance of the correlations. Mean sleep measure values were also determined for the actigraphic sleep measure estimates obtained using each setting tested and for sleep measures obtained by PSG. Differences in means were then calculated and means were compared using paired t-tests. Bland-Altman analysis was applied to assess the degree of agreement between the sleep measures assessed via actigraphy versus PSG.
RESULTS
Comparison of Means
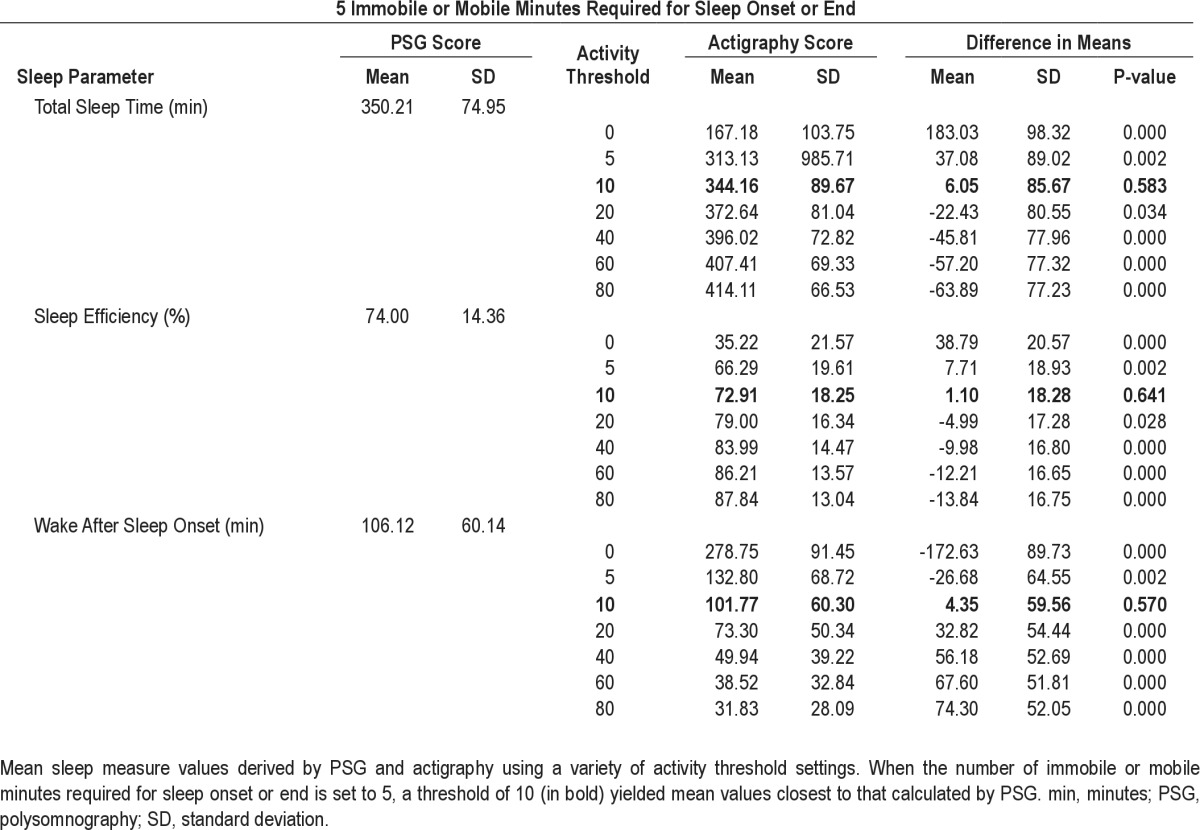
Mean (± standard deviation, SD) TST, SE, and WASO values for the sample estimated by actigraphy using 5 immobile min required for sleep onset and 5 mobile min required for sleep offset and different activity thresholds (0, 5, 10, 20, 40, 60, 80) compared with the mean TST, SE, and WASO values for the sample as assessed by PSG are shown in Table 1. For all three variables, using a low threshold of 10 yielded mean values that best approximated those calculated from PSG data. Specifically, using these settings, the TST estimated by actigraphy (344.2 ± 89.7 min) and PSG (350.2 ± 74.95 min) were not significantly different. Similarly, there were no significant differences in the mean SE estimated by actigraphy (72.9 ± 18.3%) and PSG (74.0 ± 14.4%) or the mean WASO estimated by actigraphy (101.8 ± 60.30 min) and PSG (106.1 ± 60.1 min). However, there was a notable degree of variability in the difference between means for each measure: TST (6.05 ± 85.67 min), SE (1.10 ± 18.28%), WASO (4.35 ± 59.56 min).
Table 1.
Comparison of sleep parameters assessed by polysomnography and actigraphy
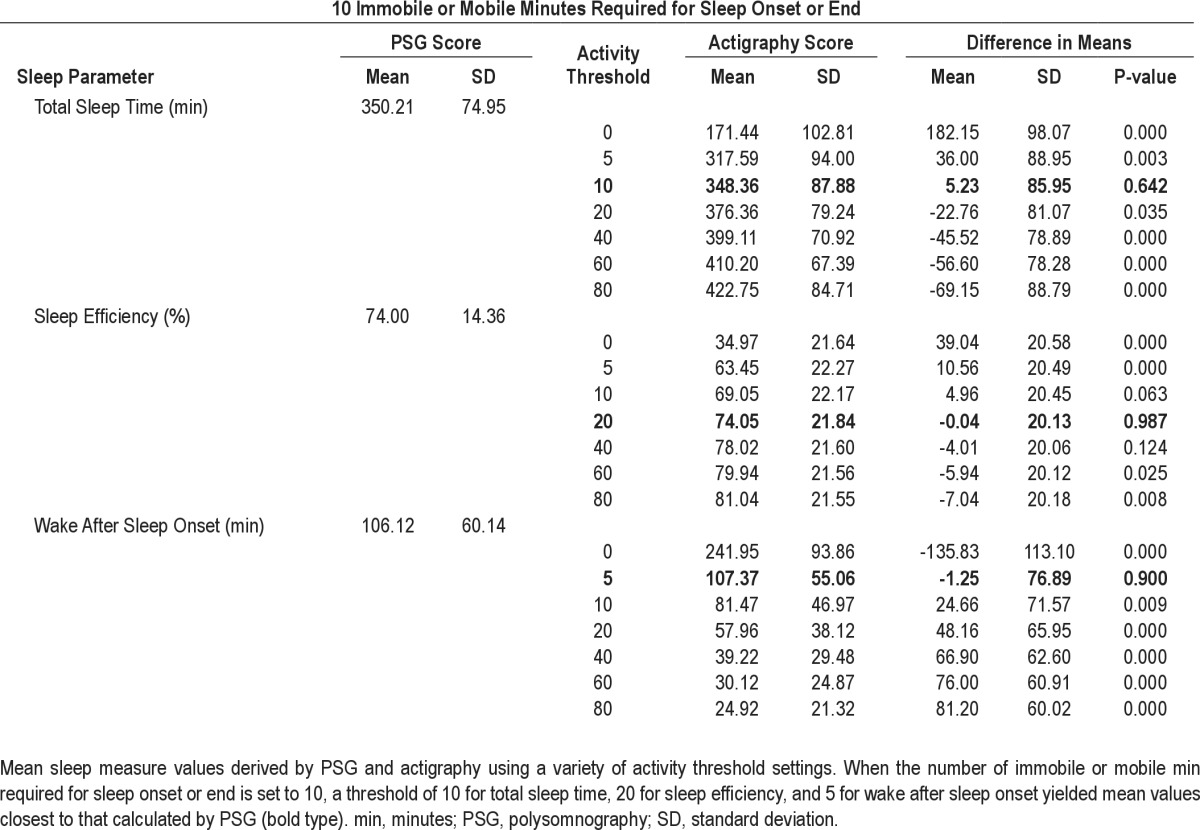
Mean TST, SE, and WASO values for the sample estimated by actigraphy using the factory default settings of 10 immobile or mobile min required for sleep onset or offset and different activity thresholds compared with the mean TST, SE, and WASO for the sample as assessed by PSG are shown in Table 2. The mean TST estimated by actigraphy (348.4 ± 87.9 min) at a threshold of 10 best approximated the mean estimated by PSG with a nonsignificant difference of less than 6 min. The mean SE estimated by actigraphy (74.0 ± 21.84) at a threshold of 20 best approximated the mean calculated from PSG data with a nonsignificant difference of less than 1%. The mean WASO value estimated by actigraphy (107.37 ± 55.06 min) at a threshold of five best approximated that estimated by PSG with a nonsignificant difference of less than 2 min. Again there was a notable degree of variability in the difference between means (Table 2).
Table 2.
Comparison of sleep parameters assessed by polysomnography and actigraphy
Spearman Correlations
Using 5 min immobility or mobility required for sleep onset or offset and the optimal activity threshold of 10, there were significant moderate correlations between TST, SE, and WASO values obtained by actigraphy and PSG (Figure 2). The correlation was strongest for TST (Spearman rho/rs = 0.496, P < 0.001) and slightly weaker for SE (rs = 0.383, P = 0.002) and WASO (rs = 0.400, P < 0.001). Using 10 min immobility or mobility required for sleep onset or end and optimal activity thresholds of 10 for TST and 20 for SE also yielded significant moderate correlations (rs = 0.473, P < 0.001 for TST and rs = 0.368, P = 0.004 for SE). In contrast, using 10 min immobility or mobility required for sleep onset or end, there were no significant correlations for WASO values estimated actigraphy and PSG at threshold tested.
Figure 2.
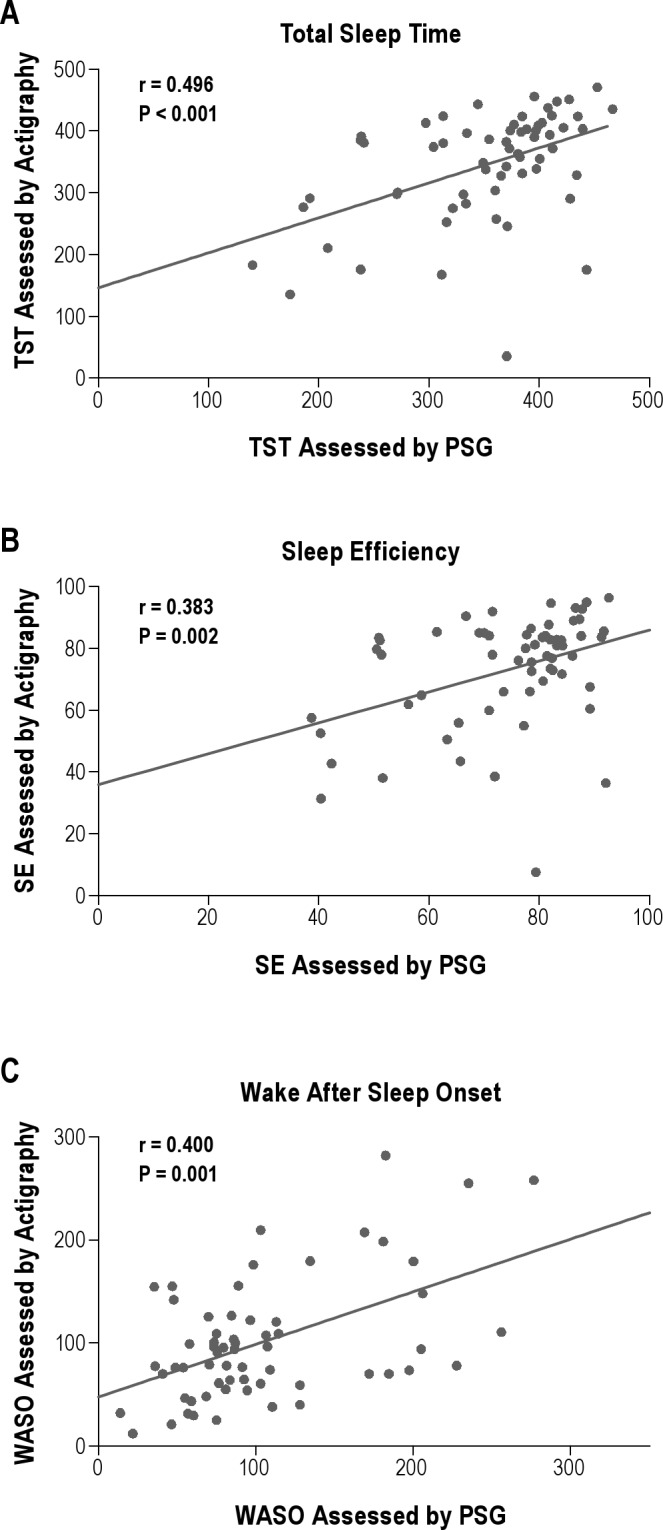
Spearman correlations comparing sleep measures estimated by polysomnography (PSG) with those estimated by actigraphy using the optimum settings of 5 immobile or mobile min required for sleep onset or end and activity threshold 10. SE, sleep efficiency; TST, total sleep time; WASO, wake after sleep onset
Bland-Altman Analysis
When 5 immobile or mobile min were required for sleep onset or end, and the optimal activity threshold of 10 was used, Bland-Altman analyses suggested that actigraphy tended to overestimate TST by 5.89 ± 84.98 min, overestimate SE by 1.07 ± 18.13%, and overestimate WASO by 3.58 ± 59.21 min compared with PSG (Figure 3). When 10 immobile or mobile min were required for sleep onset or end, using the optimal activity thresholds of 10 for TST, 20 for SE, and 5 for WASO overestimated TST by 23.66 ± 95.09 min, underestimated SE by -0.04 ± 19.97%, and underestimated WASO by 1.96 ± 76.47 min compared with PSG.
Figure 3.
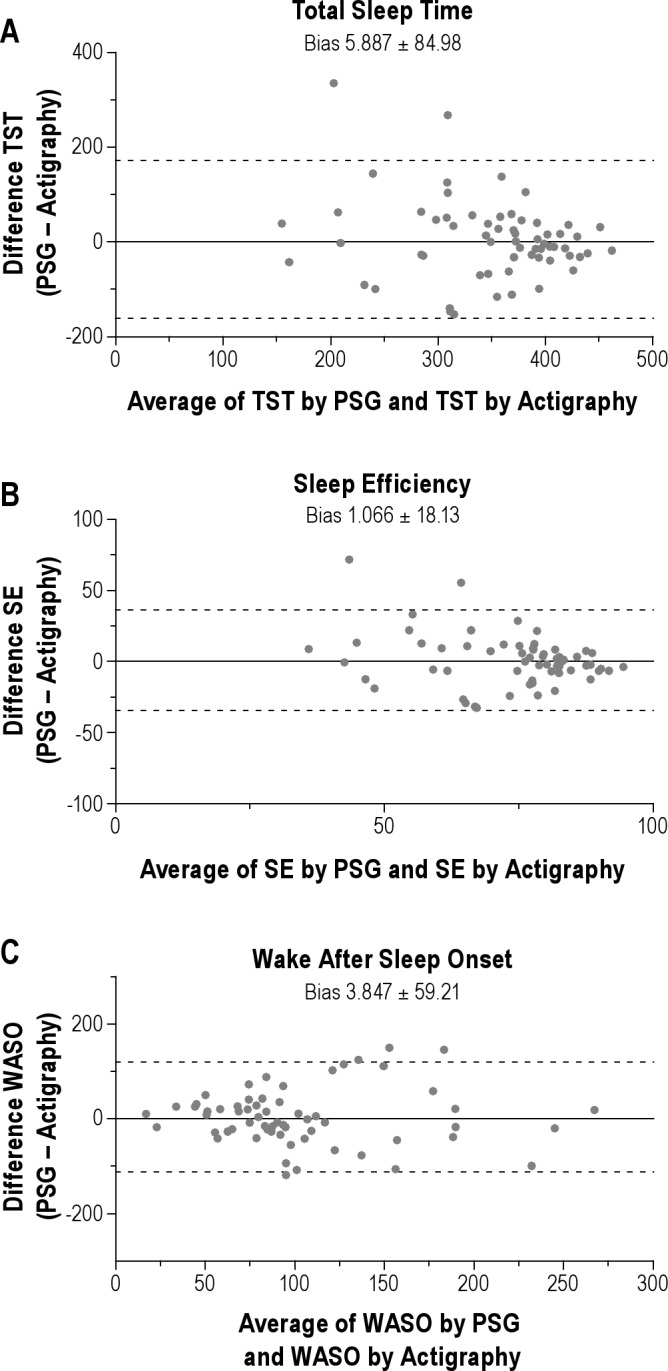
Bland-Altman plots comparing sleep measures estimated by PSG with those estimated by actigraphy using 5 immobile or mobile min required for sleep onset and activity threshold of 10. (A) Bland-Altman plot for TST showing that, on average, actigraphy overestimated TST by 5.9 min compared with PSG. (B) Bland-Altman plot for SE showing that, on average, actigraphy overestimated SE by 1.1% compared with PSG. (C) Bland-Altman plot for WASO showing that, on average, actigraphy overestimated WASO by 3.8 min compared with PSG. For each plot 95% confidence intervals are indicated with dotted lines. PSG, polysomnography; SE, sleep efficiency; TST, total sleep time; WASO, wake after sleep onset.
Factors Affecting Variability
The frequency of falling into various categories of agreement between sleep measure values derived by actigraphy and PSG are shown in Figure 4. For TST, five individuals (8.2%) had differences of less than 10 min; 23 (37.7%) had differences of less than 30 min, and 40 (65.6%) had differences of less than 60 min, whereas 21 (34.4%) had differences of 60 min or greater. For SE, 16 (26.2%) had differences of less than 5%, 35 (57.4%) had differences of less than 10%, and 44 (72.1%) had differences of less than 15% whereas 17 (27.9%) had differences greater than 15%. For WASO, 35 individuals (57.4%) had differences of less than 10 min, 56 (91.8%) had differences of less than 30 min, and five (8.3%) had differences of greater than 30 min.
Figure 4.
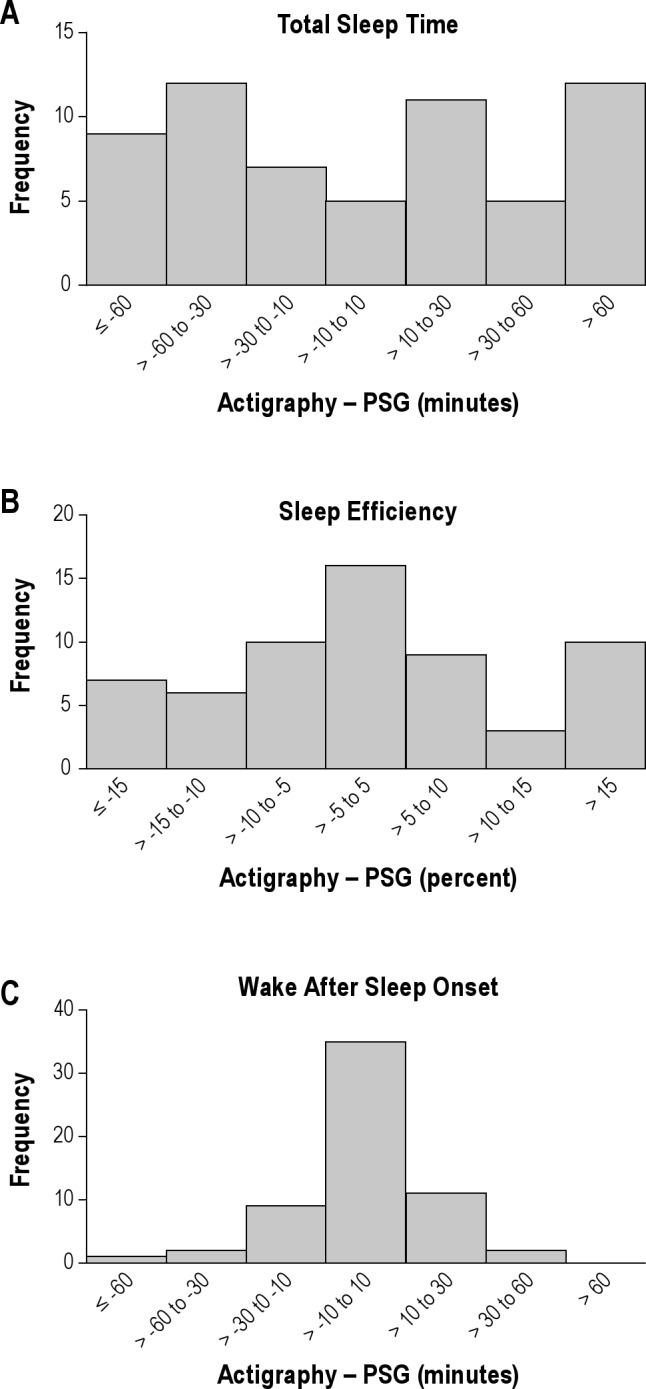
Frequency distribution bar charts for the difference between sleep measures derived by actigraphy and PSG for TST (A), SE (B), and WASO (C). For each measure frequency of falling into different categories according to the magnitude of the difference between values derived from actigraphy and PSG are shown. PSG, polysomnography; SE, sleep efficiency; TST, total sleep time; WASO, wake after sleep onset.
Linear regression analyses were performed to examine associations between other variables and the magnitude of the difference between values derived by actigraphy and PSG. A significant association was found between higher H&Y score (i.e., more advanced disease) and greater differences in TST (R2 = 0.099, beta = 0.315, P = 0.018), SE (R2 = 0.107, beta = 0.327, P = 0.014) and WASO (R2 = 0.094, beta = 0.307, P = 0.021) values derived by actigraphy compared with PSG. There was also an association between decreased SE (R2 = 0.410, beta = -0.410, P = 0.001), and decreased TST (R2 = 0.390, beta = -0.390, P = 0.002) and greater differences in WASO measurements derived by actigraphy and PSG. No significant associations were found between differences in TST, SE, and WASO measurements by actigraphy and PSG and age or sex.
Secondary Analysis
A secondary analysis was performed limiting the sample to those with H&Y scores < 2 (n = 14). Mean (± SD) TST, SE, and WASO values for this smaller sample estimated by actigraphy using 5 and 10 immobile min required for sleep onset and both 5 and 10 mobile min required for sleep offset and different activity thresholds (0, 5, 10, 20, 40, 60, 80) compared with the mean TST, SE, and WASO values for the sample as assessed by PSG. For all three variables, using 5 immobile min required for sleep onset and 5 mobile min required for sleep offset and a low threshold of 10 yielded mean values that best approximated those calculated from PSG data. Specifically, using these settings, the mean differences between sleep measures estimated by actigraphy and PSG continued to be small and not significantly different with somewhat less variability: TST (-0.46 ± 39.1 min, P = 0.965), SE (-0.22% ± 8.23%, P = 0.923), WASO (-1.00 ± 25.46 min, P = 0.885). Using these settings in this subgroup of participants, correlations between measurements derived by actigraphy and PSG were stronger: TST (rs = 0.616, P < 0.019), SE (rs = 0.648, P = 0.012) and WASO (rs = 0.635, P < 0.015).
Sleep Onset Latency
Mean SOL values for the sample estimated by actigraphy using different scoring parameters (number of immobile or mobile min required for sleep onset or end 0, 5, or 10) compared with the mean SOL for the sample as assessed by PSG is shown in Table 3. Estimation of SOL by actigraphy using the setting of 10 immobile or mobile min required for sleep onset or end yielded a mean value for the sample (13.80 ± 28.90 min) that was closest to and not significantly different from (P = 0.854) that calculated from SOL values assessed by PSG (14.45 ± 19.24 min). Estimation of SOL by actigraphy using the setting of 5 immobile or mobile min required for sleep onset or end yielded a mean value for the sample (9.70 ± 28.90 min) that was not as close but still not significantly different (P = 0.37) from that calculated from SOL values assessed by PSG. However, there was no significant correlation between SOL values obtained by actigraphy and PSG at any setting.
Table 3.
Comparison of sleep onset latency assessed polysomnography and actigraphy

Estimation of Times In and Out of Bed
To test how well the time in bed and time out of bed could be estimated from activity data in this population, two actigraphy scorers estimated times in and out of bed for each participant based on changes in activity patterns and knowledge of the study protocol (i.e., usual approximate bed and wake times). Times estimated by the two independent actigraphy scorers were highly concordant (rs 0.987 for lights-off and 0.918 for lights on, P < 0.0001). These values were then compared with the lights-off and lights-on times documented by the PSG technician. As shown in Figure 5, there was a significant strong correlation between time in bed estimated by actigraphy and the lights-off time (rs for scorers = 0.821 and 0.823, P < 0.0001). Furthermore, the mean (absolute value) differences between times were small (0.11 ± 0.27 min and 0.12 ± 0.28 min for scorers). There was a moderate significant correlation between time out of bed estimated by actigraphy and the lights-on time (rs for scorers = 0.690 and 0.666, P < 0.0001) with similar mean (absolute value) differences between times (0.12 ± 0.28 min and 0.08 ± 0.20 min for scorers).
Figure 5.
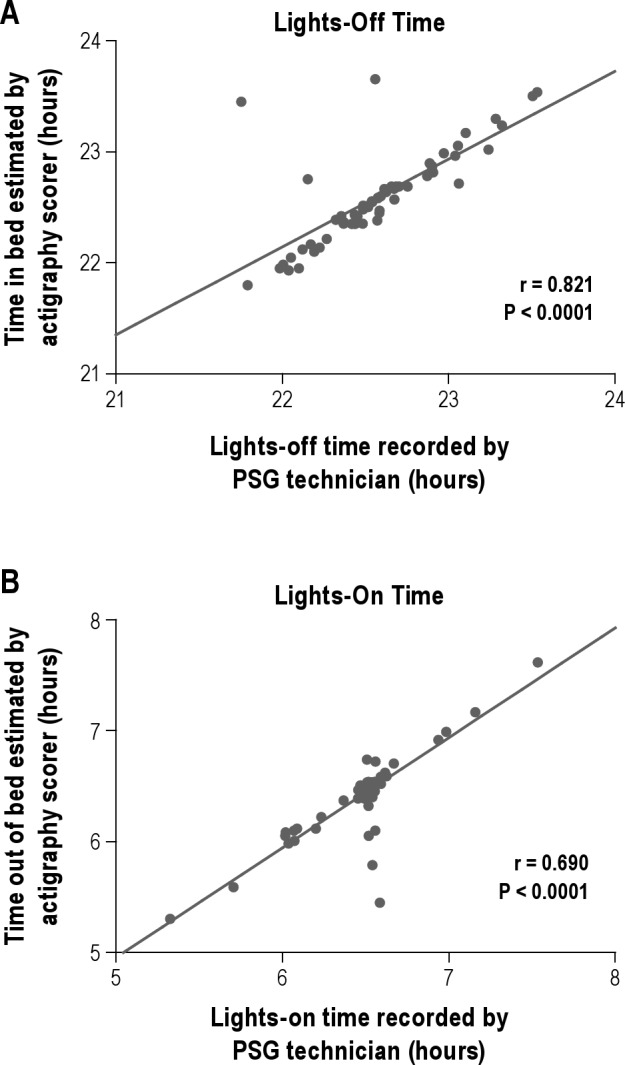
Correlations between beginning and end of sleep interval recorded by PSG technician and those estimated by review of actigraphy data. (A) Spearman correlation comparing lights-off times recorded by polysomnography (PSG) sleep technician with times in bed estimated by the actigraphy scorer by assessment of activity patterns. (B) Spearman correlation comparing lights-on times recorded by PSG sleep technician with times out of bed estimated by the actigraphy scorer by assessment of activity patterns. Graphs depict one scorer's data.
Effect of Tremor Hand
Most of the time, the tremor occurring in PD is asymmetrical and therefore affects one arm more than the other arm. In this study, actigraphs were placed on the nondominant wrist by convention. Twenty-four participants reported that their tremor was more prominent on the nondominant wrist (i.e., with the actigraph), whereas the remaining participants reported their tremor to be more prominent on the opposite side. To test the effect of actigraph placement with respect to asymmetric tremor location on the estimation of sleep measures, differences in TST, SE, WASO, or SOL determined by PSG and actigraphy were computed for each participant. Mean differences for participants wearing actigraphs on their tremor-prominent hand and those wearing actigraphs on the opposite hand were compared using an independent samples t-test. There was no statistically significantly difference (data not shown).
DISCUSSION
The data presented here suggest that for participants with mild to moderate PD, actigraphy may be a useful tool for assessment of group mean values for TST, SE, and WASO if appropriate scoring parameters are used. Specifically, using optimal scoring parameters, actigraphy was able to estimate mean TST and WASO values within approximately 6 min of the values derived by PSG, and mean SE values within 2% of the mean derived by PSG. In contrast, when the optimal scoring parameters were not used, actigraphy did a poor job of assessing sleep measures. Hence, these data add to a body of literature underscoring the importance of using the optimal scoring parameters for actigraphic assessment of nighttime sleep measures. 9,21,22 Further, at least for the measurement of nighttime sleep measures in PD, our data suggest that placement of the actigraph on either hand with respect to the asymmetrical tremor location yields similar results.
The optimal scoring settings to be used depend on multiple factors including the sleep measure of interest to the investigator or clinician, the device being used, and the population being assessed. In our primary analysis, the optimal setting for measuring each sleep parameter was different. The importance of obtaining the most accurate value for each parameter must therefore be weighed against how practical it is for the user to score data in multiple ways. If a single scoring setting is desired for assessment of TST, SE, and WASO in PD using the Actiwatch-L and Actiware 5.0 system (Philips Respironics Andover, Ma), our data suggest that the best combination of results can be achieved by using the low activity threshold of 10 with the number of immobile and mobile min to detect sleep onset or wake set to 5 min. Although optimal scoring parameters may differ between specific brands and devices, our data suggest that a low activity threshold is preferable for assessment of sleep parameters in PD and can be used as a guide for others seeking to determine optimal scoring parameters for other devices.
It is notable that, in this study, a scoring threshold of 10 worked better for estimation of TST, SE, and WASO than any of the three manufacturer-set default settings (low: 20; medium: 40; high: 80). One possible reason for this finding is related to the specific population studied. The three default scoring thresholds were chosen by the company based on a validation study in a sample of 100 patients with sleep complaints from a sleep disorders clinic.23 It is important, therefore, to remember that the manufacturer's default scoring parameters may not provide the best data and consideration should be given to testing other settings when using actiraphy in special patient populations.
Although actigraphy was able to produce group mean values for TST, SE, and WASO that were similar to those derived by PSG, there was a considerable degree of variability in accuracy between individuals as evidenced by the degree of scatter depicted on the correlation plots (Figure 2) and the significant fraction of participants with relatively large differences between actigraphy and PSG values for each measure (Figure 4). Caution should therefore be used when considering using actigraphy to assess measures of sleep on an individual basis. Secondary analyses suggested that some (approximately 10%) of that variability was related to increasing disease stage. It is notable that when the sample was restricted to those with more mild stages of disease (H&Y 0-1), actigraphy and PSG scores were better correlated although a significant degree of variability remained. A higher proportion of the variability for WASO (approximately 40%) was related to shorter TST and/or decreased SE. This result is consistent with previously published studies which suggest that, in general, actigraphy tends to be less accurate for people with decreased sleep quality in whom quiet wakefulness may be scored as sleep.24
It is also notable that this study was done over a period of 1 night in a sleep laboratory. Therefore, the so-called first night effect, a phenomenon whereby some participants may spend an increased fraction of their first night in a sleep laboratory in quiet wakefulness, could be relevant as actigraphy may misinterpret quiet wakefulness for sleep. Studies comparing actigraphy to PSG in this population conducted over longer periods of time and studies conducted in the home environment would be useful to determine if actigraphy performs better under those conditions.
Although PSG is generally considered to be the gold standard method for assessment of sleep measures, use of actigraphy for assessment of sleep measures in PD has several important advantages that may make it both more feasible and useful. The burden to the patient is minimal with actigraphy. This is a particularly important consideration for populations with medical illnesses such as PD, which may already cause a significant amount of disability and fatigue and where the benefits of an intervention or test must be carefully weighed against the added burden to the affected individual. Additionally, actigraphy typically provides an evaluation of sleep over a longer period of time (e.g., 7 days) compared with PSG (typically overnight or 24 h), which provides a better picture of an individual's overall sleep (particularly if there is night-to-night variability), and eliminates concerns about the first-night effect (the effect of sleeping in the unfamiliar environment of the sleep laboratory) associated with PSG.8 From a practical standpoint, the cost of actigraphy is low compared with PSG, a factor that is of great importance both in the clinical and research setting.
The literature regarding the validity of actigraphy for assessment of SOL has been mixed.8,9 Although we were able to obtain mean values for SOL that were within 1 min of those obtained by PSG using a setting of 10 immobile min required for sleep onset, there were no significant correlations between SOL values for participants assessed by actigraphy and those derived by PSG at any setting tested. Estimation of SOL is dependent both on accurate assessment of time in bed (or beginning of the rest interval) and accurate detection of the wake/sleep transition. In this study, we used the lights-off time recorded by the PSG technician as the start of the rest interval, eliminating the start time as the reason for the lack of correlation between SOL values determined by actigraphy and PSG. This suggests that the main limitation was in the ability of actigraphy to accurately detect the transition between wake and sleep in this population using the device and settings tested. Hence, for investigators and clinicians interested in obtaining accurate and reliable measurements of SOL in this population, PSG remains the optimal approach.
Measurement of TST and WASO by actigraphy relies on accurate assessment of the beginning and end of the rest interval. In our study, these were determined based on the times recorded by the PSG technician. However, when actigraphs are used for home sleep assessments, estimates for the beginnings and ends of rest intervals (i.e., times in and out of bed) must be made during scoring using a combination of information gathered from the individual being assessed (for example, by completion of a sleep diary) and careful inspection of the activity patterns by the scorer. In our study, two independent experienced scorers' estimates of these times correlated highly with the actual lights-off and lights-on times recorded by PSG technicians, suggesting that in this population it would be feasible to gather adequately the necessary information about the beginnings and endings of rest intervals required to calculate these sleep variables.
This is, to our knowledge, the only study specifically comparing actigraphy with PSG for assessment of sleep parameters in PD; therefore, our results need to be validated in an independent cohort. One strength of this study was in the comparison of actigraphic assessment of sleep variables with the gold standard method of assessment by PSG. The study has several limitations. For example, the sample was relatively modest in size and consisted entirely of individuals older than 50 y, most of whom were Caucasian. Our sample included only patients with mild to moderate PD. Although actigraphy is often used in the home setting over a period of days, we studied patients for 1 night in a sleep laboratory environment. A study comparing the measurement of sleep parameters by actigraphy and PSG done in patient's homes over a longer period of time may provide a more accurate view of how these two modalities compare in that setting. In addition, only one type of actigraph and scoring software was used and so we cannot make any conclusions about the specific optimal settings to be used with different types of devices and scoring software packages.
In summary, the results of this study suggest that actigraphy may be a useful tool for measurement of mean values for TST, SE, and WASO in groups of patients with mild to moderate PD. This study also underscores the importance of determining the optimal scoring parameters to be used for different model actigraphs in different populations. Larger studies, designed to better detect additional factors contributing to variability in the ability of actigraphy to accurately assess sleep measures in patients with PD, as well as studies comparing actigraphy with PSG over longer recording periods and in the home environment would provide additional useful additional information.
DISCLOSURE STATEMENT
This was not an industry-supported study. Dr. Ancoli-Israel has been a consultant or on the advisory board of Ferring Pharmaceuticals, GlaxoSmithKline, Merck, Neurocrine Biosciences, Pfizer, Respironics/Philips, Sanofi-Aventis, and Somaxon, and had a grant from Litebook, Inc. The other authors have indicated no financial conflicts of interest.
ACKNOWLEDGMENTS
Supported for this study provided by NIA AG08415, NIH UL1RR031980, UCSD Stein Institute for Research on Aging, and Department of Veterans Affairs Center of Excellence for Stress and Mental Health (CESAMH). Dr. Maglione is supported by T32 MH019934-18 Fellowship in Geriatric Mental Health.
REFERENCES
- 1.Chen JJ. Parkinson's disease: health-related quality of life, economic cost, and implications of early treatment. Am J Manag Care. 2010;16:S87–93. [PubMed] [Google Scholar]
- 2.Trenkwalder C. Parkinsonism. In: Kryger M, Roth T, Dement WC, editors. Principals and practice of sleep medicine. Philadelphia: Elsevier Saunders; 2005. pp. 801–10. [Google Scholar]
- 3.Barone P, Antonini A, Colosimo C, et al. The PRIAMO study: A multi-center assessment of nonmotor symptoms and their impact on quality of life in Parkinson's disease. Mov Disord. 2009;24:1641–9. doi: 10.1002/mds.22643. [DOI] [PubMed] [Google Scholar]
- 4.Weintraub D, Moberg PJ, Duda JE, Katz IR, Stern MB. Effect of psychiatric and other nonmotor symptoms on disability in Parkinson's disease. J Am Geriatr Soc. 2004;52:784–8. doi: 10.1111/j.1532-5415.2004.52219.x. [DOI] [PubMed] [Google Scholar]
- 5.Kumar S, Bhatia M, Behari M. Sleep disorders in Parkinson's disease. Mov Disord. 2002;17:775–81. doi: 10.1002/mds.10167. [DOI] [PubMed] [Google Scholar]
- 6.Lees AJ, Blackburn NA, Campbell VL. The nighttime problems of Parkinson's disease. Clin Neuropharmacol. 1988;11:512–9. doi: 10.1097/00002826-198812000-00004. [DOI] [PubMed] [Google Scholar]
- 7.Karlsen KH, Larsen JP, Tandberg E, Maeland JG. Influence of clinical and demographic variables on quality of life in patients with Parkinson's disease. J Neurol Neurosurg Psychiatry. 1999;66:431–5. doi: 10.1136/jnnp.66.4.431. [DOI] [PMC free article] [PubMed] [Google Scholar]
- 8.Martin JL, Hakim AD. Wrist actigraphy. Chest. 2011;139:1514–27. doi: 10.1378/chest.10-1872. [DOI] [PMC free article] [PubMed] [Google Scholar]
- 9.Sadeh A. The role and validity of actigraphy in sleep medicine: an update. Sleep Med Rev. 2011;15:259–67. doi: 10.1016/j.smrv.2010.10.001. [DOI] [PubMed] [Google Scholar]
- 10.Ancoli-Israel S, Cole R, Alessi C, Chambers M, Moorcroft W, Pollak CP. The role of actigraphy in the study of sleep and circadian rhythms. Sleep. 2003;26:342–92. doi: 10.1093/sleep/26.3.342. [DOI] [PubMed] [Google Scholar]
- 11.Sadeh A, Acebo C. The role of actigraphy in sleep medicine. Sleep Med Rev. 2002;6:113–24. doi: 10.1053/smrv.2001.0182. [DOI] [PubMed] [Google Scholar]
- 12.Sadeh A, Hauri PJ, Kripke DF, Lavie P. The role of actigraphy in the evaluation of sleep disorders. Sleep. 1995;18:288–302. doi: 10.1093/sleep/18.4.288. [DOI] [PubMed] [Google Scholar]
- 13.Laakso ML, Leinonen L, Lindblom N, Joutsiniemi SL, Kaski M. Wrist actigraphy in estimation of sleep and wake in intellectually disabled subjects with motor handicaps. Sleep Med. 2004;5:541–50. doi: 10.1016/j.sleep.2004.05.002. [DOI] [PubMed] [Google Scholar]
- 14.Mehra R, Stone KL, Ancoli-Israel S, et al. Interpreting wrist actigraphic indices of sleep in epidemiologic studies of the elderly: the Study of Osteoporotic Fractures. Sleep. 2008;31:1569–76. doi: 10.1093/sleep/31.11.1569. [DOI] [PMC free article] [PubMed] [Google Scholar]
- 15.Signal TL, Gale J, Gander PH. Sleep measurement in flight crew: comparing actigraphic and subjective estimates to polysomnography. Aviat Space Environ Med. 2005;76:1058–63. [PubMed] [Google Scholar]
- 16.Barnes J, Connelly V, Wiggs L, Boubert L, Maravic K. Sleep patterns in Parkinson's disease patients with visual hallucinations. Int J Neurosci. 2010;120:564–9. doi: 10.3109/00207454.2010.494790. [DOI] [PubMed] [Google Scholar]
- 17.Arias P, Vivas J, Grieve KL, Cudeiro J. Double-blind, randomized, placebo controlled trial on the effect of 10 days low-frequency rTMS over the vertex on sleep in Parkinson's disease. Sleep Med. 2010;11:759–65. doi: 10.1016/j.sleep.2010.05.003. [DOI] [PubMed] [Google Scholar]
- 18.Stavitsky K, Saurman JL, McNamara P, Cronin-Golomb A. Sleep in Parkinson's disease: a comparison of actigraphy and subjective measures. Parkinsonism Relat Disord. 2011;16:280–3. doi: 10.1016/j.parkreldis.2010.02.001. [DOI] [PMC free article] [PubMed] [Google Scholar]
- 19.Dowling GA, Mastick J, Colling E, Carter JH, Singer CM, Aminoff MJ. Melatonin for sleep disturbances in Parkinson's disease. Sleep Med. 2005;6:459–66. doi: 10.1016/j.sleep.2005.04.004. [DOI] [PubMed] [Google Scholar]
- 20.Iber C, Ancoli-Israel S, Chesson AL, Quan SF. Westchester, IL: American Academy of Sleep Medicine; 2007. The American Academy of Sleep Medicine manual for the scoring of sleep and associated events: rules, terminology and technical specifications. [Google Scholar]
- 21.van Dijk E, Hilgenkamp TI, Evenhuis HM, Echteld MA. Exploring the use of actigraphy to investigate sleep problems in older people with intellectual disability. JIDR. 2012;56:204–11. doi: 10.1111/j.1365-2788.2011.01458.x. [DOI] [PubMed] [Google Scholar]
- 22.So K, Buckley P, Adamson TM, Horne RS. Actigraphy correctly predicts sleep behavior in infants who are younger than six months, when compared with polysomnography. Pediatric Res. 2005;58:761–5. doi: 10.1203/01.PDR.0000180568.97221.56. [DOI] [PubMed] [Google Scholar]
- 23.Kushida CA, Chang A, Gadkary C, Guilleminault C, Carrillo O, Dement WC. Comparison of actigraphic, polysomnographic, and subjective assessment of sleep parameters in sleep-disordered patients. Sleep Med. 2001;2:389–96. doi: 10.1016/s1389-9457(00)00098-8. [DOI] [PubMed] [Google Scholar]
- 24.Van de Water AT, Holmes A, Hurley DA. Objective measurements of sleep for non-laboratory settings as alternatives to polysomnography—a systematic review. J Sleep Res. 2011;1:183–200. doi: 10.1111/j.1365-2869.2009.00814.x. [DOI] [PubMed] [Google Scholar]


