

Abstract
Study Objectives:
In adults and older children, snoring and obstructive sleep apnea (OSA) are associated with elevated blood pressure (BP). However, BP has not been assessed in preschool children, the age of highest OSA prevalence. We aimed to assess overnight BP in preschool children with snoring and OSA using pulse transit time (PTT), an inverse continuous indicator of BP changes.
Design:
Overnight polysomnography including PTT. Children were grouped according to their obstructive apnea-hypopnea index (OAHI); control (no snoring, with OAHI of one event or less per hour), primary snoring (OAHI one event or less per hour), mild OSA (OAHI greater than one event to five events per hour) and moderate-severe OSA (OAHI more than five events per hour).
Setting:
Pediatric sleep laboratory.
Patients:
There were 128 clinically referred children (aged 3-5 years) and 35 nonsnoring community control children.
Measurement and Results:
PTT was averaged for each 30-sec epoch of rapid eye movement (REM) or nonrapid eye movement (NREM) sleep and normalized to each child's mean wake PTT. PTT during NREM was significantly higher than during REM sleep in all groups (P < 0.001 for all). During REM sleep, the moderate-severe OSA group had significantly lower PTT than the mild and primary snoring groups (P < 0.05 for both). This difference persisted after removal of event-related PTT changes.
Conclusions:
Moderate-severe OSA in preschool children has a significant effect on pulse transit time during REM sleep, indicating that these young children have a higher baseline BP during this state. We propose that the REM-related elevation in BP may be the first step toward development of daytime BP abnormalities. Given that increased BP during childhood predicts hypertension in adulthood, longitudinal studies are needed to determine the effect of resolution of snoring and/or OSA at this age.
Citation:
Nisbet LC; Yiallourou SR; Biggs SN; Nixon GM; Davey MJ; Trinder JA; Walter LM; Horne RSC. Preschool children with obstructive sleep apnea: the beginnings of elevated blood pressure? SLEEP 2013;36(8):1219-1226.
Keywords: Blood pressure, children, obstructive sleep apnea, preschool, pulse transit time, snoring
INTRODUCTION
Obstructive sleep apnea (OSA) occurs in 1-4% of children1 and is characterized by snoring, repetitive airway obstructions, and gas exchange abnormalities and/or arousals. Snoring without gas exchange abnormalities or sleep disturbance defines primary snoring (PS). Snoring is commonly reported to occur in 3-15% of children,1 with the peak prevalence in the preschool years, when the size of the lymphoid tissue of the upper airway is at its largest in relation to the size of the facial skeleton.2
In adults, OSA is independently associated with hypertension and cardiovascular disease. 3 Similar findings have been reported from pediatric studies, with a recent study by our group using continuous blood pressure (BP) measurement (FinometerTM, FMS, The Netherlands) demonstrating elevated overnight BP in elementary school -aged children with both PS and OSA when compared with nonsnoring control children,4 findings that support a previous study.5 Despite the high prevalence of snoring and OSA in the preschool years, BP across the night has not been studied. Because the FinometerTM used previously4 has no appropriately sized cuff for preschool children, another continuous measurement of BP changes was required.
An alternative method of continuous BP measurement is pulse transit time (PTT). A derivative of pulse wave velocity, PTT is inversely related to BP. PTT is defined as the time taken for the arterial pulse pressure wave to travel from the left ventricle to a predetermined peripheral site.6 The pulse pressure wave propagation is principally determined by the degree of arterial wall stiffness, which is governed by instantaneous BP.7,8 Arterial stiffness increases concomitantly with increased BP, leading to a faster movement of the pulse wave and therefore a shorter PTT. Conversely, a decrease in BP is associated with decreased arterial stiffness and slower pulse wave propagation, and therefore increased PTT.7,8
Given that increased BP during childhood predicts hypertension in adulthood,9 we aimed to compare PTT measurements between children with PS and varying severities of OSA to non snoring control children. We hypothesized that preschool children with PS and OSA would exhibit decreased PTT compared with nonsnoring children, similar to the BP pattern seen in older children.
METHODS
Ethical approval for this project was granted by the Southern Health and Monash University Human Research Ethics Committees and procedures followed were in accordance with institutional guidelines. Written informed consent was obtained from participants' parents and verbal assent from the children. No monetary incentive was given for participation. The current study formed part of a larger project investigating the effects of PS and OSA on cardiovascular function, sleep quality, behavior, and cognition, of which neurobehavioral outcomes,10 electroencephalogram slow wave activity,11 and sleep disturbance measures12 have been published.
Study Protocol
Preschool children aged 3-5 years, referred to the Melbourne Children's Sleep Centre for assessment of suspected OSA between July 2008 and May 2011, were recruited. Control children of the same age with no history of snoring were recruited from the community. All children underwent a medical examination prior to overnight polysomnography (PSG). Children with conditions or taking medications known to affect sleep, breathing (not including asthma), BP, or neurocognitive function were not recruited. Bronchodilator medication was not taken within 24 hours of the PSG study and all children were otherwise healthy at the time of the study.
On the night of the study, participant arm length, measured from index fingertip of the outstretched arm to the sternal notch, was recorded. Height and weight were measured and converted to a body mass index (BMI) z-score to adjust for sex and age.13 Office BP was taken in triplicate during restful wakefulness, sitting upright, using an electronic BP monitor (Dinamap V100, CARESCAPETM, Freiburg, Germany) and an appropriately sized cuff. Systolic and diastolic BP measurements were converted to z-scores relative to age, sex, and height.14
Full details of PSG methods have been published previously.10–12 Briefly, all children underwent 1 night of full PSG with electroencephalograms (Cz, C4-A1, C3-A2, O2-A1, O1-A2), submental and leg electromyograms, electrooculograms, electrocardiogram (ECG), respiratory movements, oxygen saturation, and airflow measurements (nasal pressure and thermistor). PSG sleep staging and scoring were performed in accordance with clinical practice and international standards at the time of study.15–18 The obstructive apnea-hypopnea index (OAHI) was used to define severity groups: PS was defined as an OAHI of one event or less per hour; mild OSA as an OAHI of greater than one event to five events per hour; and moderate/severe (MS) OSA as an OAHI of greater than five events per hour. Control children had an OAHI of one or fewer events per hour and no snoring during PSG or reported by parents.
A photoplethysmographic pulse oximeter (PPG) (Adult Flex Sensor 3M, Nonin Medical Inc., Plymouth, MN, USA) was used to record the pulse waveform necessary for PTT analysis and was sampled at 512 Hz. PSG recording began before lights out and included wake before sleep onset for a minimum of 10-min in all patients. All PSG data were transferred via European Data Format to specialized data analysis software (LabChart 7.2, ADInstruments, Sydney, Australia). Epochs containing wake after sleep onset were excluded, together with epochs containing manually identified movement artifact (gross body movement affecting all PSG channels or artifact isolated to ECG or PPG signals).
Data Analysis
PTT was calculated for each beat in LabChart, whereby peak detection was used to identify the peak of the ECG R-wave. The 50% point of the pulse wave height on the corresponding PPG signal was similarly determined, as this point is most resistant to artifact,19 and PTT was calculated beat-by-beat as the time delay between these two points. An average PTT was then calculated for each 30-sec epoch. Individual differences are inherent to PTT measurement, precluding comparison of raw PTT values between patients.19 Thus, the PTT value for each epoch was normalized to that child's mean PTT during restful wake before sleep onset by dividing the epoch PTT by the mean wake PTT. Normalized PTT and heart rate (HR) were first averaged for the entire night of sleep for each child. Subsequently, the effects of sleep stage (wake; rapid eye movement [REM]; and two divisions of nonrapid eye movement [NREM] sleep, NREM1/2 and NREM3/4) were examined using normalized PTT and HR averaged for each sleep stage in each child. To examine changes in BP across the night, PTT was compared in each sleep stage in thirds (first, second, and final) of the total sleep period. The effect of group was determined in each sleep stage. A separate analysis of ‘stable’ REM sleep was performed to remove the acute effects of respiratory events, which predominantly occur in REM sleep in young children,12,20,21 by excluding epochs containing respiratory events, arousals, and/or movement.
Statistical Analyses
Statistical analyses were conducted using SPSS® (IBM® Statistics version 19, Chicago, IL, USA). Sample size was calculated based on published data of continuous BP and HR in children, as suitable PTT data were unavailable. With α power of 0.8 and significance of 0.05 to show a clinically significant BP difference of 5 mm Hg and HR of 10 beats per min, 32 children are required in each group. Data were first tested for normality and equal variance. HR was normalized using reciprocal transformation. Demographic and PSG variables together with the effects of group on HR and PTT during each sleep stage and ‘stable’ REM sleep were compared using one-way analysis of variance (ANOVA) with Student-Newman-Keuls post hoc testing, and Kruskal-Wallis ANOVA on ranks with Mann-Whitney U test when not normally distributed. One-way repeated measures ANOVA was performed to assess the effect of sleep stage on HR and PTT within each group. Gen-eral linear model repeated measures were used to assess group changes in HR and PTT between wake and sleep, and thirds of the total sleep period within each sleep stage. Pearson correlations were conducted to explore the relationship between sleep PTT and HR with BMI z-score and arm length. Data are presented as mean (standard error), with significance taken at the P < 0.05 level.
RESULTS
A total of 192 preschool children (151 cases, 41 control patients) were recruited. Children were excluded if they had < 4 h of sleep, < 10 epochs (5-min) of artifact-free PTT during wake prior to sleep onset, or if the PPG signal contained excessive movement artifact, leaving 163 patients in the following groups for analysis: 35 control, 66 PS, 34 mild OSA, and 28 MS OSA.
Demographic and PSG Characteristics
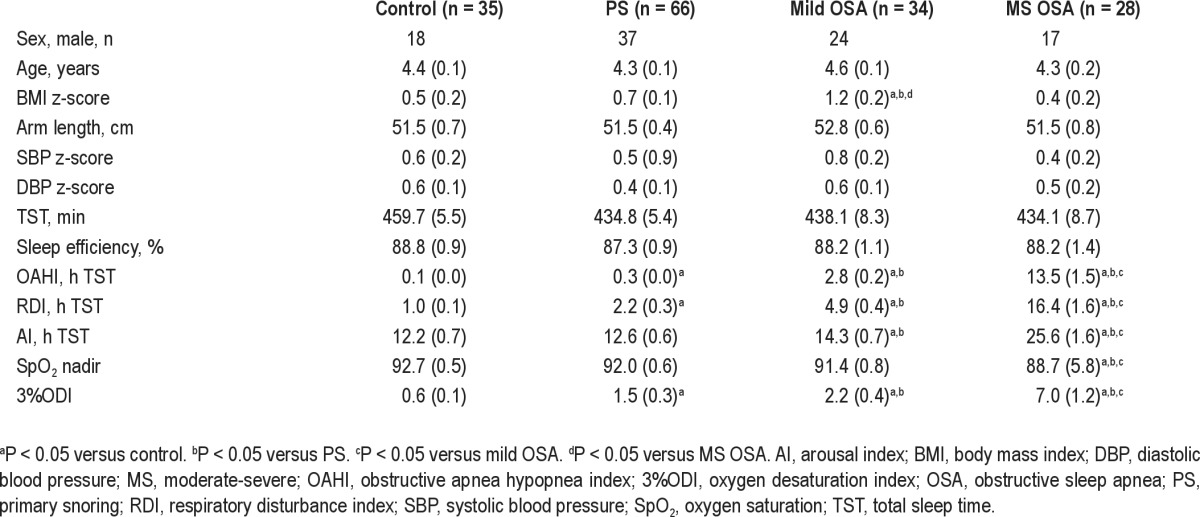
Demographic and PSG characteristics are presented in Table 1. There were no group differences for sex, age, arm length, or office BP z-scores. BMI z-score was significantly higher in the group with mild OSA than in all other groups (P < 0.05 for all). Total sleep time and sleep efficiency did not differ between groups. Due to study design, the OAHI and other measures of OSA severity were significantly higher in the MS OSA group compared with the other groups (P ≤ 0.01 for all).
Table 1.
Demographic and polysomnographic characteristics according to group
Effect of Sleep on PTT and HR
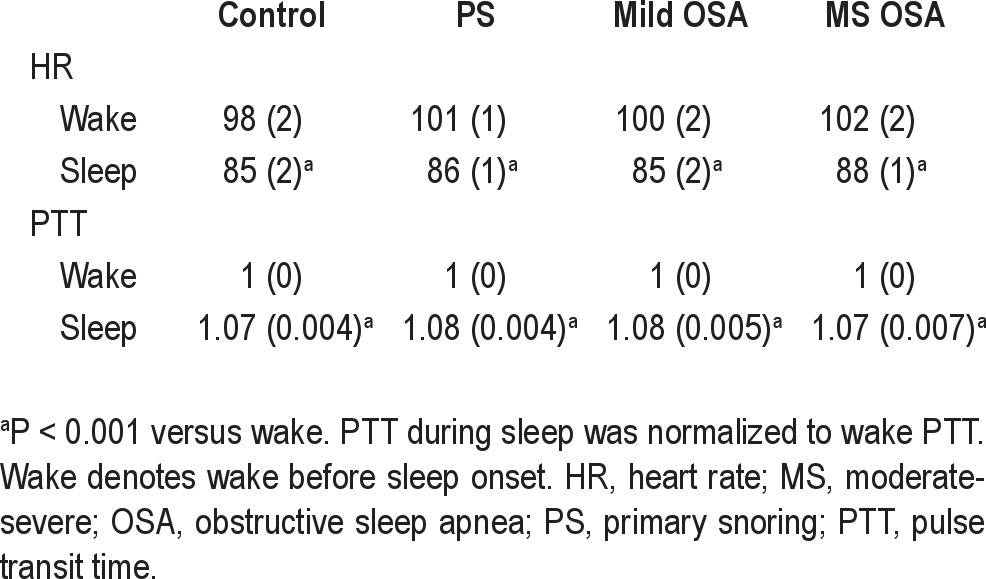
Comparing wake to sleep, PTT significantly increased and HR significantly decreased in all groups (P < 0.001 for all), as shown in Table 2. Sleep PTT and wake and sleep HR did not differ between groups. Sleep PTT and HR were not significantly correlated with BMI z-score or arm length.
Table 2.
HR and PTT during wake and sleep according to group
Effect of Sleep Stage on PTT and HR
The effects of sleep stage on PTT and HR are shown in Figure 1. In all groups, a significant effect of sleep stage was seen for both PTT and HR (P < 0.001, for all), with PTT during NREM1/2 being similar to that during NREM3/4 sleep and both being significantly higher than in REM and wake (P < 0.001 for all). Similarly, HR during NREM1/2 and NREM3/4 sleep were not different, and both were significantly lower than during REM and wake (P < 0.001 for all).
Figure 1.

The effect of sleep stage on pulse transit time (PTT) and heart rate (HR) in control (A), primary snoring (B), mild obstructive sleep apnea (C), and moderate-severe obstructive sleep apnea (D) groups. PTT during sleep was normalized to wake PTT. Wake denotes wake before sleep onset. PTT depicted in solid line; HR, broken line. Stages within each parameter that do not have a letter in common are significantly different (P < 0.001). bpm, beats per minute; NREM, nonrapid eye movement; REM, rapid eye movement.
Trajectory of PTT across the Total Sleep Period, within Each Sleep Stage
The trajectory of PTT across the night was only conducted in the subsample of children who had at least 10 analyzable epochs per sleep stage and third of the night (NREM1/2, n = 160; NREM3/4, n = 102; REM, n = 102). During NREM1/2 and NREM3/4 sleep there was a significant effect of period of the night on PTT (P < 0.001 for both), with PTT being significantly lower in the first third of the night (Figures 2A and 2B); however, there was no effect of group, nor interaction of group and period. In contrast, there was no overall effect of period of the night or group on PTT during REM sleep (Figure 2C). Although the interaction between period and group did not reach significance (P = 0.09), PTT was lowest in the MS OSA group during the second and final third of the night, whereas all other groups maintained a stable and relatively higher PTT in REM sleep across the night.
Figure 2.

Normalized PTT of each group in each third (first, second, final) of the sleep period during NREM1/2 (A), NREM3/4 (B), and REM (C) sleep. PTT during sleep was normalized to wake PTT. Control group depicted in open black circles; PS, light blue circles; mild OSA, dark blue squares; MS OSA, purple triangles. Thirds that do not have a letter in common are significantly different from each other (P < 0.05). MS, moderate-severe; NREM, nonrapid eye movement; OSA, obstructive sleep apnea; PS, primary snoring; PTT, pulse transit time; REM, rapid eye movement.
Effect of Group on PTT and HR
The effect of group on PTT and HR is shown in Figure 3. There was no effect of group on PTT during either NREM1/2 or NREM3/4 sleep. However, in REM sleep, PTT was significantly lower in the MS OSA group than the PS (P < 0.05) and mild OSA groups (P < 0.05), with no significant differences between the control, PS and mild OSA groups. There was no effect of group on HR during wake or any sleep stage.
Figure 3.

HR and normalized PTT during wake (A), NREM1/2 (B), NREM3/4 (C), and REM (D) sleep, according to group. PTT during sleep was normalized to wake PTT. Wake denotes wake before sleep onset. PTT shown in solid circles; HR, open circles.*P < 0.05. bpm, beats per min; HR, heart rate; MS, moderate-severe; NREM, nonrapid eye movement; OSA, obstructive sleep apnea; PS, primary snoring; PTT, pulse transit time; REM, rapid eye movement.
Effect of Group on PTT during ‘Stable’ REM Sleep
PTT during ‘stable’ REM sleep was significantly different between groups (P < 0.05), with the MS OSA group having lower PTT than the PS (P < 0.05) and mild OSA groups (P < 0.05; Figure 4). HR was not different between groups.
Figure 4.

HR and normalized PTT during ‘stable’ REM sleep according to group. PTT during sleep was normalized to wake PTT. Wake denotes wake before sleep onset. PTT shown in solid circles; HR, open circles. *P < 0.05. bpm, beats per min; HR, heart rate; MS, moderate-severe; NREM, nonrapid eye movement; OSA, obstructive sleep apnea; PS, primary snoring; PTT, pulse transit time; REM, rapid eye movement.
DISCUSSION
This is the first study to use PTT to track BP changes across the entire night with the purpose of investigating the effect of snoring and OSA severity in preschool children. We observed that the sleep related changes in PTT both over the entire night and when individual sleep stages were assessed mimicked the expected changes in BP, thereby supporting the use of PTT as an indicative measure of BP changes in young children. Importantly, we identified that PTT was lower during REM sleep in the MS OSA group compared with both the mild OSA and PS groups. This suggests that these young children with more severe OSA have an elevated level of BP in this sleep state.
PTT significantly increased from wake to sleep in all children, indicating a decrease in BP as has been reported in the literature for both adults22 and children.4,23,24 Our findings of the sleep state effects on PTT are similar to those reported in older children using direct continuous measurements of BP.4 In that study we showed that BP was lower during NREM1/2 and NREM3/4 sleep than during wake in elementary school children4 consistent with our finding of a higher PTT during these stages in preschool children. In addition, BP during REM sleep was higher than during NREM,4 again in keeping with our current results of lower PTT during REM. Furthermore, HR was lower during NREM1/2, NREM3/4, and REM sleep than during wake in elementary school children, but with no significant differences between sleep stages4; a finding similar to this study in preschool children.
The trajectory of BP across the night has not previously been reported in preschool children. In adults, BP decreases abruptly at sleep onset but then remains constant within each stage of sleep over the night.22 Our study has shown a lower PTT in NREM1/2 and NREM3/4 sleep in the first third of the night compared to later in the night, suggesting that the decrease in BP at sleep onset is not so abrupt in preschool children. Although this finding was not statistically significant, having MS OSA appeared to alter the trajectory of PTT during REM sleep across the sleep period in these children; PTT in the MS OSA group progressively decreased while remaining relatively stable in the other groups. This finding is consistent with the characteristic pattern in children of worsening obstructive events as the night progresses.25
Previous pediatric studies using ambulatory BP either have not compared the effect of OSA severity on BP in the separate sleep states,5,26,27 or have found no difference in BP indices measured in NREM compared with REM sleep.28–30 Discrepancies with our current findings may be due to differing sample sizes, patient age ranges, and the limitations of ambulatory monitoring. Being intermittent in nature, the low sampling rate in previous studies requires that sleep BP recordings be pooled; thus, any effect on BP is generalized to the entire night.5,26,27 Alternatively, the small number of measurements may have precluded the finding of a real difference between sleep states.28–30 Continuous measurement of BP is preferable, as used by Horne and colleagues,4 who did find a difference between sleep states in older children. This study used PTT as an alternative method of continuous measurement, thereby allowing BP changes in each sleep state, and the effect of OSA, to be distinguished.
We had hypothesized that children with all severities of OSA and PS would have decreased PTT compared with nonsnoring children, similar to the increased BP observed in older children with snoring and/or OSA.4,5,26–28 We found wake office BP and PTT during NREM sleep to be similar in all severity groups; however, during REM sleep, children with MS OSA had significantly reduced PTT compared with children with PS and mild OSA, indicating elevated BP. We did not find a graded response of decreasing PTT with increasing severity as we had hypothesized; however, PTT values in children with PS and mild OSA were not different in control children during REM sleep. OSA is typically a REM-related condition in young children,20,21 and we recently reported a significantly higher index of obstructive respiratory events during REM sleep compared with NREM in this cohort.12 A significant elevation in mean arterial pressure occurs at the termination of obstructive events in children31 and therefore, it is possible that in preschool children, elevated BP first becomes apparent during REM sleep, concurrent with the increased number of respiratory events in this sleep state. Kohyama and colleagues28 similarly found a significant elevation in BP indices in REM, but not in NREM sleep, in their severe OSA group aged 4-11 years. Our findings support their suggestion that the event-related surges in BP during REM sleep might be the first step toward the development of daytime BP elevation.
The surges in HR and BP that occur with respiratory event termination, and that are augmented by concomitant arousal or subcortical activations, are not solely responsible for our results during REM sleep, as our ‘stable’ sleep analysis identified group differences virtually identical to analyses conducted with events and arousals included. We cannot discount the possibility of unscored events such as microarousals being present during our ‘stable’ sleep analysis. Nonetheless, our results reflect changes in BP that are temporally distinct from the changes associated with clinically scored events. Furthermore, previous publications reporting ‘stable’ or eventfree sleep did not examine for nor exclude microarousals; thus, we adopted consistent methodology4,32 and similarly found BP elevation to occur with and without events.4 PTT has been used as a sensitive method of detecting microarousals and respiratory effort in children due to the BP changes associated with these phenomena.33–36 A study in children aged 6-15 years reported a significantly higher number of nonrespiratory-related ‘autonomic activations’ (scored through PTT visualization) than cortical arousals (scored conventionally) per hour of REM sleep.33 The authors conceded that false scoring of microarousals can occur with fluctuations in PTT, even though they might correspond to spontaneous surges in BP occurring physiologically during REM sleep.33 Relative to NREM sleep, REM sleep is characterized by higher sympathetic activity37 and is likely to be more sensitive to changes in sympathetictone. Therefore, irrespective of the presence or absence of microarousals, we suggest that the higher baseline BP seen in REM sleep in our MS OSA group is a function of increased sympathetic activity, which may or may not be coupled with increased parasympathetic withdrawal. Perturbations in cardiac autonomic control have been reported in older children with OSA32 and research is needed to investigate autonomic control in preschool children with OSA. As increased BP during childhood strongly predicts hypertension in young adults,9 follow-up studies are needed to determine the effect of resolution of snoring and/or OSA in this age group.
Through the use of PTT we were able to study changes in BP in a continuous and noninvasive manner in a young population, which was not possible with any other method. A limitation of PTT, however, is the inability to calculate the BP difference between groups or sleep stages in our study in absolute terms (mm Hg). Despite this, PTT is a useful clinical tool when prolonged hemodynamic monitoring is required. In an intensive care setting, mean values of BP calculated from PTT did not differ from BP measured intra-arterially in adults.38 Devices that estimate systolic BP from PTT using intermittent cuff-based calibration have been highly correlated with arterial catheter39 and cuff-based systolic BP.40 Furthermore, a 34% rise in systolic BP paralleled a 26% decrease in PTT in a device that fulfi lled the accuracy requirements of the British Hypertension Society 5 weeks after calibration.41 Although PTT has not been validated against invasive BP measurement in children, it has proven sensitive to physiologic changes in BP in this population,33–36 and correlations between PTT and clinically used cuff-based BP measurements have been reported in both normotensive6,42 and hypertensive children.43
We acknowledge that there are some limitations to the current study. First, the study was not scored using the current American Academy of Sleep Medicine (AASM) guidelines, but was scored using clinical criteria at the time of our study. Our review of the effect of this change within our own clinical unit following recent implementation of the 2007 AASM rules has shown that the new rules typically result in a lower OAHI, as the cutoff for reduction in airflow that defines a hypopnea is lower. Thus, the groupings presented in this article would tend to weight the results toward the more severe end of the spectrum. Therefore, our finding of a difference for the MS OSA group at least holds, and may in fact have extended to less severe groups had we used the newer scoring system. Second, PTT calculation uses the R-wave as the calculation start point; therefore, part of the pre-ejection period of the cardiac cycle is included in the measured time. Due to possible differences in pre-ejection period, vascular tone, and arm length, absolute PTT values cannot be compared between individuals.19 How-ever, the process of normalization can be adopted to permit interpatient comparison. Rather than subtract mean group baseline activity PTT values from subsequent individual PTT results as previously suggested,6 the current study chose normalization of each individual's data as a function of their own wake values. We propose that this ratio better reflects individual changes in BP. Our 5-min minimum duration of artifact-free baseline was both representative of wakefulness and feasible for collection.
In conclusion, this study used PTT to continuously and non-invasively track BP changes across the entire night in preschool children. We found that MS OSA in preschool children had a significant effect on PTT during REM sleep, which persisted after removal of the acute changes associated with respiratory events. This indicates that young children with more severe OSA have an ongoing higher baseline BP during REM sleep. We propose that the REM-related elevation in BP may be the first step toward development of the daytime BP abnormalities that have been documented in older populations with OSA. Given that increased BP during childhood predicts hypertension in adulthood,9 longitudinal studies are needed to determine the effect of resolution of snoring and/or OSA in this age group.
DISCLOSURE STATEMENT
This was not an industry supported study. Dr. Nixon is on the board of the Australian Sleep Association. The other authors have indicated no financial conflicts of interest.
ACKNOWLEDGMENTS
Dr. Walter is a cosenior author. This study has been supported by a National Health and Medical Research Council of Australia project grant (number 491001) and the Victorian Government's Operational Infrastructure Support Program. The authors thank the children, families, and caregivers who participated in this study, and the staff of the Melbourne Children's Sleep Centre for their support.
REFERENCES
- 1.Lumeng JC, Chervin RD. Epidemiology of pediatric obstructive sleep apnea. Proc Am Thorac Soc. 2008;5:242–52. doi: 10.1513/pats.200708-135MG. [DOI] [PMC free article] [PubMed] [Google Scholar]
- 2.Nixon GM, Brouillette RT. Sleep. 8: Paediatric obstructive sleep apnoea. Thorax. 2005;60:511–6. doi: 10.1136/thx.2003.007203. [DOI] [PMC free article] [PubMed] [Google Scholar]
- 3.Hamilton GS, Solin P, Naughton MT. Obstructive sleep apnoea and cardiovascular disease. Intern Med J. 2004;34:420–6. doi: 10.1111/j.1445-5994.2004.00596.x. [DOI] [PubMed] [Google Scholar]
- 4.Horne RS, Yang JS, Walter LM, et al. Elevated blood pressure during sleep and wake in children with sleep-disordered breathing. Pediatrics. 2011;128:e85–92. doi: 10.1542/peds.2010-3431. [DOI] [PubMed] [Google Scholar]
- 5.Li AM, Au CT, Ho C, Fok TF, Wing YK. Blood pressure is elevated in children with primary snoring. J Pediatr. 2009;155:362–8. doi: 10.1016/j.jpeds.2009.03.041. [DOI] [PubMed] [Google Scholar]
- 6.Foo JY, Wilson SJ. Clinical applications of pulse transit time in paediatric critical care. J Med Eng Technol. 2009;33:79–86. doi: 10.1080/03091900701860210. [DOI] [PubMed] [Google Scholar]
- 7.Drinnan MJ, Allen J, Murray A. Relation between heart rate and pulse transit time during paced respiration. Physiol Meas. 2001;22:425–32. doi: 10.1088/0967-3334/22/3/301. [DOI] [PubMed] [Google Scholar]
- 8.Smith RP, Argod J, Pepin JL, Levy PA. Pulse transit time: an appraisal of potential clinical applications. Thorax. 1999;54:452–7. doi: 10.1136/thx.54.5.452. [DOI] [PMC free article] [PubMed] [Google Scholar]
- 9.Bao W, Threefoot SA, Srinivasan SR, Berenson GS. Essential hypertension predicted by tracking of elevated blood pressure from childhood to adulthood: the Bogalusa Heart Study. Am J Hypertens. 1995;8:657–65. doi: 10.1016/0895-7061(95)00116-7. [DOI] [PubMed] [Google Scholar]
- 10.Jackman AR, Biggs SN, Walter LM, et al. Sleep-disordered breathing in preschool children is associated with behavioral, but not cognitive, impairments. Sleep Med. 2012;13:621–31. doi: 10.1016/j.sleep.2012.01.013. [DOI] [PubMed] [Google Scholar]
- 11.Biggs SN, Walter LM, Nisbet LC, et al. Time course of EEG slow-wave activity in pre-school children with sleep disordered breathing: a possible mechanism for daytime deficits? Sleep Med. 2012;13:999–1005. doi: 10.1016/j.sleep.2012.05.006. [DOI] [PubMed] [Google Scholar]
- 12.Walter LM, Nixon GM, Davey MJ, O'Driscoll DM, Trinder J, Horne RS. Sleep disturbance in pre-school children with obstructive sleep apnoea syndrome. Sleep Med. 2011;12:880–6. doi: 10.1016/j.sleep.2011.07.007. [DOI] [PubMed] [Google Scholar]
- 13.Ogden CL, Kuczmarski RJ, Flegal KM, et al. Centers for Disease Control and Prevention 2000 growth charts for the United States: improvements to the 1977 National Center for Health Statistics version. Pediatrics. 2002;109:45–60. doi: 10.1542/peds.109.1.45. [DOI] [PubMed] [Google Scholar]
- 14.National High Blood Pressure Education Program Working Group on High Blood Pressure in Children and Adolescents: the fourth report on the diagnosis, evaluation, and treatment of high blood pressure in children and adolescents. Pediatrics. 2004;114:555–76. [PubMed] [Google Scholar]
- 15.Rechtschaffen A, Kales A. Washing-ton DC: US Government Printing Office; 1968. A manual of standardized terminology, techniques, and scoring system for sleep stages of human subjects. [Google Scholar]
- 16.EEG arousals. Scoring rules and examples: a preliminary report from the Sleep Disorders Atlas Task Force of the American Sleep Disorders association. Sleep. 1992;15:173–84. [PubMed] [Google Scholar]
- 17.Mograss MA, Ducharme FM, Brouillette RT. Movement/arousals. Description, classification, and relationship to sleep apnea in children. Am J Respir Crit Care Med. 1994;150:1690–6. doi: 10.1164/ajrccm.150.6.7952634. [DOI] [PubMed] [Google Scholar]
- 18.American Thoracic Society. Standards and indications for cardiopulmonary sleep studies in children. Am J Respir Crit Care Med. 1996;153:866–78. doi: 10.1164/ajrccm.153.2.8564147. [DOI] [PubMed] [Google Scholar]
- 19.Payne RA, Symeonides CN, Webb DJ, Maxwell SR. Pulse transit time measured from the ECG: an unreliable marker of beat-to-beat blood pres-sure. J Appl Physiol. 2006;100:136–41. doi: 10.1152/japplphysiol.00657.2005. [DOI] [PubMed] [Google Scholar]
- 20.Marcus CL. Sleep-disordered breathing in children. Am J Respir Crit Care Med. 2001;164:16–30. doi: 10.1164/ajrccm.164.1.2008171. [DOI] [PubMed] [Google Scholar]
- 21.Verginis N, Jolley D, Horne RS, Davey MJ, Nixon GM. Sleep state distribution of obstructive events in children: is obstructive sleep apnoea really a rapid eye movement sleep-related condition? J Sleep Res. 2009;18:411–4. doi: 10.1111/j.1365-2869.2009.00760.x. [DOI] [PubMed] [Google Scholar]
- 22.Trinder J, Kleiman J, Carrington M, et al. Autonomic activity during human sleep as a function of time and sleep stage. J Sleep Res. 2001;10:253–64. doi: 10.1046/j.1365-2869.2001.00263.x. [DOI] [PubMed] [Google Scholar]
- 23.Gellermann J, Kraft S, Ehrich JH. Twenty-four-hour ambulatory blood pressure monitoring in young children. Pediatr Nephrol. 1997;11:707–10. doi: 10.1007/s004670050371. [DOI] [PubMed] [Google Scholar]
- 24.Varda NM, Gregoric A. Twenty-four-hour ambulatory blood pressure monitoring in infants and toddlers. Pediatr Nephrol. 2005;20:798–802. doi: 10.1007/s00467-005-1857-1. [DOI] [PubMed] [Google Scholar]
- 25.Goh DY, Galster P, Marcus CL. Sleep architecture and respiratory disturbances in children with obstructive sleep apnea. Am J Respir Crit Care Med. 2000;162:682–6. doi: 10.1164/ajrccm.162.2.9908058. [DOI] [PubMed] [Google Scholar]
- 26.Bixler EO, Vgontzas AN, Lin HM, et al. Blood pressure associated with sleep-disordered breathing in a population sample of children. Hypertension. 2008;52:841–6. doi: 10.1161/HYPERTENSIONAHA.108.116756. [DOI] [PMC free article] [PubMed] [Google Scholar]
- 27.Amin R, Somers VK, McConnell K, et al. Activity-adjusted 24-hour am-bulatory blood pressure and cardiac remodeling in children with sleep disordered breathing. Hypertension. 2008;51:84–91. doi: 10.1161/HYPERTENSIONAHA.107.099762. [DOI] [PubMed] [Google Scholar]
- 28.Kohyama J, Ohinata JS, Hasegawa T. Blood pressure in sleep disordered breathing. Arch Dis Child. 2003;88:139–42. doi: 10.1136/adc.88.2.139. [DOI] [PMC free article] [PubMed] [Google Scholar]
- 29.Amin RS, Carroll JL, Jeffries JL, et al. Twenty-four-hour ambulatory blood pressure in children with sleep-disordered breathing. Am J Respir Crit Care Med. 2004;169:950–6. doi: 10.1164/rccm.200309-1305OC. [DOI] [PubMed] [Google Scholar]
- 30.Marcus CL, Greene MG, Carroll JL. Blood pressure in children with obstructive sleep apnea. Am J Respir Crit Care Med. 1998;157:1098–103. doi: 10.1164/ajrccm.157.4.9704080. [DOI] [PubMed] [Google Scholar]
- 31.O'Driscoll DM, Foster AM, Ng ML, et al. Acute cardiovascular changes with obstructive events in children with sleep disordered breathing. Sleep. 2009;32:1265–71. doi: 10.1093/sleep/32.10.1265. [DOI] [PMC free article] [PubMed] [Google Scholar]
- 32.Walter LM, Nixon GM, Davey MJ, Anderson V, Walker AM, Horne RS. Autonomic dysfunction in children with sleep disordered breathing. Sleep Breath. 2012. Jun 9, [Epub ahead of print]. http://dx.doi.org/10.1007/s11325-012-0727-x. [DOI] [PubMed]
- 33.Pepin JL, Delavie N, Pin I, et al. Pulse transit time improves detection of sleep respiratory events and microarousals in children. Chest. 2005;127:722–30. doi: 10.1378/chest.127.3.722. [DOI] [PubMed] [Google Scholar]
- 34.Bradley J, Galland BC, Bakker JP, et al. Pulse transit time and assessment of childhood sleep disordered breathing. Arch Otolaryngol Head Neck Surg. 2012;138:398–403. doi: 10.1001/archoto.2012.86. [DOI] [PubMed] [Google Scholar]
- 35.Galland BC, Tan E, Taylor BJ. Pulse transit time and blood pressure changes following auditory-evoked subcortical arousal and waking of infants. Sleep. 2007;30:891–7. doi: 10.1093/sleep/30.7.891. [DOI] [PMC free article] [PubMed] [Google Scholar]
- 36.Katz ES, Lutz J, Black C, Marcus CL. Pulse transit time as a measure of arousal and respiratory effort in children with sleep-disordered breathing. Pediatr Res. 2003;53:580–8. doi: 10.1203/01.PDR.0000057206.14698.47. [DOI] [PubMed] [Google Scholar]
- 37.Somers VK, Dyken ME, Clary MP, Abboud FM. Sympathetic neural mechanisms in obstructive sleep apnea. J Clin Invest. 1995;96:1897–904. doi: 10.1172/JCI118235. [DOI] [PMC free article] [PubMed] [Google Scholar]
- 38.Bartsch S, Ostojic D, Schmalgemeier H, et al. [Validation of continuous blood pressure measurements by pulse transit time: a comparison with invasive measurements in a cardiac intensive care unit] Dtsch Med Wochenschr. 2010;135:2406–12. doi: 10.1055/s-0030-1269408. [DOI] [PubMed] [Google Scholar]
- 39.Chen W, Kobayashi T, Ichikawa S, Takeuchi Y, Togawa T. Continuous estimation of systolic blood pressure using the pulse arrival time and in-termittent calibration. Med Biol Eng Comput. 2000;38:569–74. doi: 10.1007/BF02345755. [DOI] [PubMed] [Google Scholar]
- 40.Gesche H, Grosskurth D, Kuchler G, Patzak A. Continuous blood pressure measurement by using the pulse transit time: comparison to a cuff-based method. Eur J Appl Physiol. 2011;112:309–15. doi: 10.1007/s00421-011-1983-3. [DOI] [PubMed] [Google Scholar]
- 41.Mase M, Mattei W, Cucino R, Faes L, Nollo G. Feasibility of cuff-free measurement of systolic and diastolic arterial blood pressure. J Electro-cardiol. 2011;44:201–7. doi: 10.1016/j.jelectrocard.2010.11.019. [DOI] [PubMed] [Google Scholar]
- 42.Allen J, Murray A. Age-related changes in peripheral pulse timing characteristics at the ears, fingers and toes. J Hum Hypertens. 2002;16:711–7. doi: 10.1038/sj.jhh.1001478. [DOI] [PubMed] [Google Scholar]
- 43.Foo JY, Wilson SJ. Normalized peripheral transit time to monitor hypertension in children. J Med Eng Technol. 2008;32:343–7. doi: 10.1080/03091900500422253. [DOI] [PubMed] [Google Scholar]