Abstract
Study Objective:
Systemic tumor necrosis factor-α (TNF-α) is linked to sleep and sleep altering pathologies in humans. Evidence from animals indicates that systemic and brain TNF-α have a role in regulating sleep. In animals, TNF-α or lipopolysaccharide (LPS) enhance brain pro-inflammatory cytokine expression and sleep after central or peripheral administration. Vagotomy blocks enhanced sleep induced by systemic TNF-α and LPS in rats, suggesting that vagal afferent stimulation by TNF-α enhances pro-inflammatory cytokines in sleep-related brain areas. However, the effects of systemic TNF-α on brain cytokine expression and mouse sleep remain unknown.
Design:
We investigated the role of vagal afferents on brain cytokines and sleep after systemically applied TNF-α or LPS in mice.
Measurements and Results:
Spontaneous sleep was similar in vagotomized and sham-operated controls. Vagotomy attenuated TNF-α- and LPS-enhanced non-rapid eye movement sleep (NREMS); these effects were more evident after lower doses of these substances. Vagotomy did not affect rapid eye movement sleep responses to these substances. NREMS electroencephalogram delta power (0.5-4 Hz range) was suppressed after peripheral TNF-α or LPS injections, although vagotomy did not affect these responses. Compared to sham-operated controls, vagotomy did not affect liver cytokines. However, vagotomy attenuated interleukin-1 beta (IL-1β) and TNF-α mRNA brain levels after TNF-α, but not after LPS, compared to the sham-operated controls.
Conclusions:
We conclude that vagal afferents mediate peripheral TNF-α-induced brain TNF-α and IL-1β mRNA expressions to affect sleep. We also conclude that vagal afferents alter sleep induced by peripheral pro-inflammatory stimuli in mice similar to those occurring in other species.
Citation:
Zielinski MR; Dunbrasky DL; Taishi P; Souza G; Krueger JM. Vagotomy attenuates brain cytokines and sleep induced by peripherally administered tumor necrosis factor-α and lipopolysaccharide in mice. SLEEP 2013;36(8):1227-1238.
Keywords: Vagotomy, lipopolysaccharide, tumor necrosis factor-α, interleukin-1β, mouse, vagal afferents, sleep, EEG
INTRODUCTION
Tumor necrosis factor-α (TNF-α) is linked to human sleep regulation.1–4 In humans, for instance, TNF-α and TNF receptor 1 (TNFR1) levels in plasma are enhanced after sleep deprivation and before sleep onset, when sleep propensity is high.3,5,6 Further, elevated circulating TNF-α levels are characteristic of multiple pathologies, including sleep apnea and insomnia, that have associated sleepiness or sleep disturbances.1,2,7,8 Moreover, diseases that affect peripheral inflammation and circulating TNF-α levels, including colorectal cancer and type 2 diabetes,9,10 are also associated with disturbed sleep.11,12 However, the impact of systemic inflammatory substances on brain TNF-α expression and associated sleep-linked changes in humans remains unknown.
The animal literature indicates that not only peripheral but also brain TNF-α are important for sleep regulation.13 In animals, prolonged wakefulness enhances brain TNF-α mRNA expression and protein levels.14–18 In rats, brain TNF-α bioactivity is greatest during times when sleep propensity is greatest.18,19 In rats, rabbits, and mice, central nervous system (CNS) administration of TNF-α enhances non-rapid eye movement sleep (NREMS) duration. In contrast, spontaneous NREMS duration is attenuated in mice lacking one or both TNF receptors.20,21 The TNF receptors are also important for the direction and magnitude of NREMS electroencephalogram (EEG) delta power responses to infectious challenge.21 EEG delta power (∼0.5-4 Hz frequency range) is often used as an indicator of sleep intensity.22
NREMS EEG delta power is enhanced in rabbits after either intravenous or intracerebroventricular TNF-α administration.23 However, in rats after microinjection of TNF-α into the preoptic area, NREMS EEG delta power is not affected, suggesting species-specific or route of administration-dependent sleep responses.24 Some differences in sleep responses to TNF-α also exist between mice and rats. For example, rats have enhanced NREMS EEG delta power responses to peripheral injections of TNF-α, while mice have attenuated NREMS EEG delta power responses to TNF-α.20,25
Lipopolysaccharide (LPS), a Gram-negative bacteria cell wall component, promotes NREMS and brain TNF-α mRNA and protein levels.26–31 Systemic LPS induces systemic and central TNF-α and IL1-β expressions, and these molecules could subsequently act directly within the CNS or on vagal cytokine receptors to affect sleep and brain cytokine expression.32–34
The rat literature indicates that subdiaphragmatic vagotomy prevents or attenuates NREMS responses after peripheral TNF-α, interleukin-1 beta (IL-1β), or LPS injections.25,27,28,36 Vagotomy is more effective at attenuating sleep responses to lower concentrations of TNF-α, IL-1β, or LPS in rats. The vagus is also involved in TNF-α-mediated hyperalgesia and brain expression of IL-1β mRNA after peripheral injections of IL-1β, LPS, or bacterial DNA (CpG-DNA).37–40 In rats, vagotomy also prevents peripheral body irradiation induced brain enhancements of IL-1β and TNF-α protein levels.41 However, the effects of vagotomy on peripherally applied TNF-α on brain TNF-α expression are unknown. Further, the effect vagotomy has on sleep in mice has not been examined.
Herein, we report that vagal afferents modulate brain TNF-α mRNA expression after systemic TNF-α. We also report that vagotomy attenuates NREMS duration after systemic injections of TNF or LPS in mice, although these affects are somewhat different than those previously reported in rats.
METHODS
Animals and Surgery
Thirty-two male C57BL/6J mice bred in our facilities (< 5 generations) that were originally purchased from Jackson Laboratories, (Bar Harbor, ME) were used for all experiments. The mice were between 12 and 17 weeks of age at the time experiments were performed. Mice were randomly assigned to experimental groups used for polysomnographic assessment of sleep or for molecular analyses. Mice were individually housed and maintained on a 12:12 h light: dark cycle (light onset, time = 0) at a thermoneutral temperature (29 ± 1°C). Mice were provided food and water ad libitum. All experimental protocols were approved by the Washington State University Animal Care and Use Committee and were in compliance with National Institutes of Health guidelines.
Surgeries: Vagotomy
All mice were given a liquid diet (PMI Micro-Stabilized Rodent Liquid Diet LD 101, Test Diet; Richmond, IN) at least 24 h before surgery. The liquid diet was used to minimize digestion complications following the surgeries due to lack of vagal efferent stimulation of the pyloric valve after vagotomy. Mice were maintained on the liquid diet for 72 h post-operation and then returned to solid food thereafter. Mice were anesthetized with intraperitoneal (IP) ketamine-xylazine (87 and 13 mg/kg, respectively). The abdomen was shaved and sterilized, and a 2-cm incision was made through the epidermal tissue and the peritoneum. The stomach and esophagus were exposed, and the ventral and dorsal branches of the vagus nerve were identified using a microscope. Bilateral incisions (∼1 mm length) were made, and nerve sections on each branch were extracted. The esophagus was then lowered back into the peritoneal cavity while still leaving most of the stomach exposed, making the pylorus available. A small (∼1 mm) incision was made parallel to the pylorus, puncturing the pyloric sphincter (pyloroplasty). The pylorus, peritoneum, and epidural tissue were then sutured. Antibiotic ointment was applied to incision area. Vagotomized mice had their vagal afferents severed; sham-operated mice only received the pyloroplasty and served as controls.
Vagotomy Verification: Cholecystokinin Test
Vagotomy verification occurred ≥ 10 days after surgical procedures were performed. The cholecystokinin (CCK) test of satiety was used to verify surgical success. The satiety effect of CCK is blocked by vagotomy42; therefore, the food intake of the sham mice decreased, while the successfully vagotomized mice did not alter their food intake. Mice were deprived of food 20 h prior to CCK (0.25 μg/0.2 mL saline per mouse) injection, and food intake during the subsequent 2 h was measured. Only mice that had approximately 20% enhanced food intake compared to sham mice (indicating the vagotomy surgery was successful) were used. A minimum of 3 days was allowed for the mice to recover after the test.
Surgeries: Polysomnography
Vagotomized and sham-operated mice used for polysomnographic analyses were also provided with EEG electrodes over the right and left parietal cortices, a ground electrode over the cerebellum, and an electromyogram (EMG) electrode in the nuchal muscles under ketamine-xylazine (87 and 13 mg/kg, respectively) anesthesia as previously described.15 Electrodes were fixed to the skull with dental cement and wires from the electrodes led to a commutator. The animals were tethered to amplifiers and data collected to disc using SleepSign (Kissei Comtec Co., LTD, Japan). The EEG/EMG recordings from mice took place in sound-attenuated environmental chambers. After surgeries, mice were allowed ≥ 7 days to recover and were then connected to the commutators for 2 days of acclimation.
Experimental Protocols
Experiment 1: Sleep responses to TNF-α
After acclimation, vagotomized and sham-operated mice received an IP injection of saline (0.2 mL/mouse) at dark onset, and the EEG and EMG were recorded for the next 24 hours. Thereafter, vagotomized and sham-operated mice received an injection of recombinant murine TNF-α (R & D Systems, Inc, Minneapolis, MN, USA) at 1 of 3 different concentrations (3 μg/0.2 mL saline/mouse (N = 16), 1 μg/0.2 mL saline/mouse (N = 14), or 0.5 μg/0.2 mL saline/mouse (N = 14), and EEG/ EMG were recorded for the next 24 hours. Mice receiving 3 μg TNF-α did not receive any subsequent injections of TNF-α. Mice receiving 1 μg TNF-α were given saline IP 2 days post-injection, followed by the 0.5 μg TNF-α dose 24 h later. The concentrations of TNF-α used were based on studies conducted in our laboratory that elicit sleep responses in mice.20
Experiment 2: Sleep responses to LPS
Two days after recovery from TNF-α injections, mice received an IP injection of saline (0.2 mL/mouse) at dark onset, and EEG/EMG were recorded for 24 hours. After the saline recording period, mice received an injection of LPS (0111:B4, Sigma-Aldrich, St. Louis, MO, USA) at 1 of 3 doses (1 μg LPS/0.2 mL saline/mouse [N = 18], 0.1 μg LPS/0.2 mL saline/mouse [N = 14], or 0.05 μg LPS/0.2 mL saline/mouse [N = 12]), and EEG/EMG were recorded for 24 hours. Mice receiving the 1 μg LPS dose did not receive any other dose of LPS. Mice can develop tolerance to repeated LPS injections,43 although these tolerance effects diminish after 5 days,44 and sleep responses to LPS are not affected after 10 days from the initial injection.45
Sleep Recording and Analyses
Analog EEG (filtered below 0.1 Hz and above 40 Hz) and EMG amplified signals were converted to digital signals (128 Hz sampling rate) and recorded. Sleep analyses were conducted using Sleep Sign Software (Kissei Comtec Co., Ltd, Japan). NREMS, REMS, and waking vigilance states were determined manually off-line in 10-sec epochs as previously described.15 NREMS was identified by high-amplitude EEG signals and low EMG activity. Regular low-amplitude EEG and minimal EMG activity characterized REMS. Wake periods were recognized by low-amplitude fast EEG and high EMG activity. Vigilance state durations were calculated in 2-h time blocks. Vigilance state episode durations and frequencies were calculated in 12 -h light and dark time blocks. Fast Fourier transformations of EEG signals (μV2) were calculated for each NREMS epoch and mean delta (0.5-4 Hz) slow wave activity (also called NREMS EEG slow wave activity [SWA]) as previously described.15 Differences in NREMS EEG SWA after TNF-α and LPS injections from that observed after saline injections were determined for each vagotomized and sham-operated mouse and analyzed as previously described.27 NREMS EEG power in 0.5 Hz frequency bins within the power range of 0.5-20 Hz across time was determined during the 12-h light and dark periods after saline injections as previously described.15 Additionally, the total power from the sum of each 0.5 Hz frequency bin across the 0.5-20 Hz power range after saline injections was used to normalize each individual frequency bin for NREMS EEG power after TNF -α and LPS injections for each individual mouse as previously described. 15 NREMS EEG power was determined for the first 12 h post- 3 μg TNF and 1 μg LPS injections.
Experiment 3: mRNA expression in response to TNF-α
Mice from the vagotomized (N = 8) and sham (N = 8) groups received IP injections of saline (0.2 mL saline/mouse), which served as controls, or carrier-free recombinant murine TNF-α (R & D Systems, Inc; 3 μg TNF-α/0.2mL saline/mouse or 1 μg TNF-α/0.2 mL saline/mouse). Two h after the injections, the mice were sacrificed.
Experiment 4: mRNA expression in response to LPS
Mice from the vagotomized (N = 8) and sham (N = 8) groups received IP injections of LPS (0111:B4, Sigma-Aldrich; 1 μg LPS/0.2 mL saline/mouse or 0.01 μg LPS/0.2 mL saline/ mouse) at dark onset. The mice that received saline injections in Experiment 3 also served as controls for mice in Experiment 4 that received LPS.
Tissue Collection and mRNA Analyses
The mice were decapitated and their liver and brains were removed and dissected. The hypothalamus, somatosensory cortices, nucleus tractus solitarius (NTS), and liver were then flash frozen in liquid nitrogen and stored at -80°C. Real-time polymerase chain reaction (RT-PCR) was used to analyze IL-1β and TNF-α mRNA levels. The primers used for these experiments were as follows: IL-1β [forward: (5′-3′) CAACCAACACGTGATATTCTCCATG; reverse: (5′-3′) GATCCACACTCTCCAGCTGCA]; TNF-α forward: (5′-3′) GGGACAGTGACCTGGACTGT; reverse: (5′-3′) GCTCCAGTGAATTCGGAAAG]. Briefly, the tissue was homogenized, RNA was extracted with Trizol reagent, and cDNA was made and analyzed for IL-1β and TNF-α mRNAs, as previously described.15 The comparison of the expression of mRNAs was made with cyclophilin A using the delta threshold cycle (Ct) value method.46
Statistics
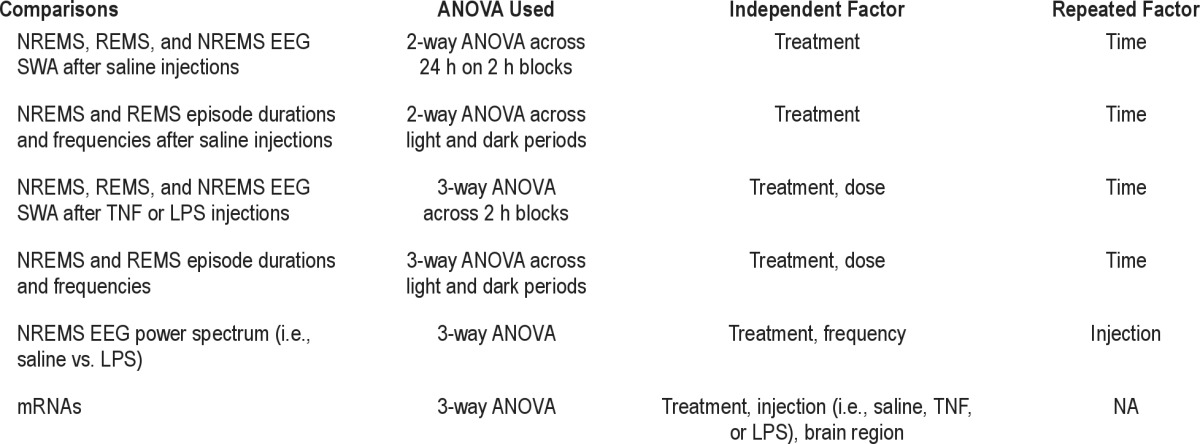
Two-way and three-way ANOVAs were used to analyze NREMS and REMS durations, episode frequencies and durations, NREMS EEG SWA, NREMS EEG power spectra, and mRNAs (Table 1). Post hoc comparisons were made with independent or paired t-tests when appropriate. P < 0.05 was considered to be significant.
Table 1.
ANOVAs used for data analyses
RESULTS
Sleep in Vagotomy and Sham-Operated Mice
Spontaneous NREMS and REMS durations after saline injections were similar in vagotomized and sham-operated mice (Figure 1). Both groups exhibited the typical murine diurnal variations in NREMS over time (time: F1,86 = 150.896, P < 0.001) and REMS (time: F1,86 = 165.563, P < 0.001), with greater durations of sleep occurring during the daylight hours. No significant differences in NREMS or REMS duration were found between the 2 surgical groups. Further, no significant differences in NREMS or REMS episode durations or episode frequencies were found between these groups (Supplemental Tables S1 and S2).
Figure 1.
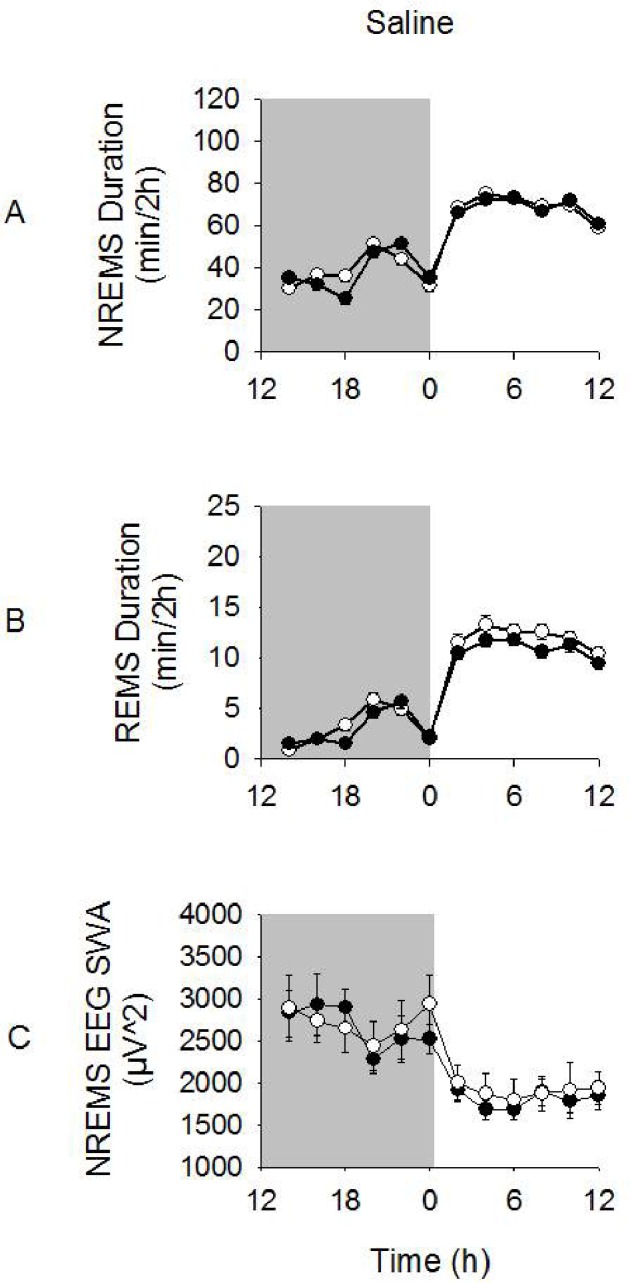
NREMS and REMS durations and NREMS EEG SWA after ip saline injections. Vagotomized and sham-operated mice exhibited enhanced NREMS and REMS durations during the light periods compared to dark periods. NREMS EEG SWA was enhanced during the dark period compared to the light period. However, there were no significant differences in these variables between vagotomized and sham-operated groups. Significance was set at P < 0.05. White circles = sham-operated group; dark circles = vagotomy group.
Spontaneous NREMS EEG SWA after saline injections was also similar between vagotomized and sham-operated mice (Figure 1). The characteristic murine diurnal variations in NREMS EEG SWA occurred over time in both groups, with greater values found during the dark period than the light period (time: F1,86 = 37.152, P < 0.001). No significant differences in NREMS EEG SWA between the surgical groups were found. NREMS EEG spectral power was greater during the dark period vs. the light period after saline injections for both vagotomized and sham-operated groups (light vs. dark × frequency: F39,3440 = 42.037, P < 0.001; data not shown). Vagotomized mice had slightly greater NREMS EEG power in the 0.5-20 Hz range that was largely attributed to an enhancement in the 2.0-2.5 Hz bin range during both dark and light period compared with that of sham-operated mice (treatment × frequency: F39,3440 = 2.171, P < 0.001).
Sleep Responses to TNF-α
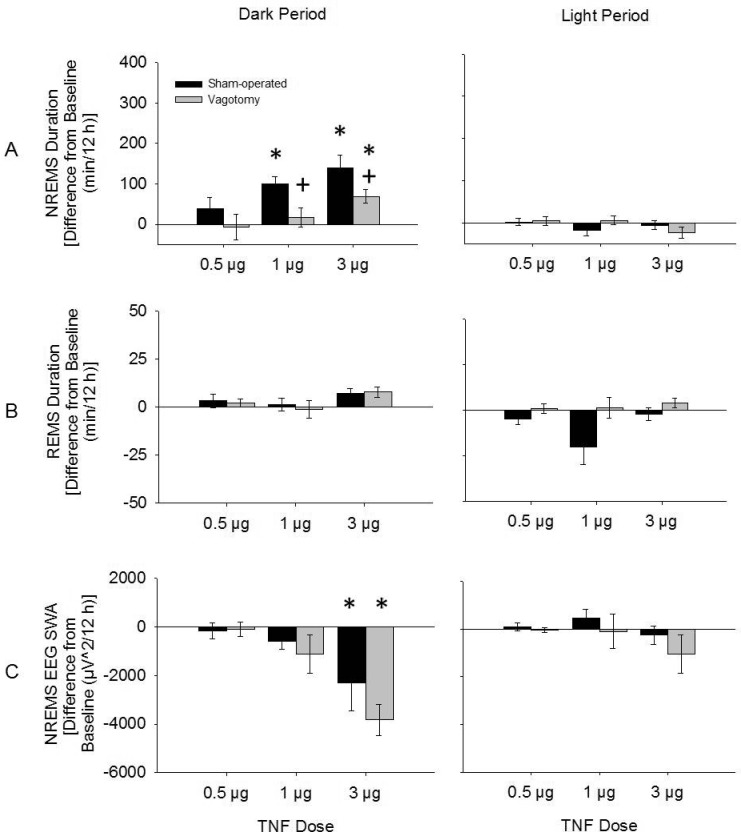
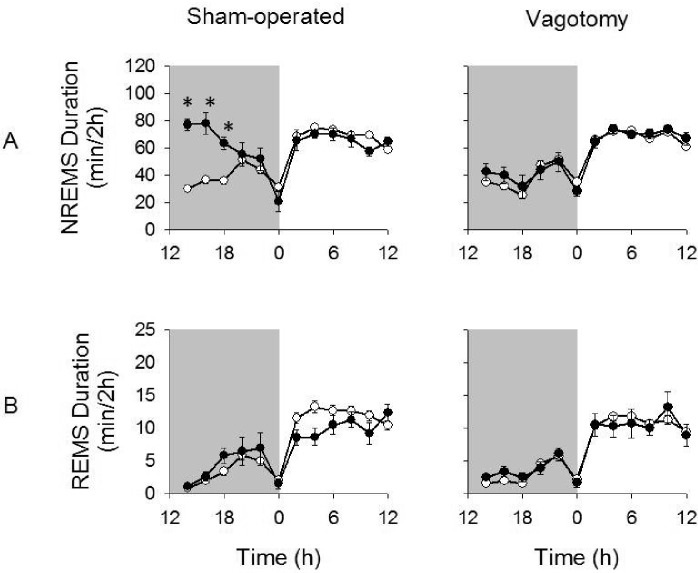
TNF-α enhanced NREMS duration dose-dependently in both vagotomized and sham-operated mice (dose: F3,124 = 15.506, P < 0.001; Figure 2). Further, higher doses of TNF-α induced more prolonged effects in both treatment groups (time × dose: F3,124 = 8.510, P < 0.001). However, after TNF-α treatment, duration of NREMS was less in vagotomized mice than that occurring in TNF- α treated sham-operated mice (treatment: F1,124 = 17.144, P < 0.001). These differential effects were dose dependent, and the TNF-α -enhanced NREMS persisted for a shorter period of time in the vagotomized mice compared to the sham-operated mice (time × dose: F3,124) = 4.157, P = 0.008; time × treatment: F1,124 = 6.471, P = 0.012). For instance, after the 1 μg TNF-α dose, post hoc analysis indicated that in vagotomized mice changes in NREMS duration during the first 12 h post-injection were not significant (16.5 ± 24.0 min), whereas in sham-operated mice NREMS responses were robust (99.9 ± 18.8 min; t (12) = 2.736, P = 0.018) (Figure 3). In contrast, after the lower TNF -α dose, NREMS was not significantly enhanced in either surgical treatment group (Figure 2). No differences in REMS duration were found after any TNF-α dose compared to saline for either vagotomized or sham-operated mice (Figures 2, 3).
Figure 2.
Changes in NREMS (A) and REMS (B) duration and NREMS EEG SWA (C) during dark periods and light periods after TNF-α injections from those after saline injections. NREMS duration was significantly enhanced during the dark period after 3 μg and 1 μg doses of TNF-α; vagotomy attenuated these responses. NREMS EEG SWA was reduced only after 3 μg and dose of TNF-α and this measurement did not differ between vagotomy and sham-operated groups. (*) = significant difference between saline and TNF-α injections. (+) = significant difference between vagotomy and sham-operated groups. Significance was set at P < 0.05. Black bars = sham-operated group; gray bars = vagotomy group.
Figure 3.
NREMS and REMS duration after the 1 μg dose of TNF-α given at 12:00 h. The 1 μg dose of TNF-α significantly enhanced NREMS duration in sham-operated but not vagotomized mice (A). However, vagotomized mice had significantly attenuated NREMS duration responses compared to sham-operated mice. REMS durations were similar to those after saline injections and did not differ between treatment groups (B). (*) = significant difference in the change in NREMS duration for 2-h time bins between vagotomized and sham-operated mice after TNF-α injections compared to saline injections. Significance was set at P < 0.05. White circles = post-saline responses; dark circles = post-TNF-α responses.
The 3 μg dose of TNF-α attenuated NREMS EEG SWA over the first 12-h period post-injection (dark period) compared to values obtained after saline injections in both vagotomy and sham-operated groups (F1,14 = 24.905, P < 0.001; Figure 2). However, these responses were not different between vagotomized and sham-operated groups. Further, no differences in NREMS EEG SWA were found after 1 μg or 0.5 μg TNF-α injection, nor were any differences in NREMS EEG SWA found between vagotomy and sham-operated groups after these doses.
NREMS EEG spectral power (0.5-20 Hz) was attenuated during the first 12 h after 3-μg TNF-α injections compared to saline injections in both vagotomy and sham-operated groups (F1,560 = 66.130, P < 0.001; Figure 4). This TNF-α-induced reduction in NREMS EEG spectral power occurred within both the delta power range and higher frequencies (injection × frequency: F39,560 = 4.596, P < 0.001; injection × treatment: F1,560 = 10.862, P = 0.001; injection × frequency × treatment: F39,560 = 2.117, P < 0.001), although these effects within the delta power range were greater in vagotomized mice than those of sham-operated mice. No significant differences in NREMS EEG spectral power were found after 1 μg or 0.5 μg TNF-α injections compared to those after saline injections (data not shown).
Figure 4.
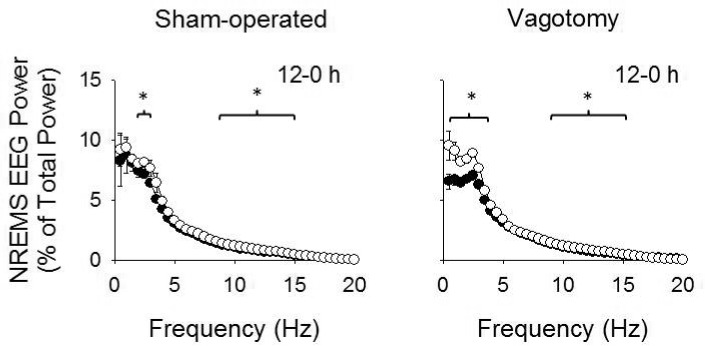
NREMS EEG power spectrum after 3 μg TNF-α and saline injections. Peripheral injections of TNF-α attenuated NREMS EEG power within the delta power range and also at higher frequencies during the first 12 h post-TNF-α injection compared to saline. Vagotomized mice exhibited greater reductions in the delta power range than sham-operated mice. (*) indicates differences in NREMS EEG spectral power for each individual time bin for sham-operated and vagotomy groups. Significance was set at P < 0.05. White circles = post-saline responses; dark circles = post-TNF-α responses.
Sleep Responses to LPS
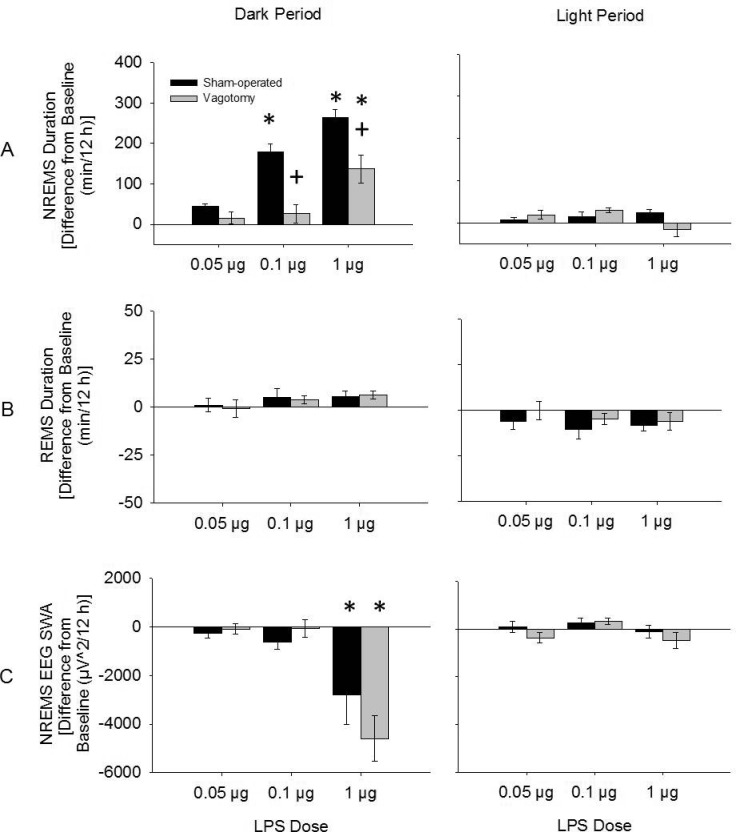
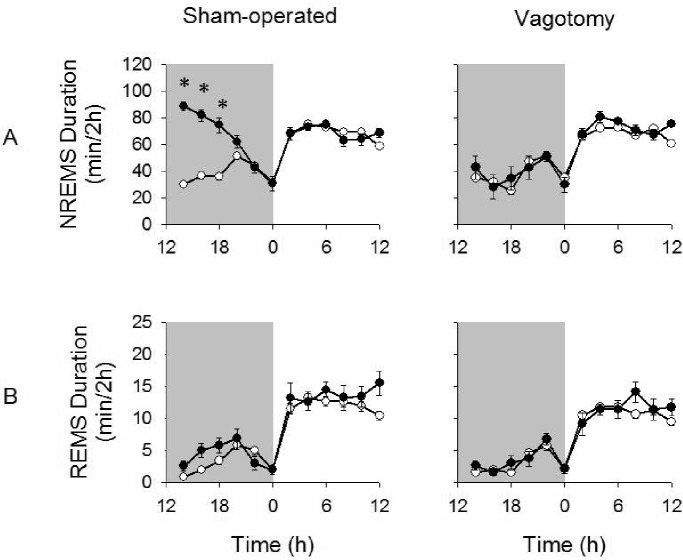
LPS dose-dependently enhanced NREMS duration (dose: F3,124 = 37.050, P < 0.001; Figure 5). In vagotomized mice the NREMS duration responses to LPS were less than those of sham-operated mice (treatment: F1,124 = 20.437, P < 0.001). For example, after the 0.1 μg LPS dose, vagotomized mice had reduced NREMS duration (26.0 ± 22.1 min) compared to sham-operated mice (179.6 ± 19.6 min) over the first 12 h post-injection (t (12) = 5.321, P < 0.001; Figure 6). Further, 2- and 3-way interactions between the treatment, time, and dose were found, indicating higher doses of LPS enhanced NREMS duration for longer periods of time and these effects were attenuated in vagotomized mice compared to sham-operated mice (time × group × dose: F3,124 = 3.483, P = 0.018; time × dose: F3,124 = 13.427, P < 0.001: treatment × dose: F3,124 = 10.228, P < 0.001; time × treatment: F1,124 = 10.710, P = 0.001; Figure 5).
Figure 5.
Changes in NREMS (A) and REMS (B) duration and NREMS EEG SWA (C) during dark periods and light periods after LPS injections from those after saline injections. NREMS duration was significantly enhanced during the dark period after 1 μg and 0.1 μg doses of LPS. Vagotomy attenuated these responses. NREMS EEG SWA was reduced only after the 1 μg dose of LPS. However, NREMS EEG SWA responses to LPS were similar between treatment groups. (*) = significant difference between saline and LPS injections. (+) = significant difference between vagotomy and sham-operated groups. Significance was set at P < 0.05. Black bars = sham-operated group; gray bars = vagotomy group.
Figure 6.
NREMS and REMS duration after the 0.1 μg dose of LPS given at 12:00 h. LPS (0.1 μg) significantly enhanced NREMS duration in sham-operated but not vagotomized mice (A). REMS duration were similar to those after saline and did not differ between treatment groups (B). (*) = significant difference in the change in NREMS duration for 2-h time bins between vagotomized and sham-operated mice after LPS injections compared to saline injections. Significance was set at P < 0.05. White circles = post-saline responses; dark circles = post-LPS responses.
LPS dose-dependently attenuated the duration of REMS during the light period post-injection (F3,124 = 4.068, P = 0.009; Figure 5), although post hoc analysis did not reveal any significant differences in REMS duration for any of the doses of LPS compared to saline injections. No significant differences in REMS duration were found between vagotomized and sham-operated mice.
LPS also dose-dependently reduced NREMS EEG SWA during the first 12 h post-injection (dose: F3,124 = 7.190, P < 0.001; Figure 5). For example, the 1 μg dose of LPS attenuated NREMS EEG SWA over the first 12 h post-injection compared to saline injections in both sham-operated and vagotomized mice (time × injection: F1,16 = 22.488, P < 0.001). There were no differences in NREMS EEG SWA after the other LPS doses or between the surgical treatment groups.
The 1 μg dose of LPS attenuated NREMS EEG spectral power (0.5-20 Hz range) during the first 12 h post-injections compared to saline injections (dose: F1,640 = 187.081, P < 0.001; Figure 7). Vagotomized mice exhibited greater attenuations in NREMS EEG spectral power than sham-operated mice and this effect differed between groups within the delta power range (dose × frequency: F39,640 = 10.384, P < 0.001; treatment × dose: F1,640 = 6.845, P = 0.009; treatment × frequency × dose: F39,640 = 1.851, P = 0.002). NREMS EEG spectral power after 0.1 and 0.05 μg doses of LPS were similar to the values after saline injections (data not shown).
Figure 7.
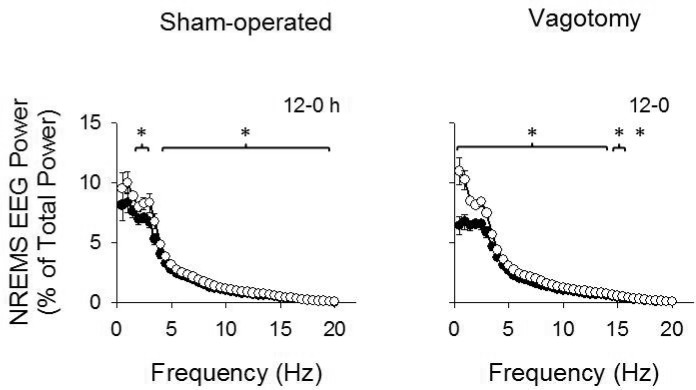
NREMS EEG power spectrum after 1 μg LPS and saline injections. Peripheral injections of LPS attenuated NREMS EEG power over most of the 0.5-20 Hz frequency ranges during the first 12 h post-LPS injection compared to saline. This effect was greater in vagotomized mice than sham-operated mice. (*) indicated differences in NREMS EEG spectral power for each individual time bin for sham-operated and vagotomy groups. Significance was set at P < 0.05. White circles = post-saline responses; dark circles = post- LPS responses.
Gene Expression Responses to TNF-α and LPS
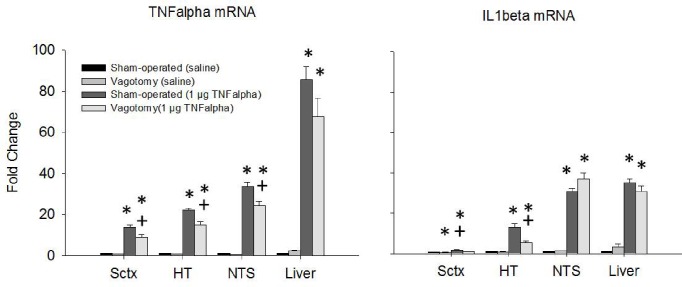
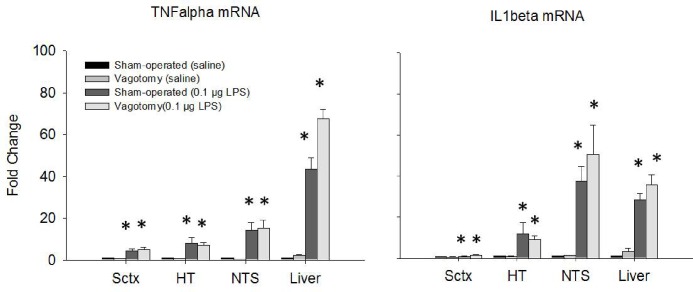
Figure 8 shows fold changes in IL-1β and TNF-α mRNA expression after the 1 μg TNF dose, and Figure 9 shows these values after the 0.1 μg LPS dose. Figures 9 and 10 correspond with Figures 3 and 6 in that the effects of those middle doses of TNF-α and LPS are shown. The 1 μg dose of TNF-α enhanced TNF-α mRNA expression in the somatosensory cortex, hypothalamus, NTS, and liver of both sham-operated mice and vagotomized mice (F1,99 = 420.742, P < 0.001). However, TNF-α mRNA levels were enhanced significantly less in the vagotomized mice in the somatosensory cortex, hypothalamus and NTS compared to sham-operated mice (treatment: F1,99 = 9.155, P = 0.003). In contrast, TNF-α -induced TNF-α mRNA expression was similar in the liver whether the mice were vagotomized or sham-operated. The 1-μg dose of TNF-α also enhanced IL-1β mRNA expression in the somatosensory cortex, hypothalamus, NTS, and liver (F1,101 = 777.464, P < 0.001). Vagotomy significantly reduced the TNF-α-induced enhancements of IL-1β mRNA levels in the somatosensory cortex and hypothalamus (injection × treatment: F1,101 = 5.662, P = 0.019; injection × treatment × region: F3,101 = 3.819, P = 0.012). The 3-μg dose of TNF-α also enhanced TNF-α mRNA and IL-1 β mRNA expressions in all areas of brain and the liver (data not shown). However, the differences between the surgical treatment groups were not significant except in the NTS, where the up-regulation in IL1β mRNA was significantly less in the vagotomized mice compared to the sham-operated controls.
Figure 8.
mRNA expression after saline and IP 1 μg TNF-α injections. TNF-α mRNA expression was enhanced in all tissues assayed. Vagotomy attenuated the brain TNF-α mRNA expression but not in the liver in the periphery. IL-1β mRNA expression was enhanced after TNF-α injections in all the tissues assayed but vagotomy only inhibited IL-1β mRNA expression in the Sctx and HT. (*) = significant difference between saline controls and 1 μg TNF-α injections. (+) = significant difference between sham-operated and vagotomy groups. Significance was set at P < 0.05.
Figure 9.
mRNA expression after saline and ip 0.1 μg LPS injections. TNF-α and IL-1β mRNA expressions were enhanced in all tissues assayed. There were no significant differences in mRNAs between surgical treatment groups. (*) = significant difference between saline controls and 0.1 μg LPS injections. Significance was set at P < 0.05.
Both the 0.1 μg LPS dose and the 1 μg LPS dose (data not shown) up-regulated TNF-α and IL1β mRNA expressions in every tissue examined (TNFα mRNA: F1,99 = 213.359, P < 0.001; IL1β mRNA F1,99 = 71.095). However, there were no significant differences in mRNA expressions between vagotomized and sham-operated mice with the exception of IL1β mRNA expression in the NTS. TNF-α and IL-1β mRNA expression significantly increased in the NTS after either 0.1 μg or 1 μg doses of LPS but the vagotomy inhibited these mRNAs in the NTS only after the 1 μg LPS dose when compared to sham-operated controls.
DISCUSSION
To our knowledge the present findings are the first to show that systemic TNF-α-induced sleep responses are dependent, in part, upon vagal afferents in mice. Our murine findings are consistent with similar findings obtained using vagotomized rats given various peripheral inflammatory stimuli including IL-1β, TNF-α, LPS, and highly palatable diets.25,27,28,36,47 Further, in rats, systemic TNF-α and LPS induce brain production of TNF-α and IL-1β mRNAs.39,48 Herein, we extend these results by showing that the capacity of systemic TNF-α to induce central TNF-α and IL-1β mRNAs is mediated, in part, by vagal afferents in mice. Collectively these data suggest pro-inflammatory substances can stimulate vagal afferents to affect brain cytokine responses and NREMS responses—this mechanism is likely involved in a variety of pathologies characterized by altered systemic cytokine levels and sleepiness.
Spontaneous sleep in vagotomized mice was similar to the sleep in control mice with the exception of small increases in EEG delta power during NREMS occurring after vagotomy. Similar increases in NREMS EEG SWA occur in vagotomized rats.27 It is difficult to speculate about the less robust differences in NREMS EEG SWA occurring in mice compared to those reported in rats since the exact mechanisms governing SWA remain unidentified. However, spontaneous NREMS, REMS, and NREMS EEG SWA in vagotomized rats is also reported to be similar to sham-operated rats.36 Notwithstanding, the current results suggest a role for vagal afferents in the regulation of this sleep phenotype although the effects seem small.
Our results are consistent with the prior observations from cats and humans showing that stimulation of vagal afferents affect sleep.49–52 Regardless of the physiological roles of vagal afferents in the regulation of NREMS EEG SWA, current results clearly indicate that vagal afferents can mediate systemic inflammatory signals effects on sleep although there are distinct differences between rats and mice. Thus, vagotomized rats respond to systemic TNF-α with enhanced EEG SWA during NREMS and suppressed EEG power in higher frequency bands.25 In contrast, vagotomized mice responded to systemic TNF-α with decreased EEG delta power during NREMS. Further, in rats systemic LPS increases EEG SWA during NREMS, and this effect is blocked by vagotomy.28 In contrast, in mice LPS reduces EEG SWA during NREMS, and this effect is not altered by vagotomy. The mechanisms responsible for EEG SWA during NREMS remain controversial but likely are linked to cerebral blood flow as well as synchronization of up and down states occurring in cortical pyramidal neurons53–55; why either would be different in mice compared to rats in response to systemic TNF-α or LPS is not clear. Regardless, the sleep responses of mice and rats to TNF-α or LPS are in other ways similar with both species showing large vagal afferent-dependent increases in duration of NREMS and very little effect on REMS in response to systemic inflammatory stimuli.
The enhanced levels of TNF-α and IL-1β mRNAs in the brain after systemic TNF-α or LPS reported herein confirm earlier work done in rats or mice.34,39,48,56,57 The current results extend those observations by showing increases in these cytokine mRNAs in specific areas of brain, including the somatosensory cortex, hypothalamus and the NTS, and that these increases can be induced in mice by either systemic TNF-α or LPS. Systemic administration of both of these inflammatory molecules also enhanced liver mRNA levels of these cytokines, although the vagotomy had no effect on liver TNF-α or IL-1β mRNA expressions, suggesting that the subdiaphragmatic vagal afferents do not affect peripheral inflammation.
The effects of vagotomy on TNF-α- or LPS-induced brain TNF-α or IL-1β mRNA expressions were, however, distinct. The attenuated expressions of IL-1β and TNF-α mRNAs occurring in various brain regions in vagotomized mice after systemic TNF-α did not occur after systemic LPS. Regardless, the attenuation of systemic TNF-α-induced hypothalamic and NTS cytokine mRNAs in vagotomized mice is similar to the attenuation of systemic IL-1β-enhanced hypothalamic and brain stem, which contains the NTS, IL-1β mRNA levels observed in vagotomized rats.38 These data collectively suggest that, via the NTS, cytokine receptors on vagal afferents signal the brain expression of cytokines in areas of brain involved in the acute phase responses, including NREMS responses.58 This conclusion is reinforced by the observations that systemic inflammatory signal induction of liver pro-inflammatory cytokines is not altered by vagotomy.38 The differences in brain cytokine expressions between vagotomy and control mice were likely due to differential expression of glial and neuronal expressions of IL-1β and TNF-α mRNAs59,60 and not due to changes in expression in blood cells trapped in the brain during tissue preparation because liver cytokine expressions were similar in the liver. The liver was prepared as the brain was. However, the potential influence of blood cytokines levels limits the interpretation of these findings.
After lower doses of TNF-α, vagotomy is effective at attenuating both NREMS responses and TNF-α-induced brain cytokine expressions. However, after the higher doses of TNF-α, vagotomy fails to block these responses. The persistence of sleep responses in vagotomized mice after higher TNF-α doses is consistent with prior data obtained from rats.25 Further, after low doses of LPS, NREMS responses are attenuated by vagotomy but not after higher LPS doses; these data are also consistent with prior reports.27,28 These data suggest that TNF-α and LPS access the brain by mechanisms in addition to stimulation of vagal afferents. For instance, high doses of TNF-α or LPS increase the permeability of the blood brain barrier.61,62 Further, lipid soluble and low molecular weight substances are more likely to cross the blood brain barrier.64 Thus, substances such as LPS, being lipid soluble, likely more easily pass through the blood brain barrier. Indeed, higher levels of peripherally injected LPS cross the blood brain barrier in mice.35 In addition, these substances may access the brain via leaky areas of the blood-brain-barrier nucleus including the NTS, subfornical organ, and organum vasculosum of the lamina terminalis.63,65 Nevertheless, projections exist from the brainstem/NTS to sleep regulatory areas including the somatosensory cortex and hypothalamus and these projections likely are involved in the systemic TNF-α-induced changes in TNF-α mRNA expression in these brain areas.
Many diseases involving peripheral inflammation are associated with up-regulation of pro-inflammatory cytokines including TNF-α.66 Such changes are characteristic of pathologies such as chronic fatigue syndrome, insomnia, and obstructive sleep apnea.67–69 Further, other diseases associated with enhanced pro-inflammatory cytokines, such as autoimmune deficiency syndrome, cancer, myocardial infarct, and alcoholism are also associated with disrupted sleep.70 For these diseases, therapies are being studied that involve targeting the cytokines by administering cytokine inhibitors.71 For example, systemic administration of etanercept, a TNF soluble receptor, to sleep apneic patients alleviates the fatigue and sleepiness associated with sleep apnea.72 We conclude that the vagal afferents have an important role in stimulating brain cytokines induced by TNF-α and LPS. Further, we report that the vagal afferents have a crucial role in low grade peripheral inflammation altering brain cytokines to induce sleep.
DISCLOSURE STATEMENT
This was not an industry supported study. Dr. Krueger has received research support from Amgen Inc., and has received honorarium from Johnson & Johnson. The other authors have indicated no financial conflicts of interest.
ACKNOWLEDGMENTS
This work was supported by the National Institutes of Health, Grants NS025378, NS031453 and HD036520 to JMK. We thank Dr. Christopher J. Davis for his review of the manuscript and Andrew Elmer for his assistance with animal procedures. Dr. Zielinski's current address is the Department of Psychiatry, Harvard Medical School and Veterans Affairs Boston Healthcare System, West Roxbury, MA 02132. Gianne Souza' current address is Biomedical Sciences Graduate Program, University of California, San Francisco, CA 94143-0505.
SUPPLEMENTAL MATERIAL
NREMS episode frequencies and durations after saline, TNF-α, or LPS injections (mean ± SE)
REMS episode frequencies and durations after saline, TNF-α, or LPS injections (mean ± SE)
REFERENCES
- 1.Khalyfa A, Serpero LD, Kheirandish-Gozal L, Capdevila OS, Gozal D. TNF-α gene polymorphisms and excessive daytime sleepiness in pediatric obstructive sleep apnea. J Pediatr. 2011;158:77–82. doi: 10.1016/j.jpeds.2010.07.032. [DOI] [PMC free article] [PubMed] [Google Scholar]
- 2.Bhushan B, Guleria R, Misra A, Luthra K, Vikram NK. TNF-alpha gene polymorphism and TNF-alpha levels in obese Asian Indians with obstructive sleep apnea. Respir Med. 2009;103:386–92. doi: 10.1016/j.rmed.2008.10.001. [DOI] [PubMed] [Google Scholar]
- 3.Chennaoui M, Sauvet F, Drogou C, et al. Effect of one night of sleep loss on changes in tumor necrosis factor alpha (TNF-α) levels in healthy men. Cytokine. 2011;56:318–24. doi: 10.1016/j.cyto.2011.06.002. [DOI] [PubMed] [Google Scholar]
- 4.Irwin MR, Carrillo C, Olmstead R. Sleep loss activates cellular markers of inflammation: sex differences. Brain Behav Immun. 2010;24:54–7. doi: 10.1016/j.bbi.2009.06.001. [DOI] [PMC free article] [PubMed] [Google Scholar]
- 5.Haack M, Pollmächer T, Mullington JM. Diurnal and sleep-wake dependent variations of soluble TNF- and IL-2 receptors in healthy volunteers. Brain Behav Immun. 2004;18:361–7. doi: 10.1016/j.bbi.2003.12.009. [DOI] [PubMed] [Google Scholar]
- 6.Shearer WT, Reuben JM, Mullington JM, et al. Soluble TNF-alpha receptor 1 and IL-6 plasma levels in humans subjected to the sleep deprivation model of spaceflight. J Allergy Clin Immunol. 2001;107:165–70. doi: 10.1067/mai.2001.112270. [DOI] [PubMed] [Google Scholar]
- 7.Minoguchi K, Tazaki T, Yokoe T, et al. Elevated production of tumor necrosis factor-alpha by monocytes in patients with obstructive sleep apnea syndrome. Chest. 2004;126:1473–9. doi: 10.1378/chest.126.5.1473. [DOI] [PubMed] [Google Scholar]
- 8.Vgontzas AN, Papanicolaou DA, Bixler EO, Kales A, Tyson K, Chrou-sos GP. Elevation of plasma cytokines in disorders of excessive daytime sleepiness: role of sleep disturbance and obesity. J Clin Endocrinol Metab. 1997;82:1313–6. doi: 10.1210/jcem.82.5.3950. [DOI] [PubMed] [Google Scholar]
- 9.Kim S, Keku TO, Martin C, et al. Circulating levels of inflammatory cytokines and risk of colorectal adenomas. Cancer Res. 2008;68:323–8. doi: 10.1158/0008-5472.CAN-07-2924. [DOI] [PMC free article] [PubMed] [Google Scholar]
- 10.Swaroop JJ, Rajarajeswari D, Naidu JN. Association of TNF-α with insulin resistance in type 2 diabetes mellitus. Indian J Med Res. 2012;135:127–30. doi: 10.4103/0971-5916.93435. [DOI] [PMC free article] [PubMed] [Google Scholar]
- 11.Kozachik SL, Bandeen-Roche K. Predictors of patterns of pain, fatigue, and insomnia during the first year after a cancer diagnosis in the elderly. Cancer Nurs. 2008;31:334–44. doi: 10.1097/01.NCC.0000305769.27227.67. [DOI] [PMC free article] [PubMed] [Google Scholar]
- 12.Nakanishi-Minami T, Kishida K, Funahashi T, Shimomura I. Sleep-wake cycle irregularities in type 2 diabetics. Diabetol Metab Syndr. 2012;4:18–24. doi: 10.1186/1758-5996-4-18. [DOI] [PMC free article] [PubMed] [Google Scholar]
- 13.Krueger JM. The role of cytokines in sleep regulation. Curr Pharm Des. 2008;14:3408–16. doi: 10.2174/138161208786549281. [DOI] [PMC free article] [PubMed] [Google Scholar]
- 14.Yehuda S, Sredni B, Carasso RL, Kenigsbuch-Sredni D. REM sleep deprivation in rats results in inflammation and interleukin-17 elevation. J Interferon Cytokine Res. 2009;29:393–8. doi: 10.1089/jir.2008.0080. [DOI] [PubMed] [Google Scholar]
- 15.Zielinski MR, Taishi P, Clinton JM, Krueger JM. 5'-Ectonucleotidase-knockout mice lack non-REM sleep responses to sleep deprivation. Eur J Neurosci. 2012;35:1789–98. doi: 10.1111/j.1460-9568.2012.08112.x. [DOI] [PMC free article] [PubMed] [Google Scholar]
- 16.Ramesh V, Nair D, Zhang SX, et al. Disrupted sleep without sleep curtailment induces sleepiness and cognitive dysfunction via the tumor necrosis factor-alpha pathway. J Neuroinflammation. 2012;11:91. doi: 10.1186/1742-2094-9-91. [DOI] [PMC free article] [PubMed] [Google Scholar]
- 17.Zielinski MR, Krueger JM. Sleep and innate immunity. Front Biosci (Schol Ed) 2011;3:632–42. doi: 10.2741/s176. [DOI] [PMC free article] [PubMed] [Google Scholar]
- 18.Floyd RA, Krueger JM. Diurnal variation of TNF alpha in the rat brain. Neuroreport. 1997;8:915–8. doi: 10.1097/00001756-199703030-00020. [DOI] [PubMed] [Google Scholar]
- 19.Bredow S, Guha-Thakurta N, Taishi P, Obál F, Jr, Krueger JM. Diurnal variations of tumor necrosis factor alpha mRNA and alpha-tubulin mRNA in rat brain. Neuroimmunomodulation. 1997;4:84–90. doi: 10.1159/000097325. [DOI] [PubMed] [Google Scholar]
- 20.Fang J, Wang Y, Krueger JM. Mice lacking the TNF 55 kDa receptor fail to sleep more after TNFalpha treatment. J Neurosci. 1997;17:5949–55. doi: 10.1523/JNEUROSCI.17-15-05949.1997. [DOI] [PMC free article] [PubMed] [Google Scholar]
- 21.Kapás L, Bohnet SG, Traynor TR, et al. Spontaneous and influenza virus-induced sleep are altered in TNF-alpha double-receptor deficient mice. J Appl Physiol. 2008;105:1187–98. doi: 10.1152/japplphysiol.90388.2008. [DOI] [PMC free article] [PubMed] [Google Scholar]
- 22.Davis CJ, Clinton JM, Jewett KA, Zielinski MR, Krueger JM. Delta wave power: an independent sleep phenotype or epiphenomenon? J Clin Sleep Med. 2011;7:S16–8. doi: 10.5664/JCSM.1346. [DOI] [PMC free article] [PubMed] [Google Scholar]
- 23.Shoham S, Davenne D, Cady AB, Dinarello CA, Krueger JM. Recombinant tumor necrosis factor and interleukin 1 enhance slow-wave sleep. Am J Physiol. 1987;253:R142–9. doi: 10.1152/ajpregu.1987.253.1.R142. [DOI] [PubMed] [Google Scholar]
- 24.Kubota T, Li N, Guan Z, Brown RA, Krueger JM. Intrapreoptic microinjection of TNF-alpha enhances non-REM sleep in rats. Brain Res. 2002;932:37–44. doi: 10.1016/s0006-8993(02)02262-x. [DOI] [PubMed] [Google Scholar]
- 25.Kubota T, Fang J, Guan Z, Brown RA, Krueger JM. Vagotomy attenuates tumor necrosis factor-alpha-induced sleep and EEG delta-activity in rats. Am J Physiol Regul Integr Comp Physiol. 2001;280:R1213–20. doi: 10.1152/ajpregu.2001.280.4.R1213. [DOI] [PubMed] [Google Scholar]
- 26.Lancel M, Mathias S, Schiffelholz T, Behl C, Holsboer F. Soluble tumor necrosis factor receptor (p75) does not attenuate the sleep changes induced by lipopolysaccharide in the rat during the dark period. Brain Res. 1997;770:184–91. doi: 10.1016/s0006-8993(97)00783-x. [DOI] [PubMed] [Google Scholar]
- 27.Opp MR, Toth LA. Somnogenic and pyrogenic effects of interleukin-1beta and lipopolysaccharide in intact and vagotomized rats. Life Sci. 1998;62:923–36. doi: 10.1016/s0024-3205(98)00010-1. [DOI] [PubMed] [Google Scholar]
- 28.Kapás L, Hansen MK, Chang HY, Krueger JM. Vagotomy attenuates but does not prevent the somnogenic and febrile effects of lipopolysaccharide in rats. Am J Physiol. 1998;274:R406–11. doi: 10.1152/ajpregu.1998.274.2.R406. [DOI] [PubMed] [Google Scholar]
- 29.Krueger JM, Kubillus S, Shoham S, Davenne D. Enhancement of slow-wave sleep by endotoxin and lipid A. Am J Physiol. 1986;251:R591–7. doi: 10.1152/ajpregu.1986.251.3.R591. [DOI] [PubMed] [Google Scholar]
- 30.Imeri L, Bianchi S, Opp MR. Inhibition of caspase-1 in rat brain reduces spontaneous nonrapid eye movement sleep and nonrapid eye movement sleep enhancement induced by lipopolysaccharide. Am J Physiol Regul Integr Comp Physiol. 2006;291:R197–204. doi: 10.1152/ajpregu.00828.2005. [DOI] [PubMed] [Google Scholar]
- 31.Schiffelholz T, Lancel M. Sleep changes induced by lipopolysaccharide in the rat are influenced by age. Am J Physiol Regul Integr Comp Physiol. 2001;280:R398–403. doi: 10.1152/ajpregu.2001.280.2.R398. [DOI] [PubMed] [Google Scholar]
- 32.Singh AK, Jiang Y. How does peripheral lipopolysaccharide induce gene expression in the brain of rats? Toxicology. 2004;201:197–207. doi: 10.1016/j.tox.2004.04.015. [DOI] [PubMed] [Google Scholar]
- 33.Sah SP, Tirkey N, Kuhad A, Chopra K. Effect of quercetin on lipopolysac-charide induced-sickness behavior and oxidative stress in rats. Indian J Pharmacol. 2011;43:192–6. doi: 10.4103/0253-7613.77365. [DOI] [PMC free article] [PubMed] [Google Scholar]
- 34.Taishi P, Davis CJ, Bayomy O, et al. Brain-specific interleukin-1 receptor accessory protein in sleep regulation. J Appl Physiol. 2012;112:1015–22. doi: 10.1152/japplphysiol.01307.2011. [DOI] [PMC free article] [PubMed] [Google Scholar]
- 35.Banks WA, Robinson SM. Minimal penetration of lipopolysaccharide across the murine blood-brain barrier. Brain Behav Immun. 2010;24:102–9. doi: 10.1016/j.bbi.2009.09.001. [DOI] [PMC free article] [PubMed] [Google Scholar]
- 36.Hansen MK, Krueger JM. Subdiaphragmatic vagotomy blocks the sleep- and fever-promoting effects of interleukin-1beta. Am J Physiol. 1997;273:R1246–53. doi: 10.1152/ajpregu.1997.273.4.R1246. [DOI] [PubMed] [Google Scholar]
- 37.Watkins LR, Goehler LE, Relton J, Brewer MT, Maier SF. Mechanisms of tumor necrosis factor-alpha (TNF-alpha) hyperalgesia. Brain Res. 1995;692:244–50. doi: 10.1016/0006-8993(95)00715-3. [DOI] [PubMed] [Google Scholar]
- 38.Hansen MK, Taishi P, Chen Z, Krueger JM. Vagotomy blocks the induction of interleukin-1beta (IL-1beta) mRNA in the brain of rats in response to systemic IL-1beta. J Neurosci. 1998;18:2247–53. doi: 10.1523/JNEUROSCI.18-06-02247.1998. [DOI] [PMC free article] [PubMed] [Google Scholar]
- 39.Layé S, Bluthé RM, Kent S, et al. Subdiaphragmatic vagotomy blocks induction of IL-1 beta mRNA in mice brain in response to peripheral LPS. Am J Physiol. 1995;268:R1327–31. doi: 10.1152/ajpregu.1995.268.5.R1327. [DOI] [PubMed] [Google Scholar]
- 40.Ono A, Okuma Y, Hosoi T, Nomura Y. Effect of subdiaphragmatic vagotomy on bacterial DNA-induced IL-1beta expression in the mouse hypothalamus. Brain Res. 2004;1028:233–7. doi: 10.1016/j.brainres.2004.09.006. [DOI] [PubMed] [Google Scholar]
- 41.Marquette C, Linard C, Galonnier M, et al. IL-1beta, TNF-alpha and IL-6 induction in the rat brain after partial-body irradiation: role of vagal afferents. Int J Radiat Biol. 2003;79:777–85. doi: 10.1080/09553000310001610998. [DOI] [PubMed] [Google Scholar]
- 42.Smith GP, Jerome C, Cushin BJ, Eterno R, Simansky KJ. Abdominal vagotomy blocks the satiety effect of cholecystokinin in the rat. Science. 1981;213:1036–7. doi: 10.1126/science.7268408. [DOI] [PubMed] [Google Scholar]
- 43.West MA, Clair L, Kraatz J, Rodriguez JL. Endotoxin tolerance from lipopolysaccharide pretreatment induces nuclear factor-kappa B alterations not present in C3H/HeJ mice. J Trauma. 2000;49:298–305. doi: 10.1097/00005373-200008000-00018. [DOI] [PubMed] [Google Scholar]
- 44.Greisman SE, Hornick RB. The nature of endotoxin tolerance. Trans Am Clin Climatol Assoc. 1975;86:43–50. [PMC free article] [PubMed] [Google Scholar]
- 45.Jakubcakova V, Flachskamm C, Deussing JM, Kimura M. Deficiency of corticotropin-releasing hormone type-2 receptor alters sleep responses to bacterial lipopolysaccharide in mice. Brain Behav Immun. 2011;25:1626–36. doi: 10.1016/j.bbi.2011.06.008. [DOI] [PubMed] [Google Scholar]
- 46.Taishi P, De A, Alt J, Gardi J, Obal F, Jr, Krueger JM. Interleukin-1beta stimulates growth hormone-releasing hormone receptor mRNA expression in the rat hypothalamus in vitro and in vivo. J Neuroendocrinol. 2004;16:113–8. doi: 10.1111/j.0953-8194.2004.01138.x. [DOI] [PubMed] [Google Scholar]
- 47.Hansen MK, Kapas L, Fang J, Krueger JM. Cafeteria dietinduced sleep is blocked by subdiaphragmatic vagotomy in rats. Am J Physiol. 1998;274:R168–R174. doi: 10.1152/ajpregu.1998.274.1.R168. [DOI] [PubMed] [Google Scholar]
- 48.Churchill L, Taishi P, Wang M, et al. Brain distribution of cytokine mRNA induced by systemic administration of interleukin-1beta or tumor necrosis factor alpha. Brain Res. 2006;1120:64–73. doi: 10.1016/j.brainres.2006.08.083. [DOI] [PubMed] [Google Scholar]
- 49.Zanchetti A, Wang SC, Moruzzi G. The effect of vagal afferent stimulation on the EEG pattern of the cat. Electroencephalogr Clin Neurophysiol. 1952;4:357. doi: 10.1016/0013-4694(52)90064-3. [DOI] [PubMed] [Google Scholar]
- 50.Chase MH, Nakamura Y, Clements CD. Afferent vagal stimulation: neurographic correlates of induced EEG synchronization and desynchronization. Brain Res. 1967;5:236–49. doi: 10.1016/0006-8993(67)90089-3. [DOI] [PubMed] [Google Scholar]
- 51.Chase MH, Nakamura Y. Cortical and subcortical EEG patterns of response to afferent abdominal vagal stimulation: Neurographic correlates. Physiol Behav. 1968;3:605–10. [Google Scholar]
- 52.Rizzo P, Beelke M, De Carli F, et al. Modifications of sleep EEG induced by chronic vagus nerve stimulation in patients affected by refractory epilepsy. Clin Neurophysiol. 2004;115:658–64. doi: 10.1016/j.clinph.2003.10.026. [DOI] [PubMed] [Google Scholar]
- 53.Hofle N, Paus T, Reutens D, et al. Regional cerebral blood flow changes as a function of delta and spindle activity during slow wave sleep in humans. J Neurosci. 1997:4800–8. doi: 10.1523/JNEUROSCI.17-12-04800.1997. [DOI] [PMC free article] [PubMed] [Google Scholar]
- 54.Gerashchenko D, Matsumura H. Continuous recordings of brain regional circulation during sleep/wake state transitions in rats. Am J Physiol. 1996;270:R855–63. doi: 10.1152/ajpregu.1996.270.4.R855. [DOI] [PubMed] [Google Scholar]
- 55.Henny P, Jones BE. Projections from basal forebrain to prefrontal cortex comprise cholinergic, GABAergic and glutamatergic inputs to pyramidal cells or interneurons. Eur J Neurosci. 2008;27:654–70. doi: 10.1111/j.1460-9568.2008.06029.x. [DOI] [PMC free article] [PubMed] [Google Scholar]
- 56.Breder CD, Hazuka C, Ghayur T, et al. Regional induction of tumor necrosis factor alpha expression in the mouse brain after systemic lipopolysaccharide administration. Proc Natl Acad Sci U S A. 1994;91:11393–7. doi: 10.1073/pnas.91.24.11393. [DOI] [PMC free article] [PubMed] [Google Scholar]
- 57.Park SE, Dantzer R, Kelley KW, McCusker RH. Central administration of insulin-like growth factor-I decreases depressive-like behavior and brain cytokine expression in mice. J Neuroinflammation. 2011;8:12. doi: 10.1186/1742-2094-8-12. [DOI] [PMC free article] [PubMed] [Google Scholar]
- 58.Johnston GR, Webster NR. Cytokines and the immunomodulatory function of the vagus nerve. Br J Anaesth. 2009;102:453–62. doi: 10.1093/bja/aep037. [DOI] [PubMed] [Google Scholar]
- 59.Yang I, Han SJ, Kaur G, Crane C, Parsa AT. The role of microglia in central nervous system immunity and glioma immunology. J Clin Neurosci. 2010;17:6–10. doi: 10.1016/j.jocn.2009.05.006. [DOI] [PMC free article] [PubMed] [Google Scholar]
- 60.Galic MA, Riazi K, Pittman QJ. Cytokines and brain excitability. Front Neuroendocrinol. 2012;33:116–25. doi: 10.1016/j.yfrne.2011.12.002. [DOI] [PMC free article] [PubMed] [Google Scholar]
- 61.Quagliarello VJ, Wispelwey B, Long WJ, Jr, Scheld WM. Recombinant human interleukin-1 induces meningitis and blood-brain barrier injury in the rat. Characterization and comparison with tumor necrosis factor. J Clin Invest. 1991;87:1360–6. doi: 10.1172/JCI115140. [DOI] [PMC free article] [PubMed] [Google Scholar]
- 62.Nishioku T, Matsumoto J, Dohgu S, et al. Tumor necrosis factor-alpha mediates the blood-brain barrier dysfunction induced by activated microglia in mouse brain microvascular endothelial cells. J Pharmacol Sci. 2010;112:251–4. doi: 10.1254/jphs.09292sc. [DOI] [PubMed] [Google Scholar]
- 63.Banks WA, Erickson MA. The blood-brain barrier and immune function and dysfunction. Neurobiol Dis. 2010;37:26–32. doi: 10.1016/j.nbd.2009.07.031. [DOI] [PubMed] [Google Scholar]
- 64.Banks WA. Characteristics of compounds that cross the blood-brain bar-rier. BMC Neurol. 2009;9:S3. doi: 10.1186/1471-2377-9-S1-S3. [DOI] [PMC free article] [PubMed] [Google Scholar]
- 65.Ganong WF. Circumventricular organs: definition and role in the regulation of endocrine and autonomic function. Clin Exp Pharmacol Physiol. 2000;27:422–7. doi: 10.1046/j.1440-1681.2000.03259.x. [DOI] [PubMed] [Google Scholar]
- 66.Croft M, Duan W, Choi H, Eun SY, Madireddi S, Mehta A. TNF super-family in inflammatory disease: translating basic insights. Trends Immunol. 2012;33:144–52. doi: 10.1016/j.it.2011.10.004. [DOI] [PMC free article] [PubMed] [Google Scholar]
- 67.Moss RB, Mercandetti A, Vojdani A. TNF-alpha and chronic fatigue syndrome. J Clin Immunol. 1999;19:314–6. doi: 10.1023/a:1020595709352. [DOI] [PubMed] [Google Scholar]
- 68.Riha RL, Brander P, Vennelle M, et al. Tumour necrosis factor-alpha (-308) gene polymorphism in obstructive sleep apnoea-hypopnoea syn-drome. Eur Respir J. 2005;26:673–8. doi: 10.1183/09031936.05.00130804. [DOI] [PubMed] [Google Scholar]
- 69.Zielinski MR, Krueger JM. Inflammation and Sleep. In: Barkoukis TJ, Matheson JK, Ferber R, Doghramji K, editors. Therapy in sleep medicine. Philadelphia, PA: Saunders; 2012. pp. 607–16. [Google Scholar]
- 70.Krueger JM, Rector DM, Churchill L. Sleep and cytokines. Sleep Med Clin. 2007;2:161–9. doi: 10.1016/j.jsmc.2007.03.003. [DOI] [PMC free article] [PubMed] [Google Scholar]
- 71.Rosas-Ballina M, Tracey KJ. Cholinergic control of inflammation. J Intern Med. 2009;265:663–79. doi: 10.1111/j.1365-2796.2009.02098.x. [DOI] [PMC free article] [PubMed] [Google Scholar]
- 72.Vgontzas AN, Chrousos GP. Sleep, the hypothalamic-pituitary-adrenal axis, and cytokines: multiple interactions and disturbances in sleep disorders. Endocrinol Metab Clin North Am. 2002;31:15–36. doi: 10.1016/s0889-8529(01)00005-6. [DOI] [PubMed] [Google Scholar]
Associated Data
This section collects any data citations, data availability statements, or supplementary materials included in this article.
Supplementary Materials
NREMS episode frequencies and durations after saline, TNF-α, or LPS injections (mean ± SE)
REMS episode frequencies and durations after saline, TNF-α, or LPS injections (mean ± SE)


