

Abstract
Purpose
An increased risk of corneal infiltrative events has been noted with the use of certain contact lenses and multipurpose solutions (MPS). This study was designed to evaluate tear cytokine assay as a sensitive, objective, and quantitative measure of the ocular surface response to contact lens/MPS and to consider the assay’s clinical relevance in the context of other measures of ocular surface response.
Methods
Two MPS, ReNu® Fresh™ (RNF) and Opti-Free® RepleniSH (OFR), were used with daily wear silicone hydrogel contact lenses in a randomized, prospective crossover study involving 26 subjects. Clinical data collection (conjunctival hyperemia, ocular surface sensitivity, solution induced corneal staining (SICS) test score, and subjective responses) and tear cytokine assays were conducted masked. Responses were tracked as change from baseline throughout the experimental schedule.
Results
Similar response patterns for several inflammatory cytokines were seen throughout both phases: subjects who received OFR in Phase I had mean tear concentrations that were generally higher than those of the RNF Phase I group. OFR Phase I subjects had significant (P < 0.01) increases over baseline at day 1 and/or following washout for 13 cytokines (cc chemokine ligands [CCL] 3, CCL5, CCL11, granulocyte-macrophage colony-stimulating factor [GM-CSF], interferon [INF]-γ, interleukin [IL]-2, IL-4, IL-5, IL-6, IL-13, IL-15, IL-17, tumor necrosis factor [TNF]-α). These changes were not observed in RNF Phase I subjects, even though SICS test scores increased. Phase I OFR subjects also had increased dryness, while RNF Phase I subjects had decreased bulbar hyperemia. No changes were detected with respect to limbal hyperemia or surface sensitivity thresholds.
Conclusion
The tear cytokine assay can detect and differentiate contact lens/MPS induced increases in inflammatory cytokines. Changes in cytokine levels were consistent with measurement of hyperemia and dryness but not with SICS scores, thereby suggesting a proinflammatory response to OFR compared to RNF that is not related to SICS test score. Tear cytokine profiles may be useful for reconciling clinical relevance of test results and in revealing signaling involved in the development of corneal infiltrative events.
Keywords: multiplex bead assay, corneal staining, immunoassay, corneal sensitivity, inflammation
Introduction
An increased risk of corneal infiltrative events (CIE) has been noted with the use of contact lenses (CL). This applies to silicone hydrogel lenses either with extended wear or daily wear.1,2 CL associated CIE impose a significant economic burden on both the health care system and individual patients.3 Of the many potential etiologies for this infiltration,4 the use of multipurpose solutions (MPS) has been identified as a significant risk factor in occurrence for CIE in CL users.5 The incidence of CIE has been reported to differ between different MPS.6
Several experimental methods have been proposed to assess the response of the ocular surface to CL/MPS combinations. One of these is the solution induced corneal staining (SICS) test observed after insertion of a CL soaked in a specified MPS. Superficial punctate corneal surface staining has been reported to be increased for some CL/MPS combinations within 2–4 hours of lens insertion.7,8 The clinical significance of this observation of superficial fluorescence is equivocal given: (1) the transient nature of the response, (2) the overall low grade of the scores, (3) the absence of concomitant slit lamp finding or symptoms, and (4) the absence of direct evidence of increased risk of CIE associated with this transient phenomenon.9,10 Evaluation of the SICS test is time dependent with observations required to be made within a few hours of lens insertion and involves a subjective scale for grading.11 Unlike CL/MPS use, increased SICS scores have not been associated with increased CIE. Although increased dendritic cell density in the central cornea was measured in response to CL/MPS, the method did not distinguish between MPS responses.12 Another experimental method uses a pneumatic esthesiometer to measure ocular surface sensitivity to tactile, chemical, and mechanical stimuli. Even though an increase in subjective detection of threshold can be measured in response to the use of CL, differences between MPS were detectable only for conjunctival chemical sensitivity but not for corneal chemical sensitivity nor for tactile or mechanical sensitivity of cornea or conjunctiva.13 A more objective and sensitive evaluation of ocular surface health is needed to elucidate physiological effects of CL/MPS use.
Tear cytokine profiles can provide an objective, quantifiable measure of the inflammatory status of the ocular surface. Cytokines participate in ocular surface homeostasis via a timely response to environmental stress. These proteins expressed at the ocular surface form a signaling network to initiate, amplify, and resolve inflammatory responses appropriate to the stimulus.14–17 The resulting activity may range from undetected maintenance of quiescence to overt perpetuation of an inflammatory response leading to tissue destruction and dysfunction. A moderate cytokine response to CL/MPS could induce cellular infiltrate into the cornea manifesting as CIE.15 Evaluation of tear cytokine profiles under a variety of physiologic conditions illustrates the changes that can occur in response to a spectrum of ocular surface challenges. Modulation of tear cytokine profiles of the quiescent eye18 has been associated with the sub-clinical inflammatory state of overnight lid closure,14,19 uncomplicated CL use,20 or exposure to passive smoke.21 Changes to the tear cytokine profile have also been measured in association with more overt inflammatory processes at the ocular surface, eg, CL associated red eye,22 surgical procedures,23–25 infectious disease,23,26 dysfunctional tear syndrome,27–29 and ocular allergy.30 Hence, tear cytokine profiles can provide an objective, quantitative, and sensitive evaluation of response to CL/MPS as well as provide insight to potential signaling leading to CIE.15,31
The present study was designed to address the feasibility of using a tear cytokine assay to assess the ocular response to CL/MPS and to evaluate the clinical relevance in relationship to other measures of response. Tears of subjects using CL/MPS were assayed for 27 cytokines. In this initial study, two MPS displaying disparate SICS scores and containing different preservatives were evaluated using a single CL material in a prospective, randomized, double masked, crossover study. Tear cytokine levels were evaluated in the context of other ocular surface measurements, such as conjunctival hyperemia, corneal fluorescent staining, ocular surface sensitivity, and subjective symptom scores.
Materials and methods
Subjects
Thirty habitual, soft spherical contact lens wearers were enrolled in the study. All procedures were approved by the Office of Research Ethics at the University of Waterloo (Waterloo, Ontario Canada) and adhered to the tenets of the Declaration of Helsinki. Informed consent outlining the nature and possible consequences of study participation was obtained from each participant. Subjects were adapted soft contact lens wearers who had no history of eye surgery or systemic or ocular disease, were not using any systemic or topical medications that may affect ocular health, and were not currently wearing PureVision® contact lenses or using either of the two study MPS.
Contact lenses and solutions
All subjects were prescribed balafilcon A contact lenses (PureVision®, Bausch and Lomb, Inc, Rochester, NY, USA). Subjects were randomly selected to start with one of two MPS used in this study: ReNu® Fresh™ (RNF), a polyhexamethylene biguanide preserved solution (ReNu® Fresh™ solution, Bausch and Lomb, Inc, Rochester, NY, USA), or Opti-Free® RepleniSH (OFR), a polyquaternium-1 (PQ-1)/myristamidopropyl dimethylamine (Aldox®) preserved solution (Alcon Opti-Free RepleniSH® multipurpose solution, Alcon Laboratories, Fort Worth, TX, USA).
Study protocol
In this prospective, randomized, double masked crossover study, subjects were instructed to wear habitual spectacles for 1 or 2 days prior to the screening visit and to not use rewetting drops or any additional lens care products during the study period. The initial baseline visit included evaluation of conjunctival hyperemia, collection of nonstimulated tear samples, assessment of chemical and mechanical thresholds, and grading of corneal staining. Subjects were fitted and issued new balafilcon A contact lenses stored in a case containing a randomly assigned MPS (RNF or OFR), and instructed to leave the lenses soaking in the solution overnight and to insert them the following day. On days 1 and 28 of each phase, subjects returned to the clinic for evaluation 2 hours after lens insertion. Conjunctival hyperemia for a randomly selected eye was measured and a nonstimulated tear sample was collected from both eyes. Lenses were removed and stored in a new lens case containing sterile, nonpreserved saline. Chemical and mechanical thresholds and corneal staining were measured for the one randomly selected eye. Subjects were instructed to wear habitual spectacles for 1 or 2 days for a washout period before beginning Phase II with the second MPS. After the washout period tears were collected and mechanical and chemical thresholds were measured for each eye. Subjective responses to the contact lenses were recorded on day 1 and day 27 of each phase.
Conjunctival hyperemia
Limbal and bulbar injection assessed by slit lamp was graded on a scale of 0 (negligible) to 100 (severe). Values from four regions of the cornea (inferior, temporal, superior, and nasal) were averaged for the score for each eye.
Tear sample collection
Prior to lens removal, nonstimulated tears were collected from each eye from the inferior tear meniscus between the 6 o’clock and lateral canthus positions using a 10 μL flame-polished glass micropipette. Following collection, a 5.5 μL volume of tear was immediately transferred to a sterile 0.2 mL tube (AB-0620 Thermo Scientific, Suwanee, GA, USA) containing 49.5 μL of storage solution (pH 7.1 phosphate buffered saline/0.5% bovine serum albumin [Bovine Serum Albumin Fraction V, Sigma-Aldrich, St Louis, MO, USA]) to produce a 1:10 tear dilution for immediate storage at −80°C. Masked tear samples were shipped on dry ice to the laboratory for cytokine assay.
Ocular surface sensitivity
Pneumatic mechanical (air temperature set at 50°C) and chemical (CO2 mixed with air) thresholds were measured using a computerized Belmonte pneumatic esthesiometer.13 Measurements were taken at the temporal mid-peripheral cornea (approximately 3 mm from the apex) and temporal conjunctiva (approximately 4 mm from the limbus). Mechanical stimulus consisted of a series of air pulses with flow rates varying from 0–200 mL/minute. Chemical stimulation was induced by increasing the concentration of CO2 in the air with the stimulus flow rate fixed at half of the initially estimated mechanical threshold. The stimulus duration was 2 seconds with 20- and 45-second intervals between the subject’s response and the next stimulus for mechanical and chemical measures, respectively. The ascending method of limits was used, ie, increasing flow rate as mL/minute or %CO2 until the subject detected the stimulus. The threshold was the average of three intensities at detection for each modality of stimulation.
Corneal fluorescent staining
Corneal staining was assessed by instilling sodium fluorescein (FUL-GLO Sterile Ophthalmic Strip 0.6 mg, Akron, Inc, Lake Forest, IL, USA) onto the superior bulbar conjunctiva of each eye for slit lamp observation using cobalt blue and yellow filters (Kodak Wratten #12, Eastman Kodak, Rochester, NY, USA). Corneal staining was evaluated at each visit using a 0 to 4 scale of severity: 0 – none, 1 – trace (micropunctate), 2 – mild (macropunctate), 3 – moderate (coalesced) and 4 – severe, and extent: area of staining (0% – no staining in the region to 100% – staining covering the entire region). Values from five regions of the cornea (central, inferior, temporal, superior, and nasal) were averaged for the SICS test score for each eye. After corneal staining evaluation, the eye was rinsed with sterile nonpreserved saline to remove residual fluorescein from the ocular surface before contact lens insertion.
Subjective responses
Subjects rated their vision, comfort, and dryness with CL/MPS on day 1 and day 27 of each CL/MPS phase using scales of 0 (severe) to 100 (negligible). Subjective symptoms were graded in the morning (1 to 2 hours post-lens insertion), afternoon (around 4 pm), and in the evening prior to lens removal. Participants also rated burning and stinging sensation on lens insertion (approximately 5 minutes after lens insertion) on day 1 and day 27 of each CL/MPS phase.
Tear cytokine assay
Tear cytokine concentrations were measured by a multiplex bead-based assay according to the manufacturer’s directions for the Bio-Plex Human Cytokine 27-Plex Assay (Bio-Rad Laboratories, Hercules, CA, USA) on the Luminex® 200™ platform (Luminex Corporation, Austin, TX, USA). Cytokines assayed included: cc chemokine ligand (CCL) 2/monocyte chemoattractant protein-1 (MCP-1), CCL3/macrophage inflammatory protein (MIP)-1α, CCL4/MIP-1β, CCL5/regulated on activation, normal T-cell expressed and secreted (RANTES), CCL11/Eotaxin, CXC motif ligand (CXCL)8/Interleukin (IL)-8, CXCL10/interferon-inducible protein (IP)-10, fibroblast growth factor (FGF)-basic, granulocyte colony stimulating factor (G-CSF), granulocyte-macrophage (GM)-CSF, interferon-gamma (IFN-γ), interleukin (IL)-1β, IL-1 receptor antagonist (ra), IL-2, IL-4, IL-5, IL-6, IL-7, IL-9, IL-10, IL-12p70, IL-13, IL-15, IL-17, platelet-derived growth factor BB (PDGF BB), tumor necrosis factor (TNF)-α, and vascular endothelial growth factor (VEGF). Samples were incubated with antibody-coated beads overnight at 4°C. Cytokine concentrations were calculated from standard curves of human recombinant cytokines using Beadview® multiplex data analysis software (EMD Millipore Corporation, Danvers, MA, USA).
Data analysis
Initial analysis of tear cytokine concentrations involved comparison of RNF and OFR group means using an analysis of variance (ANOVA) model accounting for the crossover period and treatment as within subject effects, and visit as a within crossover period effect. In addition, tear cytokines levels as well as measurements of hyperemia, surface sensitivity, surface fluorescence, cytokine levels, and subjective responses were tracked as change from baseline throughout the entire experimental schedule. Statistical analysis was conducted using a paired t-test between the baseline and experimental times from Phase I day 1 and day 28 through washout and Phase II day 1 and day 28. An unpaired Student’s t-test was used to compare baseline values between study groups. Due to the large number of comparisons made in this study, a more conservative alpha level of <0.01 was used for all tests of statistical significance.
Results
Subjects
Thirty subjects were enrolled with 26 completing the study (22 female, 4 male). The mean age of the participants was 26 years ranging from 18–48 years. Four participants were discontinued from the study before completing all follow up visits. Reasons for discontinuation included difficulties in collecting tear samples (two), complaint of discomfort (one), and weather/personal (one). Over the course of the study, three subjects developed a superior epithelial arcuate lesion (one subject during the OFR phase, two subjects during the RNF phase). All three subjects completed the study, after temporary cessation of lens wear and modification of the lens parameters.
Tear cytokine levels
At baseline, concentrations of cytokines in tears did not show statistically significant differences (P > 0.11 in all cases) between the RNF and OFR groups (Figure 1). Since more than 50% of the samples for CCL4 and FGF were below the limits of detection, they were excluded from further analysis.
Figure 1.

Baseline tear cytokine concentrations (mean ± standard deviation) of subjects who used RNF in Phase I or OFR in Phase I.
Abbreviations: CCL, cc chemokine ligand; CXCL, cxc motif ligand; G-CSF, granulocyte colony-stimulating factor; GM-CSF, granulocyte macrophage colony-stimulating factor; FGF, fibroblast growth factor; IL, interleukin; INF, interferon; OFR, Opti-Free RepleniSH; PDGF-BB, plasma-derived growth factor; TNF, tumor necrosis factor; RNF, ReNu Fresh; VEGF, vascular endothelial growth factor.
Analysis of the data as a two phase crossover study revealed that of the 25 cytokines measured at day 1 and day 28, only CXCL10 showed statistically significant different concentration on day 28 (RNF > OFR P = 0.003). Further examination of the data suggesting that the treatment effects in the two phases were not similar prompted an analysis of the data for the two treatment sequences separately. Graphic illustration of responses revealed similar temporal patterns of response for several inflammatory cytokines: subjects who received OFR in Phase I had values that were generally higher than those of the RNF Phase I group throughout Phase I and into Phase II (Figure 2). The only inversion of this pattern with RNF higher than OFR was with the anti-inflammatory cytokine IL-10 (Figure 2). Not all cytokines showed this pattern.
Figure 2.

Tear levels of representative cytokines of subjects using different MPS in Phase I and Phase II.
Note: *Indicates a statistically significant change (P < 0.01) from baseline.
Abbreviations: INF, interferon; IL, interleukin; MPS, multipurpose solution; OFR, Opti-Free RepleniSH; RNF, ReNu Fresh.
The pattern of response and the individual variability of tear cytokine concentrations prompted a post hoc evaluation of change of individual tear cytokine concentrations with respect to baseline. Subjects who used OFR in Phase I had a statistically significantly higher concentration of ten cytokines on day 1 of Phase I (Table 1). This difference was also observed as change from baseline at washout for 12 cytokines and on day 28 for three cytokines (Table 1). There was also an OFR response at Phase II day 1 for cytokine CCL5 in subjects who had used RNF with no changes during Phase I. Likewise, there was a CCL3 and IL-17 Phase II response to RNF in subjects who had responded to OFR in Phase I. Growth factor PDGF-BB had a single significant increase over baseline in subjects using OFR in Phase II after using RNF in Phase I. The remaining nine growth factors and cytokines measured showed no statistically significant differences over baseline throughout the experimental period.
Table 1.
Statistical analysis of tear cytokine concentration changes from baseline
| Cytokine | RNF Phase I
|
OFR Phase I
|
||||||||
|---|---|---|---|---|---|---|---|---|---|---|
| Phase I day 1 (RNF) | Phase I day 28 (RNF) | Washout | Phase II day 1 (OFR) | Phase II day 28 (OFR) | Phase I day 1 (OFR) | Phase I day 28 (OFR) | Washout | Phase II day 1 (RNF) | Phase II day 28 (RNF) | |
| CCL3 | § | § | § | § | § | 0.0006 | § | 0.0011 | 0.0099 | § |
| CCL5 | § | § | § | § | 0.0091* | 0.0014 | § | 0.0090 | § | § |
| CCL11 | § | § | § | § | § | 0.0006 | 0.0057 | 0.0002 | § | § |
| GM-CSF | § | § | § | § | § | 0.0003 | § | 0.0079 | § | § |
| IFN-γ | § | § | § | § | § | 0.0043 | 0.0078 | 0.0036 | § | § |
| IL-2 | § | § | § | § | § | 0.0021 | § | 0.0097 | § | § |
| IL-4 | § | § | § | § | § | 0.0015 | § | § | § | § |
| IL-5 | § | § | § | § | § | 0.0010 | § | 0.0042 | § | § |
| IL-6 | § | § | § | § | § | § | 0.0087 | 0.0066 | § | § |
| IL-13 | § | § | § | § | § | 0.0038 | § | 0.0042 | § | § |
| IL-15 | § | § | § | § | § | § | § | 0.0096 | § | § |
| IL-17 | § | § | § | § | § | § | § | 0.0078 | 0.0088 | § |
| PDGF-BB | § | § | § | § | § | § | § | § | § | 0.0033 |
| TNF-α | § | § | § | § | § | 0.0064 | § | 0.0023 | § | § |
Notes: *P-value by paired t-test; §P > 0.01 by paired t-test.
Abbreviations: CCL, cc chemokine ligand; GM-CSF, granulocyte macrophage colony-stimulating factor; IL, interleukin; INF, interferon; OFR, Opti-Free RepleniSH; PDGF-BB, plasma-derived growth factor; TNF, tumor necrosis factor; RNF, ReNu Fresh.
Since a major aim of this study was to evaluate tear cytokine assay in the context of other measures of ocular surface response, data for these measures were also evaluated separately for the two treatment sequences as change from baseline.
Conjunctival hyperemia
Bulbar and limbal conjunctival hyperemia scores were evaluated with respect to baseline over the entire experimental period. At baseline scores of experimental study groups for bulbar (P = 0.81) or limbal (P = 0.80) hyperemia were not statistically different. However, bulbar hyperemia scores were statistically significantly decreased from baseline in individuals who used RNF in Phase I both at day 1 and day 28 with carryover into Phase II of use of OFR at day 1 (Table 2). There was also a statistically significant decrease in hyperemia on day 1 of Phase II in individuals who used RNF in Phase II. There were no significant changes from baseline in limbal hyperemia in either phase of individuals using either MPS (Table 2).
Table 2.
Conjunctival surface hyperemia score (mean ± standard deviation, scale 0–100)
| Hyperemia | RNF Phase 1
|
OFR Phase 1
|
||||||||
|---|---|---|---|---|---|---|---|---|---|---|
| Baseline | Phase I day 1 (RNF) | Phase I day 28 (RNF) | Phase II day 1 (OFR) | Phase II day 28 (OFR) | Baseline | Phase I day 1 (OFR) | Phase I day 28 (OFR) | Phase II day 1 (RNF) | Phase II day 28 (RNF) | |
| Bulbar | 33.5 ± 3.9 | 29.8 ± 3.7* | 31.6 ± 3.6* | 31.0 ± 3.5* | 31.7 ± 3.1 | 33.1 ± 4.6 | 30.2 ± 4.8 | 30.8 ± 3.7 | 30.1 ± 3.0* | 32.0 ± 4.1 |
| Limbal | 27.2 ± 4.5 | 26.2 ± 3.7 | 28.1 ± 3.8 | 27.6 ± 4.5 | 28.2 ± 3.8 | 27.7 ± 4.5 | 26.8 ± 3.6 | 29.1 ± 7.7 | 29.0 ± 3.7 | 30.0 ± 3.89 |
Notes:
Statistically significant change from baseline, P < 0.01 by paired t-test.
Abbreviations: OFR, Opti-Free RepleniSH; RNF, ReNu Fresh.
Ocular surface sensitivity
At baseline, mechanical and chemical detection threshold scores were not statistically different (P > 0.26 in all groups) between experimental groups receiving RNF or OFR in Phase I (Table 3). Evaluation of threshold scores revealed no statistically significant differences from baseline throughout the entire experimental period for either experimental group (Figure 3).
Table 3.
Corneal surface chemical and mechanical sensitivity
| Sensitivity tested | RNF Phase I baseline | OFR Phase I baseline | P-value (unpaired Student t-test) |
|---|---|---|---|
| Corneal mechanical threshold (air flow mL/minute) | 49.2 ± 23.7 | 39.9 ± 15.4 | 0.26 |
| Corneal chemical threshold (% CO2 added) | 21.7 ± 6.7 | 21.8 ± 8.8 | 0.97 |
| Conjunctival mechanical threshold (air flow mL/minute) | 51.4 ± 22.1 | 52.1 ± 18.9 | 0.94 |
| Conjunctival chemical threshold (% CO2 added) | 50.6 ± 10.6 | 49.36 ± 19.6 | 0.84 |
Abbreviations: OFR, Opti-Free RepleniSH; RNF, ReNu Fresh.
Figure 3.

Ocular surface sensitivity thresholds of subjects using different MPS in Phase I and Phase II.
Abbreviations: MPS, multipurpose solution; OFR, Opti-Free RepleniSH; RNF, ReNu Fresh.
Corneal fluorescent staining
At baseline, there were no statistically significant differences between study groups for staining severity (P = 0.14) or extent (P = 0.25). Staining severity graded at any visit during the study was not clinically significant and mainly micropunctate with no score greater than 2.0 in all quadrants. Severity scores for RNF were significantly different than baseline in both Phases at day 1 and day 28 (Table 4). In addition, severity scores for OFR were significantly different from baseline in Phase I day 28 (Table 4). Extent scores for RNF were significantly different from baseline in both Phases at day 1 and day 28 (Table 4).
Table 4.
Corneal surface staining score (mean ± standard deviation), severity scale 0–4, extent scale (0%–100%)
| Staining | RNF Phase 1
|
OFR Phase 1
|
||||||||
|---|---|---|---|---|---|---|---|---|---|---|
| Baseline | Phase I day 1 (RNF) | Phase I day 28 (RNF) | Phase II day 1 (OFR) | Phase II day 28 (OFR) | Baseline | Phase I day 1 (OFR) | Phase I day 28 (OFR) | Phase II day 1 (RNF) | Phase II day 28 (RNF) | |
| Severity | 0.3 ± 0.3 | 0.9 ± 0.2* | 0.7 ± 0.3* | 0.6 ± 0.2 | 0.4 ± 0.3 | 0.1 ± 0.2 | 0.3 ± 0.3 | 0.7 ± 0.3* | 0.8 ± 0.2* | 0.9 ± 0.1* |
| Extent | 2.4 ± 3.4 | 53.8 ± 32.3* | 26.7 ± 26.6* | 7.4 ± 10.6 | 6.3 ± 12.4 | 1.1 ± 2.2 | 2.5 ± 2.0 | 11.9 ± 13.1 | 48.3 ± 24.8* | 45.6 ± 32.2* |
Notes:
Statistically significant change from baseline, P < 0.01 by paired t-test.
Abbreviations: OFR, Opti-Free RepleniSH; RNF, ReNu Fresh.
Subjective responses
Subject reported comfort, dryness, and blurry vision graded in the morning, afternoon, and evening were evaluated as change from the score for each morning. Longitudinal illustration of subject reported comfort, dryness, and blurry vision ratings during the day throughout both Phases revealed consistently lower mean scores throughout the day for subjects who used OFR in Phase I than for those who used RNF in Phase I (Figure 4). Subjects who used OFR in Phase I had statistically significant more dryness in the evening over morning dryness scores at day 1 and day 27 of Phase I with carryover into Phase II at day 1 evening (Table 5). There was also more dryness with OFR in Phase II day 1 of subjects who had used RNF in Phase I. In comfort reports, the only significant change from morning until evening was a decrease in comfort in subjects using RNF in Phase I on Phase I day 27. None of the blurry vision scores reported for afternoon and evening showed statistically significantly differences from the morning values. Scores for stinging or burning upon insertion were not statistically significantly different from Phase I day 1 throughout both phases (Table 6).
Figure 4.
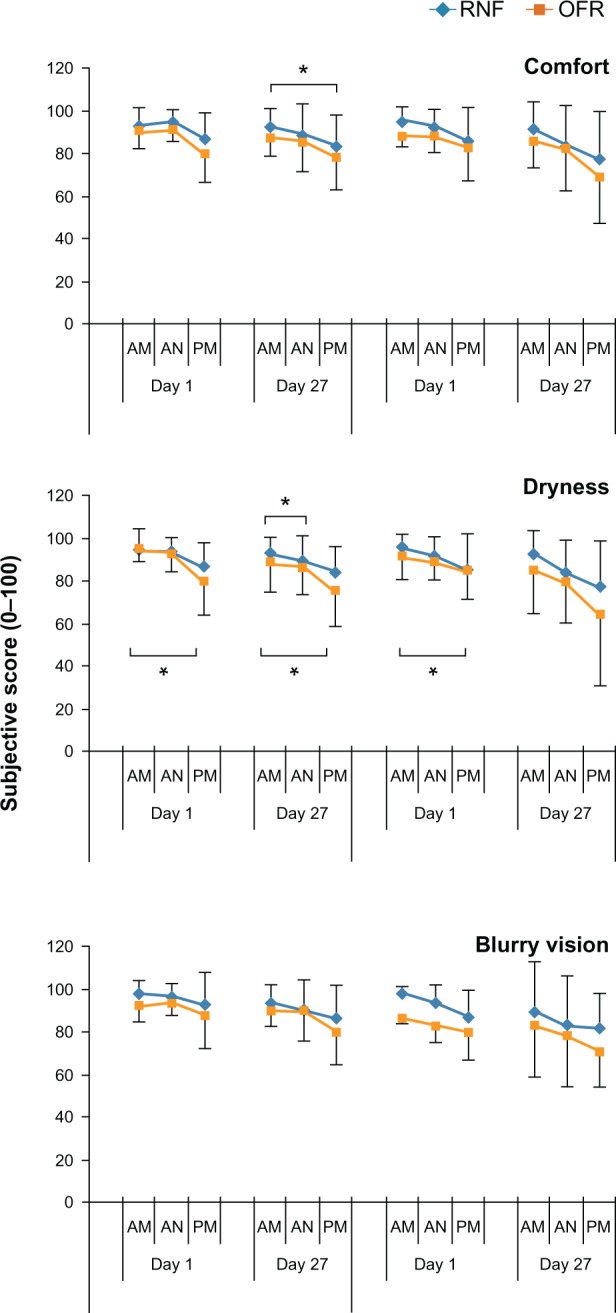
Subjective responses of subjects using different MPS in Phase I and Phase II.
Notes: Subjects reported subjective scores in the morning (AM) afternoon (AN) and evening (PM). *Indicates a statistically significant change (P < 0.01) from morning score.
Abbreviations: AM, morning; AN, afternoon; MPS, multipurpose solution; PM, evening; OFR, Opti-Free RepleniSH; RNF, ReNu Fresh.
Table 5.
Statistical analysis of subjective symptom score changes from morning score; P-value by paired t-test
| Subjective measurement | RNF Phase 1
|
OFR Phase 1
|
||||||||||||||
|---|---|---|---|---|---|---|---|---|---|---|---|---|---|---|---|---|
| Phase 1 day 1 AN (RNF) | Phase 1 day 1 PM (RNF) | Phase 1 day 27 AN (RNF) | Phase 1 day 27 PM (RNF) | Phase II day 1 AN (OFR) | Phase II day 1 PM (OFR) | Phase II day 27 AN (OFR) | Phasell day 27 PM (OFR) | Phase 1 day 1 AN (OFR) | Phase 1 day 1 PM (OFR) | Phase 1 day 27 AN (OFR) | Phase 1 day 27 PM (OFR) | Phasell day 1 AN (RNF) | Phase II day 1 PM (RNF) | Phase II day 27 AN (RNF) | Phase II day 27 PM (RNF) | |
| Comfort | § | § | § | 0.009 | § | § | § | § | § | § | § | § | § | § | § | § |
| Dryness | § | § | § | § | § | § | 0.008 | § | § | 0.010 | § | 0.004 | § | 0.007 | § | § |
| Blurry vision | § | § | § | § | § | § | § | § | § | § | § | § | § | § | § | § |
Note: §P > 0.01 by paired t-Test
Abbreviations: AN, afternoon; PM, evening; OFR, Opti-Free RepleniSH; RNF, ReNu Fresh.
Table 6.
Scores for stinging or burning upon CL/MPS insertion (mean ± standard devation), scale 0 (severe) to 100 (negligible)
| Insertion sensation | RNF Phase I
|
OFR Phase I
|
||||||
|---|---|---|---|---|---|---|---|---|
| Phase I day 1 (RNF) | Phase I day 27 (RNF) | Phase II day 1 (OFR) | Phase II day 27 (OFR) | Phase I day 1 (OFR) | Phase I day 27 (OFR) | Phase II day 1 (RNF) | Phase II day 27 (RNF) | |
| Stinging | 91.9 ± 23.8 | 97.8 ± 3.6 | 99.2 ± 2.7 | 97.1 ± 5.4 | 95.0 ± 9.8 | 97.2 ± 6.6 | 93.8 ± 9.4 | 96.8 ± 4.3 |
| Burning | 91.9 ± 24.7 | 97.7 ± 3.7 | 99.2 ± 2.7 | 97.5 ± 4.6 | 98.5 ± 3.0 | 98.3 ± 4.1 | 96.0 ± 8.3 | 97.5 ± 3.7 |
Abbreviations: CL/MPS, contact lens/multipurpose solutions; OFR, Opti-Free RepleniSH; RNF, ReNu Fresh.
Discussion
Of the 27 cytokines assayed, 25 were detected in the tears at baseline and 13 changed from baseline with the use of CL/MPS. Although a single difference between the two MPS modalities was noted in the standard ANOVA crossover, cross-sectional analysis, an examination of the full responses prompted an analysis of the two treatment sequences separately as change from baseline. While the limited washout period of the original experimental design precluded specific analyses as planned, the results provided insight into the lasting effects of MPS. The revised approach not only accommodated the baseline variability between subjects but also allowed comparison to other ocular surface tests.
The ocular surface responded differently to the two MPS studied. When evaluated as a change from baseline, subjects who used OFR in Phase I had an increase in inflammatory cytokines in tears and increase of dryness during the daily period of wear. In contrast, subjects who used RNF in Phase I had no such changes in tear cytokine levels or dryness while there was an increase in SICS test score. The RNF Phase I group also had a decrease in bulbar hyperemia not observed in the OFR Phase I group. There were no changes detected for limbal hyperemia or surface sensitivity threshold.
Change from baseline is appropriate for normalization of individual responses of tear cytokine levels. Cytokines such as CCL11 have been shown to remain constant in tears for months, even in the context of individual variability of absolute levels.32 Change from baseline has been used previously to detect changes in levels of IL-12 within 1 hour of excimer laser treatment,24 and tear cytokine changes have been shown to persist 48 hours after stimulus.33,34 In the present study, cytokine increases were detected within 2 hours of CL insertion and did not return to baseline following a brief washout period. A rise and fall of all or individual cytokines before or after 2 hours post CL insertion is a distinct possibility for either or both MPS. The complexity of cytokine kinetics should be considered in future studies.
The consistency of response in tears for some but not all cytokines in this study lends credibility to the experimental results. Of the 25 cytokines and growth factors assayed, 13 showed a similar, characteristic pattern of response, ie, an increase on day 1 of Phase I and a failure to return to baseline following washout. Because the cytokine levels did not return to baseline during the washout period, the washout period may have been too short for cytokine response to OFR to return to baseline levels. The absence of such a response for twelve other cytokines and growth factors shows that this response is selective, particularly since some of the unchanged growth factors have been shown to change in tears in response to other stimuli.33,35 Thus, the cytokine levels measured here are reasonable and consistent with previous studies.
The 13 cytokines that increased in tears in response to OFR include a spectrum that could be part of a generalized stress response.15 Although cytokines may function differently in a variety of environments, the cytokines identified here are generally considered to be part of an inflammatory response.15 Not only did RNF not induce significant changes in these 13 inflammatory cytokines, but also the mean response was consistently lower than that to OFR. It is therefore notable that the mean level of the anti-inflammatory cytokine IL-10 was consistently higher in response to RNF. Such a shift is consistent with lower levels of inflammatory cytokines and decreased hyperemia in response to RNF. Overall responses in Phase II suggest a carryover through the washout period: there was only one response to OFR in Phase II following RNF in Phase I, and two cytokines responded to RNF in Phase II following responses to OFN in Phase I. These simple comparisons set the foundation for future complex analyses of interaction of cytokines responses to CL/MPS. Factors such as assay conditions (buffer, sample storage, etc) or diurnal effects must be considered in refined studies to clarify specific cytokine and other responses to CL/MPS.
Previous studies showing the effects of CL use on tear cytokines have been limited by only measuring a few cytokines and comparing group means.14,20,35–37 Even in longitudinal studies, increases in IL-6 and IL-8 have been limited to examining adaptation to CL wear.38,39 In the present study, the change from baseline of cytokine levels on an individual basis of experienced CL users reveals a response to CL solutions not detected in previous studies of cytokine response to CL. Additional studies can address the effect of additional CL/MPS materials on the tear cytokine response.
Even though a CL/MPS effect on tear cytokine profile was measured and found to be consistent with previous studies of tear cytokine levels, the relationship to other measures of ocular surface response is essential for clinical relevance. Significant changes from baseline were noted in bulbar hyperemia, SICS score, dryness, and comfort, but not for limbal hyperemia, stinging, and burning upon CL insertion and ocular surface sensitivity.
Evaluation of ocular surface sensitivity as a change from baseline did not reveal any changes in threshold with either MPS. This result is consistent with previous studies of ocular surface sensitivity responses to MPS in which there were no differences in detection thresholds between solution groups for 16 of 18 experimental comparisons of tactile, chemical, or pneumatic responses.13 These previous analyses did not take into account changes from baseline. Since this test can detect change in response to CL use in general,13 the results suggest that the test is not sensitive enough to distinguish between MPS or that these MPS do not have an effect on ocular surface sensitivity.
The subjective symptom scores of comfort, dryness, and blurry vision had similar patterns of response to the cytokine response, in that mean scores for OFR use in Phase I were below those for RNF use in Phase I. Comparison to each morning as baseline showed significant changes especially with respect to dryness over the time of wear. It is reasonable that an increase in inflammatory cytokines in the tears be reflected in increased subjective sensitivity. Correlation calculations are difficult here since the low stress of CL use is not sufficient to trigger large changes in subjective symptom scores. Reported relationship of subjective satisfaction to CL/MPS have been equivocal with either no statistical analysis or changes in only a few parameters measured.7,8,40–44 Overt stress such as laser-assisted in situ keratomileusis (LASIK) or dysfunctional tear syndrome can induce tear cytokine changes that do correlate with subjective symptom scores.24,27
Significant decrease in bulbar hyperemia with use of RNF in Phase I is consistent with the lower levels of pro- inflammatory cytokines and higher levels of anti-inflammatory IL-10 observed here. Similarly, statistically significant lower hyperemia scores 2 hours after lens insertion for RNF compared to OFR have been independently reported.41,43 Notably, this decreased bulbar redness was seen even with high SICS scores.
SICS test scores were not consistent with any of the other metrics used here: tear cytokine levels, subjective satisfaction, hyperemia, or threshold sensitivity. The objective and sensitive measure of tear cytokine levels is in direct opposition to the SICS test response. This is not the first observation of a disconnect between tear cytokine response and ocular surface staining. In mild dry eye disease, increases in inflammatory tear cytokines are detectable before, not after, the appearance of clinically relevant ocular surface staining,28 even though clinically relevant ocular surface staining is associated with overt dry eye disease.27 Increased SICS score and decreased comfort may not be present at the same time.43,44 A further distinguishing feature of the SICS test is that there was no carryover of response through washout, even though carryover of OFR response was seen with tear cytokines, hyperemia, and dryness. Taken together, these observations suggest that the SICS scores are not related to other measurements of ocular surface responses to CL/MPS. Although CL/MPS have been associated with CIE5,6 and with SICS,7,8 there is yet no confirmation of an association of SICS and CIE.45,46 Hence, generalized interpretation of SICS test scores should be made with caution.
Although an increase in CIE has been noted with the use of certain CL/MPS6,47 the signaling that leads to cellular infiltration is not yet well understood. A given cytokine response not only reflects past events but in turn also can indicate the resulting immune response, which may include infiltration of cells to form CIE.15 The increased density of dendritic cells in the cornea in response to CL use in general12 sets the potential for different MPS directed cytokine responses with respect to CIE. Although a link between upregulation of specific inflammatory cytokines to one MPS and increased CIE is suggested by these results, the relationship of CL/MPS induced changes in cytokine profile to clinically observed outcomes will probably be more complex. Consideration must be given to the baseline levels, individual changes in selected cytokines, changes in relationship to other cytokines, and interactions between different cytokines or other ocular surface molecules. It is the resulting signaling network of this complex response that could determine the outcome, eg, infiltrate, allergy, quiescence, etc. Future studies will need to examine additional CL/MPS combinations and evaluate the total cytokine response of more cytokines and their interactions.
Conclusion
In summary, this initial study of a tear cytokine assay as a measure of ocular response to CL/MPS detected changes in tear cytokine levels that differentiated the two MPS tested. An increase in 13 inflammatory cytokines was seen with OFR along with an increase in dryness. This increase was not seen with RNF, which did have a decrease in hyperemia despite an increased SICS test score. Hence, tear cytokine assay is a feasible approach to understanding the ocular surface response to CL/MPS and may assist in delineating a role of CL/MPS in CIE development and subsequent prevention.
Acknowledgments
The data was collected at the Centre for Contact Lens Research, School of Optometry, University of Waterloo, Waterloo, Ontario, Canada. Cytokine assays were conducted by Dr Roderick J Fullard, University of Alabama, Birmingham School of Optometry, Birmingham, Alabama, USA.
Footnotes
Disclosure
This study was supported by Bausch and Lomb, Inc. Dr Kalsow is a consultant to Bausch and Lomb, Inc. Drs Reindel, Merchea, and Barr and Mr Bateman are employees of Bausch and Lomb, Inc. Data from this study were presented at the American Academy of Optometry Annual Meeting, October 24, 2012, Phoenix, AZ, USA.
References
- 1.Szczotka-Flynn L, Diaz M. Risk of corneal inflammatory events with silicone hydrogel and low Dk hydrogel extended contact lens wear: a meta-analysis. Optom Vis Sci. 2007;84(4):247–256. doi: 10.1097/OPX.0b013e3180421c47. [DOI] [PubMed] [Google Scholar]
- 2.Chalmers RL, Keay L, McNally JJ, Kern J. Multicenter case-control study of the role of lens materials and care products on the development of corneal infiltrates. Optom Vis Sci. 2012;89(3):316–325. doi: 10.1097/OPX.0b013e318240c7ff. [DOI] [PubMed] [Google Scholar]
- 3.Smith AF, Osborn G. Estimating the annual economic burden of illness caused by contact lens-associated corneal infiltrative events in the United States. Eye Contact Lens. 2012;38(3):164–170. doi: 10.1097/ICL.0b013e31824ccaa1. [DOI] [PubMed] [Google Scholar]
- 4.Robboy MW, Comstock TL, Kalsow CM. Contact lens-associated corneal infiltrates. Eye Contact Lens. 2003;29(3):146–154. doi: 10.1097/01.ICL.0000072830.41886.1E. [DOI] [PubMed] [Google Scholar]
- 5.Chalmers RL, Wagner H, Mitchell GL, et al. Age and other risk factors for corneal infiltrative and inflammatory events in young soft contact lens wearers from the contact lens assessment in youth (CLAY) study. Invest Ophthalmol Vis Sci. 2011;52(9):6690–6696. doi: 10.1167/iovs.10-7018. [DOI] [PubMed] [Google Scholar]
- 6.Carnt NA, Evans VE, Naduvilath TJ, et al. Contact lens-related adverse events and the silicone hydrogel lenses and daily wear care system used. Arch Ophthalmol. 2009;127(12):1616–1623. doi: 10.1001/archophthalmol.2009.313. [DOI] [PubMed] [Google Scholar]
- 7.Garofalo RJ, Dassanayake NL, Carey C, Stein J, Stone R, David R. Corneal staining and subjective symptoms with multipurpose solutions as a function of time. Eye Contact Lens. 2005;31(4):166–174. doi: 10.1097/01.icl.0000152489.99455.db. [DOI] [PubMed] [Google Scholar]
- 8.Andrasko G, Ryen K. Corneal staining and comfort observed with traditional and silicone hydrogel lenses and multipurpose solution combinations. Optometry. 2008;79(8):444–454. doi: 10.1016/j.optm.2008.04.097. [DOI] [PubMed] [Google Scholar]
- 9.Levy B. Superficial corneal “staining”-clinical observation and risk assessment. Eye Contact Lens. 2007;33(4):165–166. doi: 10.1097/ICL.0b013e31805cfed9. [DOI] [PubMed] [Google Scholar]
- 10.Papas EB, Carnt N, Willcox MD, Holden BA. Complications associated with care product use during silicone daily wear of hydrogel contact lens. Eye Contact Lens. 2007;33(6 Pr 2):392–393. doi: 10.1097/ICL.0b013e318157e542. [DOI] [PubMed] [Google Scholar]
- 11.Pritchard N, Young G, Coleman S, Hunt C. Subjective and objective measures of corneal staining related to multipurpose care systems. Cont Lens Anterior Eye. 2003;26(1):3–9. doi: 10.1016/S1367-0484(02)00083-8. [DOI] [PubMed] [Google Scholar]
- 12.Sindt CW, Grout TK, Crister DB, Kern JR, Meadows DL. Dendritic immune cells densities in the central cornea associated with soft contact lens types and lens care solution types: a pilot study. Clin Ophthalmol. 2012;6:511–519. doi: 10.2147/OPTH.S28083. [DOI] [PMC free article] [PubMed] [Google Scholar]
- 13.Situ P, Simpson TL, Jones LW, Fonn D. Effects of silicone hydrogel contact lens wear on ocular surface sensitivity to tactile, pneumatic mechanical, and chemical stimulation. Invest Ophthalmol Vis Sci. 2010;51(12):6111–6117. doi: 10.1167/iovs.09-4807. [DOI] [PubMed] [Google Scholar]
- 14.Thakur A, Willcox MD. Contact lens wear alters the production of certain inflammatory mediators in tears. Exp Eye Res. 2000;70(3):255–259. doi: 10.1006/exer.1999.0767. [DOI] [PubMed] [Google Scholar]
- 15.Torres PF, Kijlstra A. The role of cytokines in corneal immunopathology. Ocul Immunol Inflamm. 2001;9(1):9–24. doi: 10.1076/ocii.9.1.9.3978. [DOI] [PubMed] [Google Scholar]
- 16.LaFrance MW, Kehinde LE, Fullard RJ. Multiple cytokine analysis in human tears: an optimized procedure for cytometric bead-based assay. Curr Eye Res. 2008;33(7):525–544. doi: 10.1080/02713680802190085. [DOI] [PubMed] [Google Scholar]
- 17.Kinoshita S, Adachi W, Sotozono C, et al. Characteristics of the human ocular surface epithelium. Prog Retin Eye Res. 2001;20(5):639–673. doi: 10.1016/s1350-9462(01)00007-6. [DOI] [PubMed] [Google Scholar]
- 18.Nakamura Y, Sotozono C, Kinoshita S. Inflammatory cytokines in normal human tears. Curr Eye Res. 1998;17(6):673–676. [PubMed] [Google Scholar]
- 19.Thakur A, Willcox MD, Stapleton F. The proinflammatory cytokines and arachidonic acid metabolites in human overnight tears: homeostatic mechanisms. J Clin Immunol. 1998;18(1):61–70. doi: 10.1023/a:1023291921695. [DOI] [PubMed] [Google Scholar]
- 20.Lema I, Durán JS, Ruiz C, Díez-Feijoo E, Acera A, Merayo J. Inflammatory response to contact lenses in patients with keratoconus compared with myopic subjects. Cornea. 2008;27(7):758–763. doi: 10.1097/ICO.0b013e31816a3591. [DOI] [PubMed] [Google Scholar]
- 21.Rummenie VT, Matsumoto Y, Dogru M, et al. Tear cytokine and ocular surface alterations following brief passive cigarette smoke exposure. Cytokine. 2008;43(2):200–208. doi: 10.1016/j.cyto.2008.05.011. [DOI] [PubMed] [Google Scholar]
- 22.Thakur A, Willcox MD. Cytokine and lipid inflammatory mediator profile of human tears during contact lens associated inflammatory diseases. Exp Eye Res. 1998;67(1):9–19. doi: 10.1006/exer.1998.0480. [DOI] [PubMed] [Google Scholar]
- 23.Fodor M, Facskó A, Rajnavölgyi É, et al. Enhanced release of IL-6 and IL-8 into tears in various anterior segment eye diseases. Ophthalmic Res. 2006;38(4):182–188. doi: 10.1159/000093068. [DOI] [PubMed] [Google Scholar]
- 24.Leonardi A, Tavolato M, Curnow SJ, Fregona SJ, Violato D, Alió JL. Cytokine and chemokine levels in tears and in corneal fibroblast cultures before and after excimer laser treatment. J Cataract Refract Surg. 2009;35(2):240–247. doi: 10.1016/j.jcrs.2008.10.030. [DOI] [PubMed] [Google Scholar]
- 25.Fodor M, Gogolák P, Rajnavölgyi É, et al. Long-term kinetics of cytokine response in human tears after penetrating keratoplasty. J Interferon Cytokine Res. 2009;29(7):375–379. doi: 10.1089/jir.2008.0116. [DOI] [PubMed] [Google Scholar]
- 26.Acera A, Rocha G, Vecino E, Lema I, Durán JA. Inflammatory markers in the tears of patients with ocular surface disease. Ophthalmic Res. 2008;40(6):315–321. doi: 10.1159/000150445. [DOI] [PubMed] [Google Scholar]
- 27.Lam H, Bleiden L, de Paiva CS, Farley W, Stern ME, Pflugfelder SC. Tear cytokine profiles in dysfunctional tear syndrome. Am J Ophthalmol. 2009;147(2):198–205. doi: 10.1016/j.ajo.2008.08.032. [DOI] [PMC free article] [PubMed] [Google Scholar]
- 28.Enriquez-de-Salamanca A, Castellanos E, Stern ME, et al. Tear cytokine and chemokine analysis and clinical correlations in evaporative-type dry eye disease. Mol Vis. 2010;16:862–873. [PMC free article] [PubMed] [Google Scholar]
- 29.VanDerMeid KR, Su SP, Ward KW, Zhang JZ. Correlation of tear inflammatory cytokines and matrix metalloproteinases with four dry eye diagnostic tests. Cornea. 2012;53(3):1521–1518. doi: 10.1167/iovs.11-7627. [DOI] [PubMed] [Google Scholar]
- 30.Uchio E, Ono S-Y, Ikezawa Z, Ohno S. Tear levels of interferon-g, interleukin (IL)-2, IL-4 and IL-5 in patients with vernal keratoconjunctivitis, atopic keratoconjunctivitis and allergic conjunctivitis. Clin Exp Allergy. 2000;30(1):103–109. doi: 10.1046/j.1365-2222.2000.00699.x. [DOI] [PubMed] [Google Scholar]
- 31.Enriquez-de-Salamanca A, Calonge M. Cytokines and chemokines in immune-based ocular surface inflammation. Expert Rev Clin Immunol. 2008;4(4):457–467. doi: 10.1586/1744666X.4.4.457. [DOI] [PubMed] [Google Scholar]
- 32.Tran HV, Eperson S, Guex-Crosier Y. Persistence of increased eotaxin-1 (CCL11) level in tears of patients wearing contact lenses: a long-term follow-up study. Klin Monatsbl Augenheilkd. 2011;228(4):326–329. doi: 10.1055/s-0031-1273208. [DOI] [PubMed] [Google Scholar]
- 33.Jeong JH, Chun Y, Kim ES, Kim JC. Compensatory growth factor and cytokine response in tears after subconjunctival bevacizumab injection. Cornea. 2011;30(10):1071–1077. doi: 10.1097/ICO.0b013e31820cd3f4. [DOI] [PubMed] [Google Scholar]
- 34.Nivenius E, Van der Ploeg I, Gafvelin G, Van Hage M, Montan PG. Conjunctival provocation with airborne allergen in patients with atopic keratoconjunctivitis. Clin Exp Allergy. 2012;42(1):58–65. doi: 10.1111/j.1365-2222.2011.03858.x. [DOI] [PubMed] [Google Scholar]
- 35.Kallinikos P, Morgan P, Efron N. Assessment of stromal keratocytes and tear film inflammatory mediators during extended wear of contact lenses. Cornea. 2006;25(1):1–10. doi: 10.1097/01.ico.0000167877.11687.7e. [DOI] [PubMed] [Google Scholar]
- 36.Schultz CL, Kunert KS. Interleukin-6 levels in tears of contact lens wearers. J Interferon Cytokine Res. 2000;20(3):309–310. doi: 10.1089/107999000312441. [DOI] [PubMed] [Google Scholar]
- 37.Moschos MM, Eperon S, Guex-Crosier Y. Increased eotaxin in tears of patients wearing contact lenses. Cornea. 2004;23(8):771–775. doi: 10.1097/01.ico.0000133987.34274.c0. [DOI] [PubMed] [Google Scholar]
- 38.Dogru M, Ward SK, Wakamatsu T, et al. The effects of 2 week senofilcon-A silicone hydrogel contact lens daily wear on tear functions and ocular surface health status. Cont Lens Anterior Eye. 2011;34(2):77–82. doi: 10.1016/j.clae.2010.12.001. [DOI] [PubMed] [Google Scholar]
- 39.Poyraz C, Irkec M, Mocan MC. Elevated tear interleukin-6 and interleukin-8 associated with silicone hydrogel and conventional hydrogel contact-lens wear. Eye Contact Lens. 2012;38(3):146–149. doi: 10.1097/ICL.0b013e3182482910. [DOI] [PubMed] [Google Scholar]
- 40.Sorbara L, Peterson R, Woods C, Fonn D. Multipurpose disinfecting solutions and their interactions with a silicone hydrogel lens. Eye Contact Lens. 2009;35(2):92–97. doi: 10.1097/ICL.0b013e318199df54. [DOI] [PubMed] [Google Scholar]
- 41.Jones L, MacDougall N, Sorbara LG. Asymptomatic corneal staining associated with the use of balafilcon silicone-hydrogel contact lenses disinfected with a polyaminopropyl biguanide-preserved care regimen. Optom Vis Sci. 2002;79(12):753–761. doi: 10.1097/00006324-200212000-00007. [DOI] [PubMed] [Google Scholar]
- 42.Zigler L, Cedrone R, Evans DJ, Helbert-Green C, Shah T. Clinical evaluation of silicone hydrogel lens wear with a new multipurpose disinfection care product. Eye Contact Lens. 2007;33(5):236–243. doi: 10.1097/ICL.0b013e318030c959. [DOI] [PubMed] [Google Scholar]
- 43.Lipener C, Contact Lens Advisory in Scientific Studies (CLASS) group A randomized clinical comparison of OPTI-FREE EXPRESS and ReNu MultiPLUS multipurpose lens care solutions. Adv Ther. 2009;26(4):435–446. doi: 10.1007/s12325-009-0023-8. [DOI] [PubMed] [Google Scholar]
- 44.Lebow KA, Schachet JL. Evaluation of corneal staining and patient preference with use of three multi-purpose solutions and two brands of soft contact lenses. Eye Contact Lens. 2003;29(4):213–220. doi: 10.1097/01.icl.0000081601.75812.03. [DOI] [PubMed] [Google Scholar]
- 45.Szczotak-Flynn L, Lass JH, Sethi A, et al. Risk factors for corneal infiltrative events during continuous wear of silicone hydrogel contact lenses. Invest Ophthalmol Vis Sci. 2010;51(11):5421–5430. doi: 10.1167/iovs.10-5456. [DOI] [PMC free article] [PubMed] [Google Scholar]
- 46.Efron N. Putting vital stains in context. Clin Exp Optom. 2012 2012 Oct 12; doi: 10.1111/j.1444-0938.2012.00802.x. Epub. [DOI] [PubMed] [Google Scholar]
- 47.Kilvington S, Shovlin J, Nikolic M. Identification and susceptibility to multipurpose disinfectant solutions of bacteria isolated from contact lens storage cases of patients with corneal infiltrative events. Cont Lens Anterior Eye. 2013 Mar 1; doi: 10.1016/j.clae.2013.02.001. Epub. [DOI] [PubMed] [Google Scholar]