

Abstract
Exposure to environmental stressors such as cigarette smoke (CS) elicits a variety of biological responses in humans, including the induction of inflammatory responses. These responses are especially pronounced in the lung, where pulmonary cells sit at the interface between the body’s internal and external environments. We combined a literature survey with a computational analysis of multiple transcriptomic data sets to construct a computable causal network model (the Inflammatory Process Network (IPN)) of the main pulmonary inflammatory processes. The IPN model predicted decreased epithelial cell barrier defenses and increased mucus hypersecretion in human bronchial epithelial cells, and an attenuated pro-inflammatory (M1) profile in alveolar macrophages following exposure to CS, consistent with prior results. The IPN provides a comprehensive framework of experimentally supported pathways related to CS-induced pulmonary inflammation. The IPN is freely available to the scientific community as a resource with broad applicability to study the pathogenesis of pulmonary disease.
Keywords: inflammation, cigarette smoke, network model, gene expression, biological expression language (BEL), reverse causal reasoning (RCR)
Introduction
Inflammation can be triggered by various insults, such as infection, tissue injury, and cellular stress. Even though it can lead to pathological consequences, acute inflammation itself is not a disease. It is merely the organism’s response to these triggers to maintain tissue homeostasis, and depending on the trigger, outcomes vary widely.1
Pulmonary cells are exceptionally susceptible to the harmful effects of environmental insults, including cigarette smoke (CS). CS is a complex mixture estimated to contain over 5,000 unique chemical species.2–4 Chronic exposure to CS has been linked to the development and progression of a variety of lung diseases, such as chronic obstructive pulmonary disease (COPD), including emphysema and bronchitis.5,6 Although the specific sequence of events leading to pathology are under active investigation, recent studies have illuminated the central contribution of inflammatory responses to CS-induced diseases.7–10 In addition to COPD, chronic inflammation has also been named as one of the hallmarks of cancer,11 and COPD and lung cancer are believed to share common mechanisms.12 While several inflammatory processes are linked to the non-resolving “chronic inflammation phase” that is typical of the progressive phase of COPD, there is a subset of inflammatory processes that occur in an undiseased lung upon environmental exposures, and that will resolve after the tissue has recovered from the insult. These processes are of importance for understanding the “normal” inflammatory mechanisms that, when overwhelmed, may lead to self-perpetuating “chronic” inflammation.
Exposure to CS has been reported to induce or potentiate inflammation through a variety of mechanisms involving multiple cell types.13–15 Airway and alveolar epithelial cells, resident lung macrophages, and dendritic cells are the initial cellular targets of pulmonary CS exposure, and in response, these cells produce potent chemoattractants that recruit inflammatory cells from the systemic circulation, notably neutrophils, macrophages, and T-cells, into the lung microenvironment.13,15,16 Chronic exposure to CS can lead to increased airway cell damage/death, which further exacerbates pulmonary inflammation through the release of damage-associated molecular pattern molecules (DAMPs).17–19Additionally, recent research suggests that chronic CS exposure can also alter the pro- and anti-inflammatory activity of cells within the inflamed pulmonary environment.20–24 Thus, although the exact mechanisms remain to be fully elaborated, CS exposure can modulate and enhance pulmonary inflammation through several distinct yet partially overlapping mechanisms involving multiple cell types. Over time, the persistence of these mechanisms in the lung can lead to the disease-linked phenotypes of goblet cell metaplasia/mucus hypersecretion, airway remodeling, and alveolar destruction.25–27
Current knowledge of the role of inflammation in CS-induced disease is built on decades of research into the molecular underpinnings of specific inflammatory processes such as macrophage activation.28–30 Classically studied by manipulating in vitro and in vivo systems, early research into the mechanisms that govern pulmonary inflammation relied on investigators placing the interpretation of experimental results in the context of a relatively small number of measurements (eg, the production of IL8 mRNA following exposure of bronchial epithelial cells to CS).29,31,32 More recently, the availability of systems-wide technologies (eg, transcriptomics, proteomics, and metabolomics) have enabled the analysis of pulmonary inflammation using complex data sets capable of measuring thousands of differentially expressed molecular species following experimental manipulation.33–35 These investigations have made significant inroads into our understanding of the temporal and cell-type specific (eg, Clara cells, alveolar macrophages) complexities of inflammation, especially when applied to human systems in vivo.36,37 As a corollary, the availability of comprehensive network models of inflammation against which experimental results may be evaluated has emerged as a practical requirement for interpreting and gaining mechanistic insight from content–dense experimental data. Ideally, an appropriate network model of CS-related inflammatory processes should (1) provide coverage of the specific pathways that are modulated by CS, (2) be based on a large body of known biological cause and effect relationships derived from the published scientific literature, (3) be compatible with the analysis of molecular profiling data sets, and (4) address the multiple cell types that are active in the pulmonary environment during inflammation.
We are building a series of biological network models reflecting smoking-related molecular changes in the target tissues of the lung and the cardiovascular system. Continuing with a network-modeling strategy that has already produced network models describing cell proliferation38 and cellular stress,39 we present here the Inflammatory Process Network (IPN) model. It should be noted that inflammatory processes occurring during the chronic disease phase will be addressed separately in a COPD network, while the current network model describes the initial inflammatory pathways that are known to be elicited or influenced by CS exposure in an undiseased lung. As proof of concept, we used a subset of the network in combination with computational analyses of transcriptomic profiling data from three different CS-relevant experimental systems to assess some of the known mechanisms of pulmonary inflammation. The content of the network is freely available and, along with previously published networks, can serve as an invaluable research tool for the wider pulmonary biology research community.
Methods
Knowledgebase
The nodes and edges comprising the IPN model were assembled from the Selventa Knowledgebase, a comprehensive repository containing over 1.5 million nodes (biological concepts and entities) and over 7.5 million edges (assertions about causal and non-causal relationships between nodes). The assertions in the Selventa Knowledgebase are derived from peer-reviewed scientific literature as well as other public and proprietary databases. Specifically, each assertion describes an individual experimental observation from an experiment performed in a human, mouse, and rat species context, either in vitro or in vivo. Assertions also capture information about the referring source (eg, the PubMed ID (PMID) for journal articles listed in MEDLINE), as well as key contextual information including the species (human, mouse, or rat) and the tissue or cell line from which the experimental observation was derived. An example causal assertion is the increased transcriptional activity of NFkB causes an increase in the mRNA expression of CXCL1 (HeLa cell line; Human; PMID 16414985). The Knowledgebase contains causal relationships derived from healthy tissues and disease areas such as inflammation, metabolic diseases, cardiovascular injury, liver injury, and cancer. While the Selventa Knowledgebase is a private commercial resource, a subset of the information contained in it as well as a freely available implementation of RCR called Whistle have recently been made publically available via the OpenBEL initiative (http://www.openbel.org).
Analysis of transcriptomic data sets
Three published data sets, GSE18341 (LPS-exposed mouse lung), GSE22886 (dendritic cell activation, monocyte-macrophage differentiation, NK cell activation, Th1 differentiation, and Th2 differentiation), and GSE2322 (LPS-exposed neutrophils), were used to construct the IPN model (Supplemental Fig. 6). three additional data sets, GSE994 (in vivo bronchial epithelial cells), E-MTAB-874 (in vitro bronchial epithelial cells), and GSE13896 (in vivo macrophages), were used to demonstrate the utility of select IPN sub-models. All data sets except for E-MTAB-874 (the raw data generated by PMI Research and Development and analyzed for this manuscript prior to their deposition in a public gene expression repository) were downloaded from Gene Expression Omnibus (GEO; http://www.ncbi.nlm.nih.gov/gds). Raw RNA expression data for each data set were analyzed using the “affy” and “limma” packages of the Bioconductor suite of microarray analysis tools available for the R statistical environment.85–88 Robust Microarray Analysis (RMA) background correction and quantile normalization were used to generate microarray expression values. An overall linear model was fitted to the data for all sample groups, and specific contrasts of interest were evaluated to generate raw P-values for each probe set on the expression array.89 The Benjamini–Hochberg False Discovery Rate method was then used to correct for multiple testing effects. For GSE2322, we only considered transcriptomic data from the 12 patients for which complete data (circulating neutrophils pre- and post-LPS, and air space neutrophils post-LPS) was available, and we accounted for patient to patient variability by blocking by patient when fitting the linear model.
Probe sets were considered to have statistically significant changed expression levels in a specific comparison if they had an adjusted P-value of less than 0.05, an absolute fold change greater than 1.3, and an average expression intensity greater than 150. NetAffx version na31 feature annotation files, available from Affymetrix (http://www.Affymetrix.com), were used for mapping of probe sets to genes. In our analysis, genes represented by multiple probe sets were considered to have changed if at least one probe set was observed to change. Gene expression changes that met these criteria are called “State Changes” and have the directional qualities of “increased” or “decreased”, ie, they were up-regulated or down-regulated, respectively, in response to the experimental condition. The number of State Changes for each data set is listed in Supplemental Figure 6.
Reverse Causal Reasoning (RCR): Automated hypothesis generation
RCR analysis of the six inflammation transcriptomic data sets was used to generate lists of nodes that were predicted to be increased or decreased, and these lists of nodes were used to aid in the selection of nodes for inclusion in the IPN model or to evaluate the data set using the IPN model. RCR interrogates the Selventa Knowledgebase to identify potential upstream controllers of entities observed to change significantly in an experiment (manuscript submitted). Here we applied RCR to the mRNA State Changes in the six transcriptomic data sets to predict hypothetical upstream controllers for the expression changes. These potential upstream controllers identified by RCR are called “HYPs”, as they represent statistically significant hypotheses that are potential explanations for the observed downstream RNA State Changes. Specifically, the upstream HYP is a potential explanation for the subset of State Changes that are causally downstream of the HYP in individual assertions in the Selventa Knowledgebase.
Each HYP is scored according two probabilistic scoring metrics, richness and concordance. Richness is the probability that the number of observed RNA State Changes connected to a given HYP could have occurred by chance alone, calculated using the hyper-geometric distribution. Concordance is the probability that the number of observed RNA State Changes that match the direction of the HYP (eg, increased or decreased activity or abundance of a node) could have occurred by chance alone, calculated using a binomial distribution. HYPs meeting both richness and concordance P-value cutoffs of 0.1 were considered to be statistically significant. When performing control analyses, applying these significance cutoffs to randomly generated data (with similar numbers of RNA State Changes as the experimental data) generally produces less than 5% of the number of HYPs meeting both significance criteria than are observed for experimental data (not shown). For the purposes of network model construction, each scored HYP meeting the minimum statistical cutoffs for richness and concordance was evaluated and selected for integration based on its biological plausibility and relevance to the perturbation and biological context (eg, cell type) of the experiment applying a manual curation process. For data set interrogation, scored HYPs meeting these same statistical cutoffs were considered, with the understanding that as potential explanations for a subset of State Changes, the connectivity and consistency of direction of individual HYPs needed to be considered within context of the models manuscript in preparation.
The IPN model accompanies this manuscript in the eXtensible Graph Markup and Modeling Language (.XGMML) (Supplemental File 1) format, and can be viewed using freely available network visualization software such as Cytoscape (http://www.cytoscape.org/).
Results
IPN model description
Network model structure
In order to capture the contribution of multiple cell types to pulmonary inflammation, the IPN model was constructed using a modular schema, with the larger network model comprised of constituent sub-models. The 24 IPN sub-models (Fig. 1, Supplemental Fig. 1) focus on the main cell types known to be involved in CS-induced pulmonary inflammation. Specifically, we generated sub-models for pulmonary epithelial cells, macrophages, neutrophils, T-cell subsets (Th1, Th2, Th17, Treg, and Tc), NK cells, dendritic cells, mega-karyocytes, and mast cells. Within each sub-model, an input-output design was used; sub-model inputs are signaling ligands/triggers that induce or suppress an intracellular signaling cascade, while sub-model outputs are the cellular/physiological products of these signaling pathways, largely secreted cytokines or biological processes. While each sub-model was constructed to reflect the biological relationships that are involved in particular cell types, the sub-models contain shared elements. For example, since the transcription factor NFkB is a pleiotropic protein involved in multiple inflammatory pathways, the node “transcriptional activity of NFkB” exists in multiple IPN sub-models, with different upstream regulators depending on the focus of the sub-model. The XGMML encoding of the sub-models allows for the assembly of the IPN as a single network using freely available network visualization software such as Cytoscape.
Figure 1.

IPN model overview—(A) The IPN model is designed to capture the inflammation related signaling in response to CS. Its constituent submodels represent the signaling that occurs in the main cell types involved in CS-induced pulmonary inflammation, including epithelial cells and macrophages. (B) Functional modularity was introduced into the IPN by the construction of 23 submodels.
Network model construction and boundaries
Nodes in the IPN model are biological entities such as mRNA expressions, protein abundances, or protein activities. Nodes can also represent biological processes, such as “tight junction formation” or “monocyte adherence”. Edges are relationships between nodes and are broadly classified as causal or non-causal. Causal edges are directional cause-effect relationships between biological entities as reported in the scientific literature. (eg, the increased kinase activity of JAK1 increases the transcriptional activity of STAT3). Non-causal edges connect different forms of a biological entity, such as the abundance of a protein and its activity. For example the protein abundance of STAT3 is connected by a non-causal edge to the transcriptional activity of STAT3, since no casual relationship is inferred between the abundance of a protein and its biological activity. Protein-protein interactions are reflected in the network as complexes between the constituent proteins.
The IPN model was constructed by the same two-step process used to produce previously published network models.38,39 First, a survey of the scientific literature was done to identify CS-relevant inflammatory signaling mechanisms. These mechanisms were compiled into a literature model, which was constructed via cell-type focused sub-models through the extraction of causal relationships from the Selventa Knowledgebase, a unified collection of over 1.5 million elements of biological knowledge captured from the public literature and other sources. Where appropriate causal statements did not already exist in the Selventa Knowledgebase, statements were manually curated from the literature and deposited into the Knowledgebase. This literature model was then augmented with additional nodes derived from reverse causal reasoning (RCR) analysis of transcriptomic profiling experiments that assessed specific inflammation-relevant processes. This augmentation by RCR helps uncover relevant nodes not identified during the literature portion of model building, and strengthens the model’s capability to interpret transcriptomic data sets. RCR is computational methodology that uses a set of differentially measured biological entities (eg, mRNA or protein abundance) as input, and makes predictions about the identity of potential upstream controllers of the observed differential measurements (http://www.openbel.org). These predictions, called hypotheses (HYPs), were included in a model if they had been shown in the literature to be mechanistically involved in the process of interest. The three data sets used for RCR augmentation of the IPN model are summarized in Supplemental Figure 6. These data sets represent mouse whole lung exposed to LPS in vivo (GSE18341), dendritic cell activation/monocyte-macrophage differentiation/NK cell activation in response to IL15/Th1 differentiation/Th2 differentiation in vitro (GSE22886), and pulmonary neutrophils exposed to LPS in vivo (GSE2322). In the case of mouse whole lung exposed to LPS (GSE18341), the candidate nodes hypothesized by RCR were potentially derived from any relevant pulmonary and immune cell types that are present in the lung and were either activated by LPS or modulated due to responses of cells to LPS. Whole lung transcriptomic data following LPS-exposure was used to build the network for two main reasons. First, we wanted to ensure representation of the canonical pathways induced by LPS, a prototypical pro-inflammatory agent. Second, because previous reports indicate that the pulmonary inflammatory response to CS is mediated by many of the same signal transduction pathways that are activated by LPS,40–42 we wanted to ensure broad coverage of these biological mechanisms prior to the analysis of data from CS-exposed systems.
The network model was constructed to depict biological mechanisms related to inflammatory responses elicited by exposure to CS in disease-free pulmonary and immune cell types, with a particular focus on avoiding mechanisms of inflammation that are potentially specific to a particular pathological tissue context. Thus, as much as possible, the literature-derived supporting evidence for a model edge was based on experimental support from non-pathological primary tissue, with a particular emphasis on edge support from the same cell type a sub-model represented (eg, edges in the dendritic cell activation sub-model contained support from mechanistic studies done in dendritic cells).
Investigation of transcriptomic data sets using the IPN model
We were interested in using the IPN to understand which processes are modulated by CS exposure, as we expect that CS, like any other pulmonary insult, may activate only a subset of processes and signaling pathways described in the IPN. The degree to which CS activates different biological processes can depend on dose, exposure route, time and the system under investigation. Take for example a recent study evaluating the temporal effects of CS exposure in rat lung in vivo. The investigators noted that while 3 days of CS exposure was insufficient to recruit macrophages into the lung, by 26-weeks of exposure the number of lung macrophages in CS-exposed animals had increased roughly 3-fold relative to sham exposed animals.33 Likewise, in a recently published study examining the dose dependent effects of CS in mouse lung in vivo, the level of macrophage derived metalloproteinase MMP12 gene expression was unchanged after 24 hours of CS exposure, but increased over 40-fold after two months of exposure.43 These studies, as well as others like them, serve to underscore our expectation that the signals emerging in the IPN from any given data set are dependent on multiple experimental factors.
First, we used the macrophage activation sub-model to analyze transcriptomic profiling data derived from alveolar macrophages isolated from smokers and non-smokers. Because previous reports have described the effects of CS on lung macrophage activation using gene expression data,24,44 this provided us an opportunity to (1) use input data derived from a single, purified cell type, (2) use a single, cell-type matched IPN sub-model, and (3) compare our results with results from published literature using an independent data set. Next, we used a transcriptomic data set where the underlying experimental setup allowed us to use multiple IPN sub-models from the same cell type. Here, differential gene expression profiles were generated from human bronchial epithelial cells of smokers compared to non-smokers. We used the epithelial barrier defense, epithelial cell pro-inflammatory signaling, and mucus hypersecretion sub-models to investigate the mechanistic effects of long term CS exposure on lung epithelial cells in vivo. Last, we used a data set with a temporal component to analyze an IPN sub-model over time. The mucus hypersecretion sub-model was selected for this, as the production of mucus is a well known acute response of the airway epithelium to irritants like CS or its chemical constituents (eg, acrolein).45–48
Analysis of Alveolar Macrophages Derived from Human Smokers and Non-Smokers
We first interrogated a transcriptomic data set where gene expression in alveolar macrophages isolated from smokers was compared to non-smokers, GSE13896.49 Although this study included patients with COPD, we focused our analysis on the comparison between healthy smokers and non-smokers. We used the macrophage activation IPN sub-model, which represents pro-inflammatory signaling via the induction of NFkB and AP-1 transcription factors. The functional activation state (referred to as “polarization”) of macrophages is classified into discrete classes based on (1) the stimuli they respond to, and (2) the chemokine panel they produce. M1 polarized macrophages (also known as “classically” activated) respond to LPS and IFNG and produce Th1 cytokines, promoting an inflammatory state. M2 polarized macrophages (also known as “alternatively” activated) respond to IL4, TGFB and/or IL10, and generally promote tissue remodeling and angiogenesis.50,51 The authors found that alveolar macrophages from smokers displayed an M2 phenotype, associated with tissue remodeling, when compared to macrophages from non-smokers that displayed a pro-inflammatory M1 phenotype.49,50 Under these definitions, the biology represented in the macrophage activation sub-model most closely resembles that of pro-inflammatory M1 polarized macrophages. RCR analysis of GSE13896 produced 18 HYPs that correspond to nodes in the macrophage activation sub-model (Fig. 2, Supplemental Fig. 2). Remarkably, 15 of the 18 HYPs supported decreased macrophage activation (indicative of decreased M1-polarization) in smokers compared to non-smokers. These HYPs included decreased activity of receptors (TLR2, TLR3, TLR4, and PTGER4) and transcription factors (eg, NF-ĸB, SP1, Stat1, and IRF3) that mediate M1 macrophage polarization. In addition, a HYP for increased activity of PPARA, a known inhibitor of M1 macrophage polarization,52 was predicted. Only HYPs for decreased activity of SIRT1 and increased PTGER4 protein levels supported increased macrophage activation, while a HYP for decreased hyaluronate signaling supported both increased and decreased macrophage activation via different mechanisms. As indirect support for an increased M2 phenotype in macrophages isolated from smokers compared to non-smokers, RCR predicted HYPs for increased levels of glucocorticoid, increased transcriptional activity of the glucocorticoid receptor (NR3C1) and TGFB1 levels, both of which are associated with M2 macrophage activation.53,54 These results were not due to a general directional bias in HYPs, as RCR produced a relatively even distribution in total HYPs predicted to increase (n = 86) and to decrease (n=77).
Figure 2.

IPN model investigation of CS-exposed alveolar macrophages.
Notes: HYPs from analysis of GSE13896 are colored based on whether they were predicted increased (yellow) or decreased (blue). Gene expression State Changes are colored according to their observed change of increased (red) or decreased (green). A high resolution model image, is available in Supplemental Figure 2.
Analysis of bronchial epithelial cells exposed to CS in vivo
In order to further evaluate the IPN using different sub-models, a data set (GSE994) consisting of gene expression profiles from bronchial brushings of healthy smokers and non-smokers was used.55 We applied the IPN sub-models that focused on epithelial cell biology (Epithelial Barrier Defense, Epithelial Cell Pro-inflammatory Signaling, and Mucus Hypersecretion) for these analyses.
We first interrogated GSE994 using the Epithelial Barrier Defense sub-model. RCR analysis of GSE994 produced a number of HYPs suggesting that CS compromises epithelial barrier function (Fig. 3, Supplemental Fig. 3); HYPs for increased IL1B and NRG1 abundance in smokers compared to non-smokers provide evidence for activation of a cascade from IL1B through ADAM17, NRG1, and HER2, leading to increased tight junction permeability.56 In addition, HYPs for increased reactive oxygen species (ROS) and response to oxidative stress also suggest that tight junction permeability may be increased in smokers.57 Finally, smokers have increased expression of 5 genes involved in tight junction function (OCLN, CTNNA1, CLDN7, CLDN10, and TJP2). Together, these data suggest that bronchial epithelial cells in smokers experience environmental stimuli (IL1B and oxidative stress) that may compromise barrier function, and respond with increased expression of various tight junction proteins.
Figure 3.

IPN model investigation of CS-exposed epithelial cell barrier defense.
Notes: HYPs from analysis of GSE994 are colored based on whether they were predicted increased (yellow) or decreased (blue). Gene expression State Changes are colored according to their observed change of increased (red) or decreased (green). The pathways discussed in the text are likewise highlighted based on whether they support the same outputs. HYPs and edges that support increased pathways are shown in yellow lines while decreased pathways are shown in blue lines. A high resolution model image is available in Supplemental Figures 3 and 4.
Next, we evaluated GSE994 using the Epithelial Cell Pro-inflammatory Signaling sub-model. RCR analysis of GSE994 produced a limited number of HYPs that corresponded to nodes in the model (HYPs for increased IL1B and IL13 levels, and increased transcriptional activity of AP-1; Supplemental Figs. 4 and 5). These HYPs failed to describe a consistent and plausible mechanistic readout of pro-inflammatory signaling.
Last, we interrogated GSE994 using the Mucus Hypersecretion sub-model. RCR analysis of GSE994 produced HYPs for increased ROS, increased TGFA, increased acrolein (a chemical component of CS), and increased transcriptional activity of AP-1 (Fig. 4, Supplemental Fig. 6). Together, these HYPs suggest that MUC5AC, one of the primary airway mucins, is expressed via activation of AP-1 through a pathway from ROS signaling through TGFA, EGFR, and ERK.58,59 In support of this mechanism, MUC5AC gene expression increased in smokers compared to non-smokers in GSE994. RCR analysis also produced HYPs for increased IL13 abundance, increased kinase activity of MAPK14, increased HIFA protein abundance, and increased transcriptional activity of HIF1A. Together, these HYPs support the premise of Th2-mediated expression of MUC5AC via IL13 signaling through STAT6, MAPK14, and HIF1A.60,61 In addition, the gene expression of SPDEF and AGR2, 2 genes implicated in IL13-dependent formation of mucus-secreting pulmonary goblet cells,62,63 are increased in smokers versus non-smokers. No HYPs were predicted supporting reduced MUC5AC expression or mucus production in general.
Figure 4.

IPN model investigation of CS-exposed epithelial cell mucus hypersecretion.
Notes: HYPs from analysis of GSE994 are colored based on whether they were predicted increased (yellow) or decreased (blue). Gene expression State Changes are colored according to their observed change of increased (red) or decreased (green). The pathways discussed in the text are likewise highlighted based on whether they support the same outputs. HYPs and edges that support increased pathways are shown in yellow lines while decreased pathways are shown in blue lines. A high resolution model image is available in Supplemental Figure 6.
Temporal analysis of CS-exposed bronchial epithelial cells in vitro
The analysis of GSE994 provided an evaluation of the effects of CS on human lung epithelium following chronic exposure in vivo. As an alternative application of the IPN sub-models to experimental data, we evaluated the IPN mucus hypersecretion sub-model using data from E-MTAB-874, a data set where organotypically differentiated human bronchial epithelial cells in air-liquid interface culture were acutely exposed to CS in vitro. Specifically, we evaluated data from human bronchial epithelial cells exposed to CS in vitro for 28 minutes, followed by transcriptomic profiling at 0.5, 2, 4, 24, and 48 hours post-exposure. This data series allowed us to evaluate the patterns of a single IPN sub-model across a temporal window. We focused on the Mucus Hypersecretion sub-model for 2 main reasons. First, the production of mucin is a well-established response by the airway epithelium to acute CS-exposure,64–67 and second, it provided an opportunity to compare the results with analysis of GSE994, where the Mucus Hypersecretion sub-model indicated a substantial biological signal that differentiated smokers from non-smokers.
Structurally, the mucus hypersecretion model comprises four biological pathways that have been reported to induce the production of the main airway mucin, MUC5AC (Fig. 5). Two of these pathways are activated by the extracellular ligands TNF and IL13, while the remaining two pathways can be induced by a variety of extracellular stimuli, but converge on the activities of SP-1 and AP-1 transcription factors.14,16 We first asked which pathways were overrepresented at the HYP level in the post-exposure series in E-MTAB–874. As shown in Figures 6–11, HYPs in the AP-1, SP-1, and TNF pathways were enriched relative to the IL13 pathway, an indication that these pathways were preferentially modulated in response to CS. Notably, 14 nodes in the AP-1 pathway were predicted as HYPs in E-MTAB-874.
Figure 5.

Pathway detail for the IPN: Mucus Hypersecretion model.
Notes: The Mucus Hypersecretion model contains signaling detail from four main pathways known to induce airway MUC5AC production. The TNF pathway (purple) includes the TNFR ligands TNF and TNFRSF1A and culminates in the transcriptional activation of NFkB. The IL13 pathway (red), describes the molecular events leading to epithelial cell differentiation into mucin-producing goblet cells through the cytokine IL13 and the transcription factor, SPDEF. The SP-1 pathway (green) describes the routes leading to transcriptional activation of MUC5AC by the transcription factor SP-1, and includes the upstream signaling kinases, PKA, PKC and MAPK14. The AP-1 pathway (blue) includes the primary pathways that activate MUC5AC expression via EGFR activation and the signaling intermediate, reactive oxygen species (ROS).
Figure 6.

Temporal activation of AP-1 mediated MUC5AC production following acute CS exposure.
Notes: The results of RCR analysis on E-MTAB-874 in the AP-1 pathway of the Mucus Hypersecretion model. Fourteen of the AP-1 pathway nodes were predicted as a HYP in one more of the recovery time points. The heat map is color coded according to the HYP concordance P-values, where yellow-orange shades indicate inferred increases in abundance or activity and blue shades indicate inferred decreases in abundance or activity. Lower P-values for concordance are indicated by darker shades. The numerical label indicates the number of State Changes supporting each prediction. Cells with an asterisk (*) indicate HYPs where the P-value for richness was not met, despite a passing P-value for concordance. A full description can be found in Supplemental File 3.
Figure 11.

Temporal suppression of TNF mediated MUC5AC production following acute CS exposure.
Notes: HYPs and State Changes from the RCR analysis of E-MTAB-874 mapped to the TNF pathway of the Mucus Hypersecretion model. The model is color-coded according to the HYP concordance P-values, where yellow-orange shades indicate inferred increases in abundance or activity and blue shades indicate inferred decreases in abundance or activity. Lower P-values for concordance are indicated by darker shades. Gene expression State Changes are colored according to their observed change of increased (red) or decreased (green). Red lines indicate activated pathways while blue lines indicated pathways that are suppressed.
In order to gain further mechanistic insight into the biological effects of acute CS exposure on bronchial epithelial cells, we mapped the RCR predicted HYPs to the 4 main pathways in the mucus hypersecretion model across the five post-exposure time points (Figs. 6–11). The AP-1 pathway showed the most striking pattern of activation (Figs. 6 and 7). Acrolein, an aldehyde component of CS known to induce airway mucus production, was predicted as a HYP as early as 0.5 hours after exposure. The transcriptional activity of AP-1, a central mediator of MUC5AC gene expression, was predicted to increase at the 2, 4, and 24 hours post-exposure time points, just prior to the observed increase in MUC5AC mRNA levels as detected by microarray profiling. In addition, HYPs for increased levels of EGF and ROS as well as increased kinase activities of ERK1, ERK2, and PKC were consistently predicted between the 2 hour and 24 hour time points. The AP-1 pathway reached maximal activation by 24 hours post-exposure, with additional predictions for increased kinase activities of SRC and MAPK8. At 48 hours post-exposure, activation of the AP-1 pathway declined dramatically from its level at 24 hours, with most HYPs predicted to be marginally increased or decreased.
Figure 7.

Temporal activation of AP-1 mediated MUC5AC production following acute CS exposure.
Notes: HYPs and State Changes from the RCR analysis of E-MTAB-874 mapped to the AP-1 pathway of the Mucus Hypersecretion model. The model is color coded according to the HYP concordance P-values, where yellow-orange shades indicate inferred increases in abundance or activity and blue shades indicate inferred decreases in abundance or activity. Lower P-values for concordance are indicated by darker shades. Gene expression State Changes are colored according to their observed change of increased (red) or decreased (green). Red lines indicate activated pathways while blue lines indicated pathways that are suppressed.
The general SP-1 pathway also showed a striking pattern of activation following CS exposure, with predictions for increased abundance of HIF1A and cyclic AMP as well as the kinase activities of PKA, PKC, and MAPK14 from 2 hours to 24 hours (Figs. 8 and 9). The SP-1 pathway peaked at 4 hours, with causally linked predictions for increased cyclic AMP and its downstream target PKA, increased kinase activity of PKC, and increased kinase activity of MAPK14 (which can be activated by both PKA and PKC) (Fig. 9). However, when looking at the specific HYP for the transcriptional activity of SP-1, in its function as a direct regulator of MUC5AC gene expression, it was generally predicted to be increased, but did not meet the statistical cut-offs for significance at any of the post-exposure time points. As with the AP-1 pathway, the SP-1 pathway showed a marked reduction in activity at the 48 hour post-exposure time point, with all HYPs predicted decreased in abundance or activity.
Figure 8.
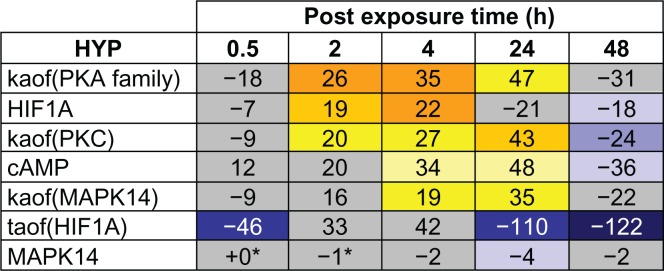
Temporal activation of SP-1 mediated MUC5AC production following acute CS exposure.
Notes: E-MTAB-874 in the SP-1 pathway of the Mucus Hypersecretion model. Seven of the SP-1 pathway nodes were predicted as a HYP in one more of the recovery time points. The heat map is color-coded according to the HYP concordance P-values, where yellow-orange shades indicate inferred increases in abundance or activity and blue shades indicate inferred decreases in abundance or activity. Lower P-values for concordance are indicated by darker shades. The numerical label indicates the number of State Changes supporting each prediction. Cells with an asterisk (*) indicate HYPs where the P-value for richness was not met, despite a passing P-value for concordance. A full description can be found in Supplemental File 3.
Figure 9.

Temporal activation of SP-1 mediated MUC5AC production following acute CS exposure.
Notes: HYPs and State Changes from the RCR analysis of E-MTAB-874 mapped to the SP-1 pathway of the Mucus Hypersecretion model. The model is color-coded according to the HYP concordance P-values, where yellow-orange shades indicate inferred increases in abundance or activity and blue shades indicate inferred decreases in abundance or activity. Lower P-values for concordance are indicated by darker shades. Gene expression State Changes are colored according to their observed change of increased (red) or decreased (green). Red lines indicate activated pathways while blue lines indicated pathways that are suppressed.
In contrast to the temporal activation of the general AP-1 and SP-1 pathways, the TNF pathway showed a pattern of temporal suppression across the post-exposure time points. Few TNF pathway HYPs were predicted between 0.5 and 4 hours. However, the abundance of the TNF receptor ligand TNFRSF1A, kinases that regulate NFkB transcriptional activity (IKBKB and CHUK), and the transcriptional activity of NFkB were all predicted to be decreased at 48 hours post-exposure, indicating a global suppression of NFkB mediated MUC5AC production (Figs. 10 and 11).
Figure 10.
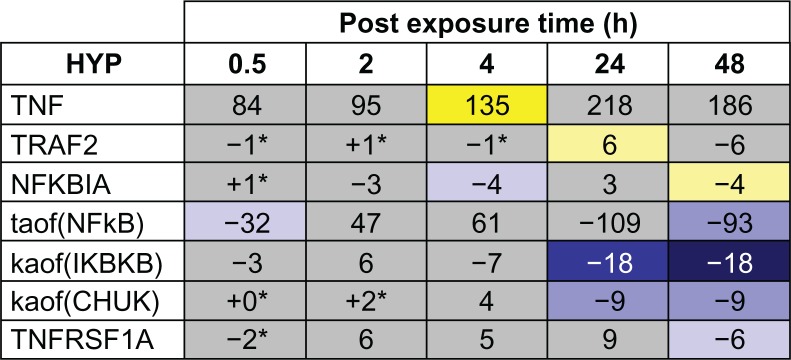
Temporal suppression of TNF mediated MUC5AC production following acute CS exposure.
Notes: The results of RCR analysis on E-MTAB-874 in the TNF pathway of the Mucus Hypersecretion model. Seven of the AP-1 pathway nodes were predicted as a HYP in one more of the recovery time points. The heat map is color-coded according to the HYP concordance P-values, where yellow-orange shades indicate inferred increases in abundance or activity and blue shades indicate inferred decreases in abundance or activity. Lower P-values for concordance are indicated by darker shades. The numerical label indicates the number of State Changes supporting each prediction. Cells with an asterisk (*) indicate HYPs where the P-value for richness was not met, despite a passing P-value for concordance. A full description can be found in Supplemental File 3.
Discussion
In this report, we describe the construction of a modular network model representing the inflammatory processes that are known to be involved in pulmonary responses to CS exposure. We focused on modeling lung-specific mechanisms, as CS directly induces inflammatory processes through pulmonary cells, with cells recruited from the circulation (eg, neutrophils, T-cells) acting as secondary mediators of the inflammatory responses. Following construction of the network from literature references and elements derived from the computational analysis of transcriptomic data, we evaluated the ability of portions of the network to describe some of the known inflammatory responses to CS in bronchial epithelial cells and macrophages, two cell types that are directly exposed to CS in the human lung.
CS effects in human alveolar macrophages
In response to environmental cues, macrophages can differentiate into M1 or M2 phenotypes, which correspond with either classical pro-inflammatory activity (large amounts of nitric oxide (NO) and pro-inflammatory cytokines involved in cytotoxicity, microbial killing, and regulation of cell proliferation; Th1 response (M1)), or with an alternate response (polyamine and proline biosynthesis, control of cell growth, collagen deposition, and tissue remodeling and repair (M2).50 In particular, transcriptomic data from alveolar macrophages suggested that smokers’ alveolar macrophages tend to favor an M2 phenotype, compared to macrophages from non-smokers that favor an M1 phenotype.49 Analysis of this data using the IPN macrophage activation sub-model supported these findings, with RCR-derived predictions for decreased activity of many key proteins involved in the macrophage inflammatory (M1) response. Although not explicitly included in the macrophage activation sub-model, RCR analysis of the data set also supported an increased M2 phenotype in smokers’ alveolar macrophages with HYPs for increased levels of key mediators of M2 polarization, TGFB1 and glucocorticoid receptor transcriptional activity.
CS-induced processes in human bronchial epithelial cells
We used three epithelial cell-focused IPN sub-models to evaluate unique aspects of two previously published transcriptomic data sets derived from bronchial epithelial cells exposed to CS. In the first data set, bronchial epithelial cells were isolated from smokers in vivo, and in the second, human bronchial epithelial cells were exposed to CS in vitro. For the in vivo data set, analysis of the epithelial barrier defense sub-model predicted that exposure to CS activates mechanisms that lead to decreased epithelial cell barrier function, as well as compensatory mechanisms to restore barrier function. This prediction is consistent with previous findings that CS increases epithelial cell permeability in human systems in vivo.68
Analysis of the epithelial cell pro-inflammatory signaling sub-model did not produce a robust and consistent signal for the in vivo data set. Although chronic exposure to CS can induce a pro-inflammatory phenotype in the airway,10,14,69 the presence of only tentative evidence for the activation of one pathway of pro-inflammatory signaling in GSE994 may in part be due to the limited number of State Changes (ie, only 150 genes meeting the statistical cutoffs for differential expression) in the bronchial epithelium of smokers and non-smokers, which can lead to the computational prediction of fewer numbers of upstream controllers by RCR.
Using the mucus hypersecretion sub-model, we found that CS exposure-activated pathways converge on mucus hypersecretion in bronchial epithelial cells through EGFR signaling. CS has been shown to induce EGFR-specific tyrosine phosphorylation in bronchial epithelial cell lines in vitro, and the concomitant up-regulation of MUC5AC at both the mRNA and protein level was blocked by EGFR kinase inhibitors.70,71 Interestingly, our analysis suggested that activation of mucus hypersecretion following CS challenge can occur through at least two distinct mechanisms, depending on the experimental context. In vitro, CS-induced generation of reactive oxygen species activates the cell surface enzyme ADAM17, whose sheddase activity results in the cleavage and release of the EGFR ligand, TGFA. TGFA, in turn, signals via EGFR and subsequently ERK kinases to increase the transcriptional activity of AP-1, a central regulator of MUC5AC expression. In addition, components of CS (notably the unsaturated aldehyde, acrolein) can also activate EGFR signaling, potentially via ADAM17 activation as well.72–74
The second mechanism for CS-induced mucus hypersecretion, identified following analysis of transcriptomic data from CS-exposed bronchial epithelial cells in vivo, involves the pro-inflammatory cytokine IL13. IL13 is a Th2 cytokine that has been most extensively studied in the lung in relation to its association with the development of asthma.75 In the bronchial epithelium, IL13 can signal through STAT6 to increase the expression of SPDEF, a transcription factor critical for goblet cell differentiation and for MUC5AC synthesis. IL13 can be released by Th2-polarized T-cells as well as mast cells, both of which are increased in number in the lungs of smokers relative to non-smokers.76–78 Here, our analysis of human bronchial epithelial cells exposed to chronic CS in vivo supports the emerging concept that the lung epithelium of chronic smokers may reflect a microenvironment populated with Th2-type cytokines, leading to goblet cell metaplasia and increased mucus production.62,79,80
Comparison with other inflammation networks
An optimal structure for a network model describing CS-induced inflammation covers a range of relevant cell types and processes, is modular in its organization, and can be flexibly applied to interpret systems biology-based data. Existing resources that capture aspects of the ideal network model for studying CS-related inflammation can be grouped into two general areas: signaling network databases and published inflammation models. Signaling network databases generally contain manually curated representations of canonical signaling pathways. The Kyoto Encyclopedia of Genes and Genomes (KEGG) Pathway database, Science’s Signal Transduction Knowledge Environment (STKE), and the UCSD Signaling Gateway are representative examples.
Whether part of a signaling network database, or published separately as part of a scientific study, models of biological networks can be constructed using different approaches depending on the specific aims of the researcher, the experimental contexts included, and the complexity/detail of the biology being modeled. Here, we highlight the salient features of previously published inflammation-related networks in comparison to the IPN model. Specifically, we discuss a data set-centered network constructed by Calvano et al, and three literature-centered models developed by Seok et al, Patil et al, and Oda et al.81–83 Models in signaling network databases are generally literature-centered, and thus share many characteristics with the models discussed below.
Calvano et al constructed a general inflammation network model using literature and gene expression data from blood leukocytes exposed to endotoxin in vivo.81 The model consists of differentially expressed genes from this data set that were connected into a network model by additional genes and interactions derived from literature. The network structure mimics a prototypical cell with no specific biological context defining which genes and interactions were included in the model. The Calvano et al network provided a structure for interpreting the potential effects of differentially expressed genes within the context of known interactions. The IPN model was similarly derived from a priori knowledge and transcriptomic data. However, in contrast to the Calvano et al network, the IPN was constructed using RCR and was thus able to treat gene expression changes as the result of network activation. We thus incorporated nodes representing the inferred sources of these expression changes into the IPN, rather than the genes being expressed. Additionally, the IPN further refined the approach used by Calvano et al by distinguishing between proteins, their activities, and their mRNA levels, as well as by organizing interactions into sub-models representing distinct cell-type specific processes.
Like Calvano et al, Seok et al analyzed the same transcriptomic profiling data set.83 In contrast to Calvano, Seok et al constructed an entirely literature-based model consisting of 10 inflammation-related transcription factors and 99 genes known to be regulated by these transcription factors.83 They then used a computational analysis to predict the activity of each transcription factor based on the leukocyte gene expression data, deriving temporal profiles of transcription factor activation in endotoxin-exposed leukocytes. Thus, the Seok et al network contains detailed content regarding the specific genes controlled by inflammation-relevant transcription factors, but lacks broad coverage on the upstream regulatory mechanisms such as the activities of receptors and kinases.
Patil et al constructed a comprehensive network model based solely on literature describing experiments related to dendritic cell response to pathogens.82 This model provides a more mechanistically-detailed description of dendritic cell signaling than the dendritic cell activation IPN sub-model. Similarly, Oda et al constructed a literature-based pathway model focused on Toll-like receptor (TLR) and IL1R signaling.84 Like the IPN model, a main structural feature of the Oda et al network is the representation of “inputs” and “outputs” for a biological process. In the case of Oda et al, network inputs and outputs are arranged in a bow-tie structure, reflecting the large number of “inputs” (ligands and receptors) and “outputs” (resulting gene expression changes) connected by a relatively small number of signaling components involved in TLR signaling. Both the Patil et al and Oda et al network models contain more mechanistic details in the corresponding processes than the IPN network (ie, the dendritic cell activation sub-model and the IPN sub-models that include TLR signaling). Despite its less-detailed representation of these particular inflammatory processes and pathways, the IPN model provides a unified framework and representation of cell type specific processes in pulmonary inflammation, and thus may serve as a more powerful resource for interpreting and analyzing cell-to-cell interactions and whole lung inflammation.
Thus, although the design and content features of the IPN model are shared with some previously published inflammation networks, we believe that its cell type-based structure and broad focus on multiple pathways modulated in the CS-exposed lung make the IPN model a unique resource for investigating pulmonary inflammation induced by not only CS, but other complex environmental exposures.
Conclusions
The IPN contains a diverse mechanistic representation of the main inflammatory pathways that are modulated in a selected group of pulmonary cells following exposure to CS. The content of the IPN reflects the pathways that operate in the main cell types responsible for both initiating and resolving pulmonary inflammatory responses. These pathways, uncovered by decades of basic research in the field of pulmonary biology, are represented here for the first time in a coherent, modular network model. As part of a broader effort to fully understand the integrated response to CS using modern systems analyses, the IPN and related network models describing other areas affected by CS (eg, cell proliferation, cellular stress) are being disseminated into the public domain as research tools to help propel the next generation of pulmonary research forward.
Acknowledgments
We would like to acknowledge Michael J. Maria for project management and support with preparation of this manuscript, Sam Ansari and Stefan Lebrun for reviewing the manuscript, and Lynda Conroy for editorial support.
Footnotes
Funding
The research described in this article was supported by Philip Morris International in a collaborative project with Selventa.
Author Contributions
Conceived and designed the experiments: RD, JH, MCP, JWW, WKS, DW. Analyzed the data: JWW, WKS, AH, SG, CM, TT, BW, VH, EV, MP, RBL, DW. Wrote the first draft of the manuscript: JWW, TT. Contributed to the writing of the manuscript: JWW, WKS, MT, RBL, SG, AH, EV, MP, CM, BW, VH. All authors agree with manuscript results and conclusions. Jointly developed the structure and arguments for the paper: JWW, WKS, SG, RBL, MP. All authors made critical revisions and approved final version. All authors reviewed and approved of the final manuscript.
Competing Interests
Author(s) disclose no potential conflicts of interest.
Disclosures and Ethics
As a requirement of publication the authors have provided signed confirmation of their compliance with ethical and legal obligations including but not limited to compliance with ICMJE authorship and competing interests guidelines, that the article is neither under consideration for publication nor published elsewhere, of their compliance with legal and ethical guidelines concerning human and animal research participants (if applicable), and that permission has been obtained for reproduction of any copyrighted material. This article was subject to blind, independent, expert peer review. The reviewers reported no competing interests.
Supplemental Data
The 24 IPN sub-models and agglomerated IPN network in .XGMML format. The individual sub-models and full IPN are supplied as a compressed file and be viewed using freely available network visualization software such as Cytoscape (http://www.cytoscape.org/).
List of RCR derived HYPs from each of the three data sets used to augment the IPN network that were considered for the IPN, but not included.
Basic description of the IPN model with the full list of nodes, edges and detailed references for each edge in the model.
Supplemental Figures for the Results section. HYPs and State Changes from analysis of the data sets discussed in the Results section are colored based on whether they support increased (yellow) or decreased (blue) macrophage activation. HYPs that support both increased and decreased macrophage activation are colored in gray. The directions of the HYPs themselves are annotated as colored halos around the nodes based on whether they are predicted increased (yellow halo) or decreased (blue halo). The measured direction of state changes are annotated as colored halos around the nodes based on whether they are increased (red halo) or decreased (green halo).
Supplemental Figures for the Results section. HYPs and State Changes from analysis of the data sets discussed in the Results section are colored based on whether they support increased (yellow) or decreased (blue) macrophage activation. HYPs that support both increased and decreased macrophage activation are colored in gray. The directions of the HYPs themselves are annotated as colored halos around the nodes based on whether they are predicted increased (yellow halo) or decreased (blue halo). The measured direction of state changes are annotated as colored halos around the nodes based on whether they are increased (red halo) or decreased (green halo).
Supplemental Figures for the Results section. HYPs and State Changes from analysis of the data sets discussed in the Results section are colored based on whether they support increased (yellow) or decreased (blue) macrophage activation. HYPs that support both increased and decreased macrophage activation are colored in gray. The directions of the HYPs themselves are annotated as colored halos around the nodes based on whether they are predicted increased (yellow halo) or decreased (blue halo). The measured direction of state changes are annotated as colored halos around the nodes based on whether they are increased (red halo) or decreased (green halo).
Supplemental Figures for the Results section.
Notes: HYPs and State Changes from analysis of the data sets discussed in the Results section are colored based on whether they support increased (yellow) or decreased (blue) macrophage activation. HYPs that support both increased and decreased macrophage activation are colored in gray. The directions of the HYPs themselves are annotated as colored halos around the nodes based on whether they are predicted increased (yellow halo) or decreased (blue halo). The measured direction of state changes are annotated as colored halos around the nodes based on whether they are increased (red halo) or decreased (green halo).
Data sets analyzed by RCR for augmentation of the Inflammatory Process Network.
Notes: Overview of the three data sets used to construct the Inflammatory Process Network including relevant experimental details.
References
- 1.Medzhitov R. Origin and physiological roles of inflammation. Nature. 2008;454:428–35. doi: 10.1038/nature07201. [DOI] [PubMed] [Google Scholar]
- 2.Smith CJ, Hansch C. The relative toxicity of compounds in mainstream cigarette smoke condensate. Food Chem Toxicol. 2000;38(7):637–46. doi: 10.1016/s0278-6915(00)00051-x. [DOI] [PubMed] [Google Scholar]
- 3.Smith CJ, Perfetti TA, Morton MJ, et al. The relative toxicity of substituted phenols reported in cigarette mainstream smoke. Toxicol Sci. 2002;69:265–78. doi: 10.1093/toxsci/69.1.265. [DOI] [PubMed] [Google Scholar]
- 4.Cantin AM. Cellular response to cigarette smoke and oxidants: adapting to survive. Proc Am Thorac Soc. 2010;7:368–75. doi: 10.1513/pats.201001-014AW. [DOI] [PubMed] [Google Scholar]
- 5.Barnes PJ. Immunology of asthma and chronic obstructive pulmonary disease. Nat Rev Immunol. 2008;8:183–92. doi: 10.1038/nri2254. [DOI] [PubMed] [Google Scholar]
- 6.Tuder RM, Yoshida T, Fijalkowka I, Biswai S, Petrache I. Role of lung maintenance program in the heterogeneity of lung destruction in emphysema. Proc Am Thorac Soc. 3:673–9. doi: 10.1513/pats.200605-124SF. [DOI] [PMC free article] [PubMed] [Google Scholar]
- 7.Sopori M. Effects of cigarette smoke on the immune system. Nat Rev Immunol. 2002;2:372–7. doi: 10.1038/nri803. [DOI] [PubMed] [Google Scholar]
- 8.Chung KF, Adcock IM. Multifaceted mechanisms in COPD: inflammation, immunity, and tissue repair and destruction. Eur Respir J. 2008;31:1334–56. doi: 10.1183/09031936.00018908. [DOI] [PubMed] [Google Scholar]
- 9.Taylor JD. COPD and the response of the lung to tobacco smoke exposure. Pulm Pharmacol Ther. 2010;23:376–83. doi: 10.1016/j.pupt.2010.04.003. [DOI] [PubMed] [Google Scholar]
- 10.Tetley TD. Inflammatory cells and chronic obstructive pulmonary disease. Curr Drug Targets Inflamm Allergy. 2005;4:607–18. doi: 10.2174/156801005774912824. [DOI] [PubMed] [Google Scholar]
- 11.Hanahan D, Weinberg RA. Hallmarks of cancer: the next generation. Cell. 2011;144:646–74. doi: 10.1016/j.cell.2011.02.013. [DOI] [PubMed] [Google Scholar]
- 12.Yang IA, Relan V, Wright CM, et al. Common pathogenic mechanisms and pathways in the development of COPD and lung cancer. Expert Opin Ther Targets. 2011;15:439–56. doi: 10.1517/14728222.2011.555400. [DOI] [PubMed] [Google Scholar]
- 13.Stampfli MR, Anderson GP. How cigarette smoke skews immune responses to promote infection, lung disease and cancer. Nat Rev Immunol. 2009;9:377–84. doi: 10.1038/nri2530. [DOI] [PubMed] [Google Scholar]
- 14.Thorley AJ, Tetley TD. Pulmonary epithelium, cigarette smoke, and chronic obstructive pulmonary disease. Int J Chron Obstruct Pulmon Dis. 2007;2:409–28. [PMC free article] [PubMed] [Google Scholar]
- 15.Barnes PJ, Shapiro SD, Pauwels RA. Chronic obstructive pulmonary disease: molecular and cellular mechanisms. Eur Respir J. 2003;22:672–88. doi: 10.1183/09031936.03.00040703. [DOI] [PubMed] [Google Scholar]
- 16.Yoshida T, Tuder RM. Pathobiology of cigarette smoke-induced chronic obstructive pulmonary disease. Physiol Rev. 2007;87:1047–82. doi: 10.1152/physrev.00048.2006. [DOI] [PubMed] [Google Scholar]
- 17.Morbini P, Villa C, Campo I, Zorzetto M, Inghilleri S, Luisetti M. The receptor for advanced glycation end products and its ligands: a new inflammatory pathway in lung disease? Mod Pathol. 2006;19:1437–45. doi: 10.1038/modpathol.3800661. [DOI] [PubMed] [Google Scholar]
- 18.Reynolds PR, Kasteler SD, Schmitt RE, Hoidal JR. RAGE Signals through Ras during Tobacco Smoke-Induced Pulmonary Inflammation. Am J Respir Cell Mol Biol. 2011;45:411–8. doi: 10.1165/rcmb.2010-0231OC. [DOI] [PubMed] [Google Scholar]
- 19.Chen GY, Nunez G. Sterile inflammation: sensing and reacting to damage. Nat Rev Immunol. 2010;10:826–37. doi: 10.1038/nri2873. [DOI] [PMC free article] [PubMed] [Google Scholar]
- 20.Hodge S, Hodge G, Ahem J, Jersmann H, Holmes M, Reynolds PN. Smoking alters alveolar macrophage recognition and phagocytic ability: implications in chronic obstructive pulmonary disease. Am J Respir Cell Mol Biol. 2007;37:748–55. doi: 10.1165/rcmb.2007-0025OC. [DOI] [PubMed] [Google Scholar]
- 21.King TE, Jr, Savici D, Campbell PA. Phagocytosis and killing of Listeria monocytogenes by alveolar macrophages: smokers versus nonsmokers. J Infect Dis. 1988;158:1309–16. doi: 10.1093/infdis/158.6.1309. [DOI] [PubMed] [Google Scholar]
- 22.Mucida D, Cheroutre H. The many face-lifts of CD4 T helper cells. Adv Immunol. 2010;107:139–52. doi: 10.1016/B978-0-12-381300-8.00005-8. [DOI] [PubMed] [Google Scholar]
- 23.Curtis JL, Freeman CM, Hogg JC. The immunopathogenesis of chronic obstructive pulmonary disease: insights from recent research. Proc Am Thorac Soc. 2007;4:512–21. doi: 10.1513/pats.200701-002FM. [DOI] [PMC free article] [PubMed] [Google Scholar]
- 24.Woodruff PG, Koth LL, Yang YH, et al. A distinctive alveolar macrophage activation state induced by cigarette smoking. Am J Respir Crit Care Med. 2005;172:1383–92. doi: 10.1164/rccm.200505-686OC. [DOI] [PMC free article] [PubMed] [Google Scholar]
- 25.Rogers DF. Physiology of airway mucus secretion and pathophysiology of hypersecretion. Respir Care. 2007;52:1134–46. discussion 1146–9. [PubMed] [Google Scholar]
- 26.Barnes PJ. Mediators of chronic obstructive pulmonary disease. Pharmacol Rev. 2004;56:515–48. doi: 10.1124/pr.56.4.2. [DOI] [PubMed] [Google Scholar]
- 27.Barnes PJ. The cytokine network in asthma and chronic obstructive pulmonary disease. J Clin Invest. 2008;118:3546–56. doi: 10.1172/JCI36130. [DOI] [PMC free article] [PubMed] [Google Scholar]
- 28.Murugan V, Peck MJ. Signal transduction pathways linking the activation of alveolar macrophages with the recruitment of neutrophils to lungs in chronic obstructive pulmonary disease. Exp Lung Res. 2009;35:439–85. doi: 10.1080/01902140902759290. [DOI] [PubMed] [Google Scholar]
- 29.de Boer WI, Sont JK, van Schadewijk A, Stolk J, van Krieken JH, Hiemstra PS. Monocyte chemoattractant protein 1, interleukin 8, and chronic airways inflammation in COPD. J Pathol. 2000;190:619–26. doi: 10.1002/(SICI)1096-9896(200004)190:5<619::AID-PATH555>3.0.CO;2-6. [DOI] [PubMed] [Google Scholar]
- 30.Russell RE, Thorley A, Culpitt SV, et al. Alveolar macrophage-mediated elastolysis: roles of matrix metalloproteinases, cysteine, and serine proteases. Am J Physiol Lung Cell Mol Physiol. 2002;283:L867–73. doi: 10.1152/ajplung.00020.2002. [DOI] [PubMed] [Google Scholar]
- 31.Mio T, Romberger DJ, Thompson AB, Robbins RA, Heires A, Rennart SI. Cigarette smoke induces interleukin-8 release from human bronchial epithelial cells. Am J Respir Crit Care Med. 1997;155:1770–6. doi: 10.1164/ajrccm.155.5.9154890. [DOI] [PubMed] [Google Scholar]
- 32.Parsanejad R, Fields WR, Morgan WT, Bombick BR, Doolittle DJ. The time course of expression of genes involved in specific pathways in normal human bronchial epithelial cells following exposure to cigarette smoke. Exp Lung Res. 2008;34:513–30. doi: 10.1080/01902140802271826. [DOI] [PubMed] [Google Scholar]
- 33.Stevenson CS, Docx C, Webster R, et al. Comprehensive gene expression profiling of rat lung reveals distinct acute and chronic responses to cigarette smoke inhalation. Am J Physiol Lung Cell Mol Physiol. 2007;293:L1183–93. doi: 10.1152/ajplung.00105.2007. [DOI] [PubMed] [Google Scholar]
- 34.Steiling K, Kadar AY, Bergerat A, et al. Comparison of proteomic and transcriptomic profiles in the bronchial airway epithelium of current and never smokers. PLoS One. 2009;4:e5043. doi: 10.1371/journal.pone.0005043. [DOI] [PMC free article] [PubMed] [Google Scholar]
- 35.Veljkovic E, Jiricny J, Menigatti M, Rehrauer H, Han W. Chronic exposure to cigarette smoke condensate in vitro induces epithelial to mesenchymal transition-like changes in human bronchial epithelial cells, BEAS-2B. Toxicol In Vitro. 2011;25:446–53. doi: 10.1016/j.tiv.2010.11.011. [DOI] [PubMed] [Google Scholar]
- 36.Heguy A, O’Connor TP, Luettich K, et al. Gene expression profiling of human alveolar macrophages of phenotypically normal smokers and non-smokers reveals a previously unrecognized subset of genes modulated by cigarette smoking. J Mol Med. 2006;84:318–28. doi: 10.1007/s00109-005-0008-2. [DOI] [PubMed] [Google Scholar]
- 37.Adair-Kirk TL, Atkinson JJ, Griffin GL, et al. Distal airways in mice exposed to cigarette smoke: Nrf2-regulated genes are increased in Clara cells. Am J Respir Cell Mol Biol. 2006;39:400–11. doi: 10.1165/rcmb.2007-0295OC. [DOI] [PMC free article] [PubMed] [Google Scholar]
- 38.Westra JW, Schiage WK, Frushour BP, et al. Construction of a computable cell proliferation network focused on non-diseased lung cells. BMC Syst Biol. 2011;5:105. doi: 10.1186/1752-0509-5-105. [DOI] [PMC free article] [PubMed] [Google Scholar]
- 39.Schlage WK, Westra JW, Gebel S, et al. A computable cellular stress network model for non-diseased pulmonary and cardiovascular tissue. BMC Syst Biol. 2011;5:168. doi: 10.1186/1752-0509-5-168. [DOI] [PMC free article] [PubMed] [Google Scholar]
- 40.Valenca SS, Silva Benzerra F, Lopes AA, et al. Oxidative stress in mouse plasma and lungs induced by cigarette smoke and lipopolysaccharide. Environ Res. 2008;108:199–204. doi: 10.1016/j.envres.2008.07.001. [DOI] [PubMed] [Google Scholar]
- 41.Mortaz E, Henricks PA, Kraneveid AD, Givi ME, Garssen J, Folkerts G. Cigarette smoke induces the release of CXCL-8 from human bronchial epithelial cells via TLRs and induction of the inflammasome. Biochim Biophys Acta. 2011;1812:1104–10. doi: 10.1016/j.bbadis.2011.06.002. [DOI] [PubMed] [Google Scholar]
- 42.Doz E, Noulin N, Boichot E, et al. Cigarette smoke-induced pulmonary inflammation is TLR4/MyD88 and IL-1R1/MyD88 signaling dependent. J Immunol. 2008;180:1169–78. doi: 10.4049/jimmunol.180.2.1169. [DOI] [PubMed] [Google Scholar]
- 43.Gebel S, Diehl S, Pype J, et al. The transcriptome of Nrf2−/− mice provides evidence for impaired cell cycle progression in the development of cigarette smoke-induced emphysematous changes. Toxicol Sci. 2010;115:238–52. doi: 10.1093/toxsci/kfq039. [DOI] [PubMed] [Google Scholar]
- 44.Doyle I, Ratcliffe M, Walding A, et al. Differential gene expression analysis in human monocyte-derived macrophages: impact of cigarette smoke on host defence. Mol Immunol. 2010;47:1058–65. doi: 10.1016/j.molimm.2009.11.008. [DOI] [PubMed] [Google Scholar]
- 45.Jeffery PK, Ayers M, Rogers D. The mechanisms and control of bronchial mucous cell hyperplasia. Adv Exp Med Biol. 1982;144:399–409. doi: 10.1007/978-1-4615-9254-9_62. [DOI] [PubMed] [Google Scholar]
- 46.Borchers MT, Wert SE, Leikauf GD. Acrolein-induced MUC5ac expression in rat airways. Am J Physiol. 1998;274:L573–81. doi: 10.1152/ajplung.1998.274.4.L573. [DOI] [PubMed] [Google Scholar]
- 47.Choi WI, Syrkina O, Kwon KY, Quinn DA, Hales CA. JNK activation is responsible for mucus overproduction in smoke inhalation injury. Respir Res. 2010;11:172. doi: 10.1186/1465-9921-11-172. [DOI] [PMC free article] [PubMed] [Google Scholar]
- 48.Richardson PS, Peatfield AC. The control of airway mucus secretion. Eur J Respir Dis Suppl. 1987;153:43–51. [PubMed] [Google Scholar]
- 49.Shaykhiev R, Krause A, Salit J, et al. Smoking-dependent reprogramming of alveolar macrophage polarization: implication for pathogenesis of chronic obstructive pulmonary disease. J Immunol. 2009;183:2867–83. doi: 10.4049/jimmunol.0900473. [DOI] [PMC free article] [PubMed] [Google Scholar]
- 50.Mantovani A, Sica A, Sozzani S, Allavena P, Vecchi A, Locati M. The chemokine system in diverse forms of macrophage activation and polarization. Trends Immunol. 2004;25:677–86. doi: 10.1016/j.it.2004.09.015. [DOI] [PubMed] [Google Scholar]
- 51.Martinez FO, Sica A, Mantovani A, Locati M. Macrophage activation and polarization. Front Biosci. 2008;13:453–61. doi: 10.2741/2692. [DOI] [PubMed] [Google Scholar]
- 52.Neve BP, Fruchart JC, Staels B. Role of the peroxisome proliferator-activated receptors (PPAR) in atherosclerosis. Biochem Pharmacol. 2000;60:1245–50. doi: 10.1016/s0006-2952(00)00430-5. [DOI] [PubMed] [Google Scholar]
- 53.Ikezumi Y, et al. Contrasting effects of steroids and mizoribine on macrophage activation and glomerular lesions in rat thy-1 mesangial proliferative glomerulonephritis. Am J Nephrol. 2010;31:273–82. doi: 10.1159/000279163. [DOI] [PubMed] [Google Scholar]
- 54.Bellon T, Martinez V, Lucendo B, et al. Alternative activation of macrophages in human peritoneum: implications for peritoneal fibrosis. Nephrol Dial Transplant. 2011;26:2995–3005. doi: 10.1093/ndt/gfq771. [DOI] [PubMed] [Google Scholar]
- 55.Spira A, Beane J, Shah V, et al. Effects of cigarette smoke on the human airway epithelial cell transcriptome. Proc Natl Acad Sci U S A. 2004;101:10143–8. doi: 10.1073/pnas.0401422101. [DOI] [PMC free article] [PubMed] [Google Scholar]
- 56.Finigan JH, Faress JA, Wilkinson E, et al. Neuregulin-1-human epidermal receptor-2 signaling is a central regulator of pulmonary epithelial permeability and acute lung injury. J Biol Chem. 2011;286:10660–70. doi: 10.1074/jbc.M110.208041. [DOI] [PMC free article] [PubMed] [Google Scholar]
- 57.Basuroy S, Sheth P, Kuppuswamy D, et al. Expression of kinase-inactive c-Src delays oxidative stress-induced disassembly and accelerates calcium-mediated reassembly of tight junctions in the Caco-2 cell monolayer. J Biol Chem. 2003;278:11916–24. doi: 10.1074/jbc.M211710200. [DOI] [PubMed] [Google Scholar]
- 58.Shao MX, Nadel JA. Neutrophil elastase induces MUC5AC mucin production in human airway epithelial cells via a cascade involving protein kinase C, reactive oxygen species, and TNF-alpha-converting enzyme. J Immunol. 2005;175:4009–16. doi: 10.4049/jimmunol.175.6.4009. [DOI] [PubMed] [Google Scholar]
- 59.Gensch E, Gallup M, Sucher A, et al. Tobacco smoke control of mucin production in lung cells requires oxygen radicals AP-1 and JNK. J Biol Chem. 2004;279:39085–93. doi: 10.1074/jbc.M406866200. [DOI] [PubMed] [Google Scholar]
- 60.Fujisawa T, Ide K, Holzman MJ, et al. Involvement of the p38 MAPK pathway in IL-13-induced mucous cell metaplasia in mouse tracheal epithelial cells. Respirology. 2008;13:191–202. doi: 10.1111/j.1440-1843.2008.01237.x. [DOI] [PubMed] [Google Scholar]
- 61.Rencken RK, Jansen AA, Bornman MS, Reif S. Trauma of the ureter. S Afr J Surg. 1991;29:154–7. [PubMed] [Google Scholar]
- 62.Yu H, Li Q, Kolosov VP, Pereiman JM, Zhou X. Interleukin-13 induces mucin 5AC production involving STAT6/SPDEF in human airway epithelial cells. Cell Commun Adhes. 2010;17:83–92. doi: 10.3109/15419061.2010.551682. [DOI] [PubMed] [Google Scholar]
- 63.Chen G, Korfhagen TR, Xu Y, et al. SPDEF is required for mouse pulmonary goblet cell differentiation and regulates a network of genes associated with mucus production. J Clin Invest. 2009;119:2914–24. doi: 10.1172/JCI39731. [DOI] [PMC free article] [PubMed] [Google Scholar]
- 64.Maunders H, Patwardhan S, Phillips J, Clack A, Richter A. Human bronchial epithelial cell transcriptome: gene expression changes following acute exposure to whole cigarette smoke in vitro. Am J Physiol Lung Cell Mol Physiol. 2007;292:L1248–56. doi: 10.1152/ajplung.00290.2006. [DOI] [PubMed] [Google Scholar]
- 65.Samet JM, Cheng PW. The role of airway mucus in pulmonary toxicology. Environ Health Perspect. 1994;102(Suppl 2):89–103. doi: 10.1289/ehp.9410289. [DOI] [PMC free article] [PubMed] [Google Scholar]
- 66.Mebratu YA, Schwaim K, Smith KR, Schuyler M, Tesfaigzi Y. Cigarette smoke suppresses Bik to cause epithelial cell hyperplasia and mucous cell metaplasia. Am J Respir Crit Care Med. 2011;183:1531–8. doi: 10.1164/rccm.201011-1930OC. [DOI] [PMC free article] [PubMed] [Google Scholar]
- 67.Almolki A, Guenogou A, Golda S, et al. Heme oxygenase-1 prevents airway mucus hypersecretion induced by cigarette smoke in rodents and humans. Am J Pathol. 2008;173:981–92. doi: 10.2353/ajpath.2008.070863. [DOI] [PMC free article] [PubMed] [Google Scholar]
- 68.Shaykhiev R, Otaki F, Bonsu P, et al. Cigarette smoking reprograms apical junctional complex molecular architecture in the human airway epithelium in vivo. Cell Mol Life Sci. 2011;68:877–92. doi: 10.1007/s00018-010-0500-x. [DOI] [PMC free article] [PubMed] [Google Scholar]
- 69.Dwyer TM. Cigarette smoke-induced airway inflammation as sampled by the expired breath condensate. Am J Med Sci. 2003;326:174–8. doi: 10.1097/00000441-200310000-00004. [DOI] [PubMed] [Google Scholar]
- 70.Takeyama K, et al. Activation of epidermal growth factor receptors is responsible for mucin synthesis induced by cigarette smoke. Am J Physiol Lung Cell Mol Physiol. 2001;280:L165–72. doi: 10.1152/ajplung.2001.280.1.L165. [DOI] [PubMed] [Google Scholar]
- 71.Shao MX, Nakanaga T, Nadel JA. Cigarette smoke induces MUC5AC mucin overproduction via tumor necrosis factor-alpha-converting enzyme in human airway epithelial (NCI-H292) cells. Am J Physiol Lung Cell Mol Physiol. 2004;287:L420–7. doi: 10.1152/ajplung.00019.2004. [DOI] [PubMed] [Google Scholar]
- 72.Borchers MT, Carty MP, Leikauf GD. Regulation of human airway mucins by acrolein and inflammatory mediators. Am J Physiol. 1999;276:L549–55. doi: 10.1152/ajplung.1999.276.4.L549. [DOI] [PubMed] [Google Scholar]
- 73.Borchers MT, Wesselkamper S, Wert SE, Shapiro SD, Leikauf GD. Monocyte inflammation augments acrolein-induced Muc5ac expression in mouse lung. Am J Physiol. 1999;277:L489–97. doi: 10.1152/ajplung.1999.277.3.L489. [DOI] [PubMed] [Google Scholar]
- 74.Deshmukh HS, Case LM, Wesselkamper SC, et al. Metalloproteinases mediate mucin 5AC expression by epidermal growth factor receptor activation. Am J Respir Crit Care Med. 2005;171:305–14. doi: 10.1164/rccm.200408-1003OC. [DOI] [PubMed] [Google Scholar]
- 75.Lloyd CM, Hessel EM. Functions of T cells in asthma: more than just T(H)2 cells. Nat Rev Immunol. 2010;10:838–48. doi: 10.1038/nri2870. [DOI] [PMC free article] [PubMed] [Google Scholar]
- 76.Sahlander K, Larsson K, Palmberg L. Altered innate immune response in farmers and smokers. Innate Immun. 2010;16:27–38. doi: 10.1177/1753425909106317. [DOI] [PubMed] [Google Scholar]
- 77.Lamb D, Lumsden A. Intra-epithelial mast cells in human airway epithelium: evidence for smoking-induced changes in their frequency. Thorax. 1982;37:334–42. doi: 10.1136/thx.37.5.334. [DOI] [PMC free article] [PubMed] [Google Scholar]
- 78.Battaglia S, Mauad T, van Schadewijk AM, et al. Differential distribution of inflammatory cells in large and small airways in smokers. J Clin Pathol. 2007;60:907–11. doi: 10.1136/jcp.2006.037002. [DOI] [PMC free article] [PubMed] [Google Scholar]
- 79.Cohn L. Mucus in chronic airway diseases: sorting out the sticky details. J Clin Invest. 2006;116:306–8. doi: 10.1172/JCI27690. [DOI] [PMC free article] [PubMed] [Google Scholar]
- 80.Haswell LE, Hewitt K, Thorne D, Richter A, Gaca MD. Cigarette smoke total particulate matter increases mucous secreting cell numbers in vitro: a potential model of goblet cell hyperplasia. Toxicol In Vitro. 2010;24:981–7. doi: 10.1016/j.tiv.2009.12.019. [DOI] [PubMed] [Google Scholar]
- 81.Calvano SE, Xiao W, Richards DR, et al. A network-based analysis of systemic inflammation in humans. Nature. 2005;437:1032–7. doi: 10.1038/nature03985. [DOI] [PubMed] [Google Scholar]
- 82.Patil S, Pincas H, Seto J, Nudelman G, Nudelman I, Sealfon SC. Signaling network of dendritic cells in response to pathogens: a community-input supported knowledgebase. BMC Syst Biol. 2010;4:137. doi: 10.1186/1752-0509-4-137. [DOI] [PMC free article] [PubMed] [Google Scholar]
- 83.Seok J, Xiao W, Moldawer LL, Davis RW, Covert MW. A dynamic network of transcription in LPS-treated human subjects. BMC Syst Biol. 2009;3:78. doi: 10.1186/1752-0509-3-78. [DOI] [PMC free article] [PubMed] [Google Scholar]
- 84.Oda K, Kitano H. A comprehensive map of the toll-like receptor signaling network. Mol Syst Biol. 2006;2:2006 0015. doi: 10.1038/msb4100057. [DOI] [PMC free article] [PubMed] [Google Scholar]
- 85.Antila L. Insurance cases of cerebral concussion. Duodecim. 1957;73:320–8. [PubMed] [Google Scholar]
- 86.Irizarry RA, Hobbs B, Collin F, et al. Exploration, normalization, and summaries of high density oligonucleotide array probe level data. Biostatistics. 2003;4:249–64. doi: 10.1093/biostatistics/4.2.249. [DOI] [PubMed] [Google Scholar]
- 87.Rauramo L, Lagerspetz K, Engblom P, Punnonen R. The effect of castration and peroral estrogen therapy on some psychological functions. Front Horm Res. 1975;3:94–104. doi: 10.1159/000398269. [DOI] [PubMed] [Google Scholar]
- 88.Carpentier J, Luyckx AS, Lefebvre PJ. Influence of metformin on arginine-induced glucagon secretion in human diabetes. Diabete Metab. 1975;1:23–8. [PubMed] [Google Scholar]
- 89.Smyth GK. Linear models and empirical bayes methods for assessing differential expression in microarray experiments. Stat Appl Genet Mol Biol. 2004;3 doi: 10.2202/1544-6115.1027. Article3. [DOI] [PubMed] [Google Scholar]
Associated Data
This section collects any data citations, data availability statements, or supplementary materials included in this article.
Supplementary Materials
The 24 IPN sub-models and agglomerated IPN network in .XGMML format. The individual sub-models and full IPN are supplied as a compressed file and be viewed using freely available network visualization software such as Cytoscape (http://www.cytoscape.org/).
List of RCR derived HYPs from each of the three data sets used to augment the IPN network that were considered for the IPN, but not included.
Basic description of the IPN model with the full list of nodes, edges and detailed references for each edge in the model.
Supplemental Figures for the Results section. HYPs and State Changes from analysis of the data sets discussed in the Results section are colored based on whether they support increased (yellow) or decreased (blue) macrophage activation. HYPs that support both increased and decreased macrophage activation are colored in gray. The directions of the HYPs themselves are annotated as colored halos around the nodes based on whether they are predicted increased (yellow halo) or decreased (blue halo). The measured direction of state changes are annotated as colored halos around the nodes based on whether they are increased (red halo) or decreased (green halo).
Supplemental Figures for the Results section. HYPs and State Changes from analysis of the data sets discussed in the Results section are colored based on whether they support increased (yellow) or decreased (blue) macrophage activation. HYPs that support both increased and decreased macrophage activation are colored in gray. The directions of the HYPs themselves are annotated as colored halos around the nodes based on whether they are predicted increased (yellow halo) or decreased (blue halo). The measured direction of state changes are annotated as colored halos around the nodes based on whether they are increased (red halo) or decreased (green halo).
Supplemental Figures for the Results section. HYPs and State Changes from analysis of the data sets discussed in the Results section are colored based on whether they support increased (yellow) or decreased (blue) macrophage activation. HYPs that support both increased and decreased macrophage activation are colored in gray. The directions of the HYPs themselves are annotated as colored halos around the nodes based on whether they are predicted increased (yellow halo) or decreased (blue halo). The measured direction of state changes are annotated as colored halos around the nodes based on whether they are increased (red halo) or decreased (green halo).
Supplemental Figures for the Results section.
Notes: HYPs and State Changes from analysis of the data sets discussed in the Results section are colored based on whether they support increased (yellow) or decreased (blue) macrophage activation. HYPs that support both increased and decreased macrophage activation are colored in gray. The directions of the HYPs themselves are annotated as colored halos around the nodes based on whether they are predicted increased (yellow halo) or decreased (blue halo). The measured direction of state changes are annotated as colored halos around the nodes based on whether they are increased (red halo) or decreased (green halo).
Data sets analyzed by RCR for augmentation of the Inflammatory Process Network.
Notes: Overview of the three data sets used to construct the Inflammatory Process Network including relevant experimental details.