

Abstract
We identified CD8+ CD122+ regulatory T cells (CD8+ CD122+ Treg cells) and reported their importance in maintaining immune homeostasis. The absence of CD8+ CD122+ Treg cells has been shown to lead to severe systemic autoimmunity in several mouse models, including inflammatory bowel diseases and experimental autoimmune encephalomyelitis. The T-cell receptors (TCRs) expressed on CD8+ CD122+ Treg cells recognize the target cells to be regulated. To aid in the identification of the target antigen(s) recognized by TCRs of CD8+ CD122+ Treg cells, we compared the TCR diversity of CD8+ CD122+ T cells with that of conventional, naive T cells in mice. We analysed the use of TCR-Vβ in the interleukin 10-producing population of CD8+ CD122+ T cells marked by high levels of CD49d expression, and found the significantly increased use of Vβ13 in these cells. Immunoscope analysis of the complementarity-determining region 3 (CDR3) of the TCR β-chain revealed remarkable skewing in a pair of Vβ regions, suggesting the existence of clonally expanded cells in CD8+ CD122+ T cells. Clonal expansion in Vβ13+ cells was confirmed by determining the DNA sequences of the CDR3s. The characteristic TCR found in this study is an important building block for further studies to identify the target antigen recognized by CD8+ CD122+ Treg cells.
Keywords: CD8+, diversity, regulatory T cells, T-cell receptor
Introduction
Regulatory T (Treg) cells have been intensively studied in the field of immunology. They have been shown to be an important T-cell subset for maintaining immune homeostasis.1,2 Of these, the most extensively studied Treg cells are CD4+ CD25+ Foxp3+ Treg cells.3 Their important function is shown by the phenotype of Foxp3-deficient mice, which have severe systemic autoimmune diseases.4,5 Interleukin-10 (IL-10), transforming growth factor-β, cytotoxic T-lymphocyte antigen 4 and glucocorticoid-induced tumour necrosis factor-receptor are reported to be key effector molecules for CD4+ CD25+ Foxp3+ Treg cells.6 Clinical trials based on CD4+ CD25+ Foxp3+ Treg cell studies are underway.7 Other Treg cells, including type 1 (Tr1) cells, CD8αα TCR-αβ Treg cells and CD8+ CD122+ Treg cells have been reported.8–10
Our study group has identified CD8+ CD122+ Treg cells in mice and reported their role in multiple disease models, including experimental autoimmune encephalomyelitis and inflammatory bowel diseases.11,12 Another group has identified their potential contribution to autoimmune thyroiditis.13 In the absence of CD8+ CD122+ Treg cells, activation of autoreactive T cells in these models became aggressive, suggesting their importance in maintaining immune homeostasis. It was also proposed that CD8+ CD122+ Treg cells in association with CD4+ CD25+ Foxp3+ Treg cells suppress autoreactive T cells.12 Interleukin-10 is an important effector molecule for CD8+ CD122+ Treg cells to suppress the activation of conventional T cells in vitro.14 We have also reported that human peripheral blood does not contain CD8+ CD122+ cells; however, the functional human counterpart of murine CD8+ CD122+ Treg cells can be marked with CD8+ CXCR3+ cells.15
Recently, Dai et al.16 reported that programmed death 1 (PD-1) expression discriminates CD8+ CD122+ Treg cells from CD8+ memory T cells. Because CD122 has historically been used as a marker for mouse CD8+ memory T cells,17 CD8+ CD122+ cells possibly consist of memory T cells and Treg cells, although the number of memory T cells seems to be higher than the number of Treg cells. In the above-mentioned study, the authors showed that CD8+ CD122+ PD-1+ cells mainly produced IL-10 in the CD8+ population in vitro, and that they possessed in vivo regulatory activity to suppress T cells activated by an MHC-mismatched skin graft. PD-1 marks CD8+ Treg cells more specifically in combination with CD122 and may enable a much more detailed study of CD8+ CD122+ Treg cells.
Determining the target antigen of the T-cell receptor (TCR) in a T-cell population is of vital importance for directly understanding their function to a specific antigen.18,19 Indeed, many studies identifying the target antigens of cytotoxic T lymphocytes have been reported.20 In contrast, only a few studies identifying the target antigens of CD4+ CD25+ Foxp3+ Treg cells have been reported. Nonetheless, information of the target antigen recognized by CD4+ CD25+ Foxp3+ Treg cells has revealed that stimulation is important for their suppressive activity against naive T cells.21,22
Before identifying the target antigen recognized by CD8+ CD122+ Treg cells, we studied the TCR diversity of CD8+ CD122+ T cells. We followed a conventional approach for analysing the T-cell response to non-self antigens. Flow cytometric analysis with antibodies specific for each Vβ region, immunoscope analysis, and determination of the DNA sequence around complementarity-determining region 3 (CDR3) of the TCR-β gene revealed a skewed use of TCRs in CD8+ CD122+ T cells. This skewing of TCR diversity in CD8+ CD122+ T cells is possibly generated by the clonal expansion of Treg cells or memory T cells responding to the target T cells rather than by the skewed formation of TCRs during T-cell differentiation.
Materials and methods
Mice
C57BL/6J female mice (6–8 weeks old, unless specified) were purchased from Japan SLC (Hamamatsu, Japan). All mice used in this study were maintained in a specific pathogen-free environment. Animal care was performed according to the guidelines of Nagoya University (Nagoya, Japan). Experimental protocols were approved by the Ethics Committee of the Nagoya University Graduate School of Medicine (No. 22310 and 23024).
Flow cytometry
Phycoerythrin (PE)/indotricarbocyanine (Cy7)-conjugated anti-mouse CD8a (clone 53-6·7), biotin-conjugated anti-mouse CD122 (clone 5H4), PE-conjugated anti-mouse PD-1 (clone 29F.1A12), PE-conjugated anti-mouse TCR Vβ13 (clone MR12-4), and allophycocyanin-conjugated streptavidin were purchased from BioLegend (San Diego, CA). The PE-conjugated anti-mouse CD49d (clone 9C10) and mouse Vβ TCR Screening Panel (Cat. No 557004) were purchased from BD Biosciences (San Jose, CA). Cells (1 × 10⁶) were stained with each antibody on ice for 20 min, and were then analysed using the FACSCantoII flow cytometer (BD Biosciences). For secondary staining of biotin-conjugated antibodies, cells were centrifuged at 600 g for 3 min, and the cell pellet was suspended in staining buffer with fluorochrome-conjugated streptavidin.
In vitro IL-10 production assay
Cell culture plates (96 wells per plate) were coated with 10 μg/ml anti-CD3 (clone 13C11; eBioscience, San Diego, CA) in PBS. Plates were washed with culture media; then, 1 × 10⁵ cells were cultured in 200 µl RPMI-1640 medium (Sigma, St Louis, MO) supplemented with 50 U/ml penicillin, 50 μg/ml streptomycin (Invitrogen, Carlsbad, CA), 50 μm 2-mercaptoethanol (Invitrogen) and 10 ng/ml recombinant human IL-2 (Peprotech, Rocky Hill, NJ) for 48 hr. Culture supernatants were harvested, and the IL-10 concentration was measured using the mouse IL-10 Quantikine ELISA kit (R&D Systems, Minneapolis, MN) according to the manufacturer's instructions.
Reverse transcription-polymerase chain reaction
CD8+ CD122−, CD8+ CD122+ CD49dlow and CD8+ CD122+CD49dhigh cells from either the spleens or lymph nodes were sorted using the FACSAriaII cell sorter (BD Biosciences). For RNA extraction and immunoscope analysis, we collected 106 cells of all three populations. RNA was isolated using the RNeasy Micro Kit (Qiagen, Valencia, CA). The cDNA was synthesized with SuperScript III reverse transcriptase (Invitrogen) using random hexamer primers and was synthesized from the same amount of RNA of all three populations, suspended in the same amount (e.g. 20 µl) of double-distilled H2O, and kept at – 20°.
Immunoscope analysis
Amplification of the CDR3 DNA region of each Vβ was performed by pairing each Vβ-specific primer with a Cβ-specific primer labelled with 5-carboxyfluorescein (FAM) at the 5′ end.23 The sequence of each primer is listed in Table 1. For the further analysis of Vβ13–Jβ amplification, a Vβ13-specific primer was labelled with FAM and the sequence of each Jβ primer is listed in the Supplementary material, Table S1. For the analysis of Vα–Cα amplification, Cα-specific primer was labelled with FAM and the sequence of each Vα primer is listed in the Supplementary material, Table S2. First, 106 cells were prepared from each cell population (CD8+ CD122−, CD8+ CD122+ CD49dlow and CD8+ CD122+ CD49dhigh). Mice used to prepare the cells were identical for each cell population and the area of collecting cells in the cell sorter was finely adjusted so that the sorting time to obtain 106 cells should be approximately equal for each cell population. After cell sorting, cell number was counted and the same number (usually 106) of cells from three populations was used for the extraction of RNA. The cDNA was synthesized, suspended in the same amount (e.g. 20 μl) of double-distilled H2O, and kept at −20°. The same amount of cDNA solution (e.g. 1 μl) was transferred into PCR mixture and the PCR was performed. PrimeSTAR GXL DNA polymerase (TaKaRa BIO Inc., Otsu, Japan) and the GeneAmp PCR System 2700 thermal cycler (Applied Biosystems, Foster City, CA) were used with the following temperature conditions: 98° for 10 seconds; 60° for 15 seconds; 68° for 20 seconds; for 30 cycles. The same amount of cDNA solution (e.g. 1 μl) was transferred into PCR mixture and the PCR was performed. Each PCR product was purified using capillary electrophoresis with an ABI 310 Genetic Analyzer (Applied Biosystems), according to the manufacturer's instructions. Results were analysed using the GeneMapper software (Applied Biosystems). In figures showing the results of the immunoscope analysis, the amplitude of each line was adjusted so that the highest peak in a single line reached near the top.
Table 1.
Primer sequences used for immunoscope analysis 1
| Family | Sequences 5′–3′ |
|---|---|
| Vβ1 | CTGAATGCCCAGACAGCTCCAGC |
| Vβ2 | TCACTGATACGGAGCTGAGGC |
| Vβ3 | CCTTGCAGCCTAGAAATTCAGT |
| Vβ4 | GCCTCAAGTCGCTTCCAACCTC |
| Vβ5.2 | AAGGTGGAGAGAGACAAAGGATTC |
| Vβ6 | CTCTCACTGTGACATCTGCCC |
| Vβ7 | TACAGGGTCTCACGGAAGAAGC |
| Vβ8.2 | CATTATTCATATGGTGCTGGC |
| Vβ8.3 | TGCTGGCAACCTTCGAATAGGA |
| Vβ9 | TCTCTCTACATTGGCTCTGCAGGC |
| Vβ10 | ATCAAGTCTGTAGAGCCGGAGGA |
| Vβ11 | GCACTCAACTCTTGAAGATCCAGAGC |
| Vβ12 | GATGGTGGGGCTTTCAAGGATC |
| Vβ13 | AGGCCTAAAGGAACTAACTCCCAC |
| Vβ14 | ACGACCAATTCATCCTAAGCAC |
| Vβ15 | CCCATCAGTCATCCCAACTTATCC |
| Vβ16 | CACTCTGAAAATCCAACCCAC |
| Vβ18 | CAGCCGGCCAAACCTAACATTCTC |
| Cβ-FAM | FAM-TTGGGTGGAGTCACATTTCTC |
FAM: 5-carboxyfluorescein.
Sequencing analysis
The PCR was performed with PrimeSTAR GXL DNA polymerase. This reaction was performed using a Vβ-specific primer and a Cβ-specific primer. The PCR product was purified using Tris-saturated phenol : chloroform : isoamylalcohol (25 : 24 : 1), and an adenine-tail was added by Ex Taq DNA Polymerase (TaKaRa). The adenine-tailed PCR product was cloned using the pCR2.1-TOPO TA cloning kit (Invitrogen). Each CDR3 clone plasmid DNA was obtained, and the nucleotide sequence was analysed using the ABI BigDye 1.1 Cycle sequencing kit (Applied Biosystems) with the M13-reverse primer (5′-CAGGAAACAGCTATGAC-3′). The product was analysed with the ABI 310 Genetic Analyzer (Applied Biosystems). The resultant sequence data were analysed using Sequence Scanner software (Applied Biosystems) and IMGT/V-QUEST online software.24
Nomenclature
Gene names of Vβ, Jβ and Vα are according to the Immunogenetics (IMGT) gene name nomenclature for Immunoglobulin (Ig) and T cell Receptor (TR) of mice.25–27
Statistical analysis
Student's t-test with Bonferroni correction was used for each statistical analysis. P-values less than 0·05 divided by the number of comparisons were considered statistically significant.
Results
CD8+ CD122+ cells are separated into two subpopulations by CD49d expression
We have reported that CD122 could be used as a marker for CD8+ Treg cells.10 However, CD122 is also a classical marker for CD8+ memory T cells17; therefore, CD8+ CD122+ cells could contain both memory and regulatory T cells. Dai et al.16 reported that PD-1 expression defines subpopulations of CD8+ CD122+ cells. They showed that CD8+CD122+ PD-1+ cells mainly produced IL-10 in vitro, and that they suppressed rejection of allogeneic skin grafts in vivo. On the basis of these data, the authors concluded that PD-1+ cells in the CD8+ CD122+ population are real regulatory cells. We found that CD49d (integrin-α4 chain) divides CD8+ CD122+ cells into two populations (CD122+ CD49dlow cells and CD122+ CD49dhigh cells, Fig. 1a). Expression of CD49d in CD8+ CD122+ cells mostly correlated with that of PD-1 (Fig. 1b). CD8+ CD122+ CD49dhigh cells, but not CD8+ CD122+ CD49dlow cells, produced IL-10 in vitro when stimulated with an anti-CD3 antibody (Fig. 1c). This CD8+ CD122+ CD49dhigh cell subset was sustained until the mice were at least 20 weeks of age (Fig. 1d). On the basis of these results, subsequent experiments focused on CD8+ CD122+ CD49dhigh cells rather than CD8+ CD122+CD49dlow cells, and their TCR diversity was compared with that of CD8+ CD122− cells (conventional, naive T cells).
Figure 1.
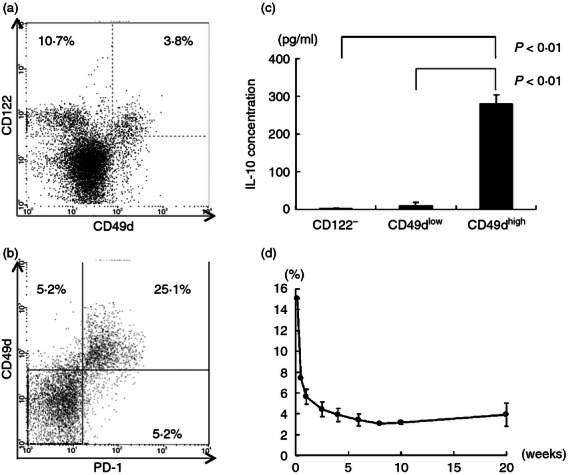
Characteristics of CD49dhigh and CD49dlow cells in CD8+ CD122+ cells. (a) FACS analysis of spleen cells obtained from 6-week-old female C57BL/6 mice. Cells were stained with anti-CD8a, anti-CD122 and anti-CD49d antibodies. Expression pattern of CD49d and CD122 in CD8+ cells is shown. A representative result among more than 10 experiments is presented. (b) Expression profile of programmed death 1 (PD-1) and CD49d in the CD8+ CD122+ population. Spleen cells were stained with anti-CD8a, anti-CD122, anti-CD49d and anti-PD-1 antibodies. Only CD8+ CD122+ cells are shown in the plot. (c) CD8+ CD122−, CD8+ CD122+ CD49dlow and CD8+ CD122+ CD49dhigh cells were collected from spleen cells using a cell sorter and 105 cells per well were stimulated with plate-bound anti-CD3 antibody in vitro for 48 hr. Interleukin 10 (IL-10) concentration in the culture supernatant was measured by ELISA. Results are shown as mean ± standard deviation (SD). This result is representative of more than five independent experiments performed. (d) Percentage of CD8+ CD122+ CD49dhigh cells in mice of various ages. Spleen cells obtained from mice of the indicated age were analysed. In each experiment, more than 105 cells obtained from a single mouse were analysed in a single experiment except when cells were collected from two to four mice in the case of neonates. Percentages of CD8+ CD122+ CD49dhigh cells in CD8+ populations are shown as mean ± SD. Results are obtained from at least three independent experiments.
CD8+ CD122+ CD49dhigh cells had skewed Vβ usage in mesenteric lymph nodes
We compared TCR Vβ usage of CD8+ CD122+ C-D49dhigh cells and CD8+ CD122+ CD49dlow cells with that of CD8+ CD122− cells. Cells were stained with a panel of each Vβ-specific antibody, and the percentage of cells that used each Vβ was determined using flow cytometric analysis. In the spleens of wild-type mice, no statistically significant differences were observed in the percentage of each Vβ+ cell in the three populations (Fig. 2a). However, in mesenteric lymph nodes (MLNs), the percentage of Vβ13+ cells was significantly higher in CD8+ CD122+ CD49dhigh cells (10%) than in CD8+ C-D122− cells (4%, P < 0·01) or CD8+ CD122+ CD49dlow cells (5%, P < 0·01), suggesting an increase in CD8+ CD122+ CD49dhigh Vβ13+ cells in MLNs (Fig. 2b).
Figure 2.
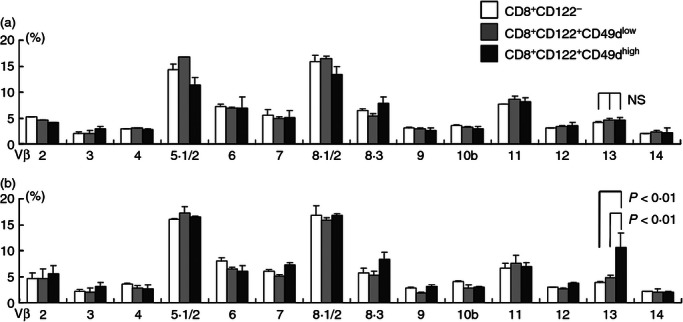
T-cell receptor (TCR) Vβ usage of CD8+ T-cell subsets. (a) TCR Vβ usage of CD8+ CD122− (white bars), CD8+ CD122+ CD49dlow (light grey bars) and CD8+ CD122+ CD49dhigh cells (dark grey bars) in the spleen is shown. Spleen cells from 6-week-old C57BL/6 mice (1 × 10⁶ cells for one staining) were stained with anti-CD8, anti-CD122, anti-CD49d, and each anti-Vβ-specific antibody; the percentages of each Vβ+ cell in each cell subset are demonstrated as a graph. (b) Identical analysis of Vβ usage to (a) was performed except that the cells were obtained from mesenteric lymph nodes; 1 × 10⁶ cells for one staining were also maintained for lymph node cells. Percentages of cells stained with each Vβ-specific antibody in each cell subset are shown as mean ± SD. Results were obtained from three independent experiments.
Immunoscope analysis of CDR3 regions of TCRs showed different patterns among CD8+ CD122+ CD49dhigh cells, CD8+ CD122+ CD49dlow cells and CD8+ CD122− cells
Next, we examined TCR diversity of the CD8+ T-cell populations using immunoscope analysis (Figs. 3a,b). The results showed several skewed peaks that were not observed in CD8+ CD122− cells, but that were apparent in CD8+ CD122+ CD49dhigh cells. There were also several skewed peaks in CD8+ CD122+ CD49dlow cells. There was a skewed peak in CD8+ CD122+ CD49dhigh cells harbouring Vβ13, which was expected to be present on the basis of the analysis of Vβ usage.
Figure 3.
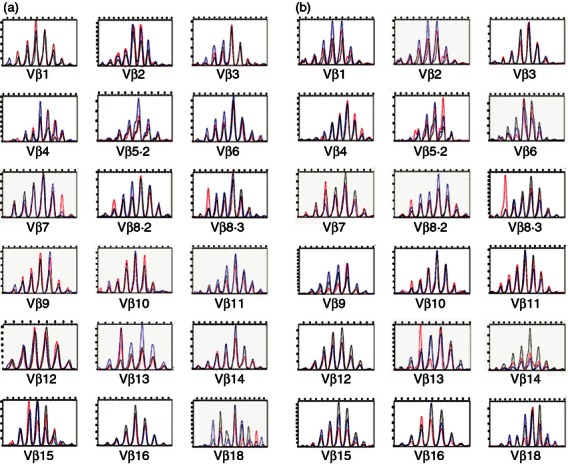
Immunoscope analysis. (a) Immunoscope analysis with Vβ-specific primers and Cβ primers was performed with cDNA obtained from CD8+ CD122− (black lines), CD8+ CD122+ CD49dlow (blue lines) and CD8+ CD122+ CD49dhigh (red lines) cells in (a) spleens and (b) mesenteric lymph nodes. Results are representative of two independent experiments.
CD8+ CD122+ cells have clonal expansion according to CDR3 sequencing results
We focused on Vβ13 and analysed the nucleotide sequences containing the CDR3 of TCR-β. cDNAs obtained by reverse transcription-PCR (RT-PCR) of CDR3 combined with Vβ13 in CD8+ CD122+ CD49dhigh cells, CD8+ CD122+ CD49dlow cells and CD8+ CD122− cells were cloned and compared with one another. In the clones analysed to determine the nucleotide sequences in each cell population, the most common CDR3 sequences are listed in Fig. 4. There was only one CDR3 sequence that appeared twice during DNA sequence analysis of CD8+ CD122− cells (Fig. 4c). In comparison with the result obtained from CD8+ CD122− cells, three different CDR3 sequences were found twice in CD8+ CD122+ CD49dlow cells (Fig. 4b), possibly suggesting a higher frequency of expanded clones in this cell population. In contrast with the reasonably divergent CDR3 sequences in CD8+ CD122− cells, identical CDR3 sequences were frequently found in CD8+ CD122+CD49dhigh cells. In particular, one CDR3 sequence (ASSYRGAEQF) was found five times in the first experiment and six times in the second independent experiment, which suggests the expansion of T cells possessing one characteristic TCR β-chain (Fig. 4a). Exp. 1 and Exp. 2 in Figure 4 were totally independent experiments started from different mice, from which we obtained four common sequences. This result confirms that such cloning of identical TCRs from different mice is the reflection of universal events occurring in every mouse, not the accidental events that occurred in some cloning step. These CDR3 sequence data are consistent with the data from the immunoscope analysis. The most frequent sequence observed in CD8+ CD122+ CD49dhigh cells (ASSYRGAEQF) and possibly by addition of sequences with the same length (e.g. ASSFRNTEVF) corresponded to the highest peak in the immunoscope analysis of Vβ13 left side peak of the red line in Fig. 3a), which was not observed in CD8+ CD122+ CD49dlow cells and CD8+ CD122− cells.
Figure 4.

Complementarity-determining region 3 (CDR3)-sequence analysis. CDR3 DNA sequences of (a) CD8+ CD122+ CD49dhigh cells, (b) CD8+ CD122+ CD49dlow cells and (c) CD8+ CD122− cells were analysed by PCR using a Vβ13-specific primer and Cβ primer followed by determination of DNA sequences around CDR3. Amino acid sequences that appeared more than twice are shown with the number of clones with identical sequences in the total number of clones sequenced. Results were obtained from two independent experiments.
Further immunoscope analysis
We further analysed cDNA obtained from CD8+ CD122− cells, CD8+ CD122+ CD49dhigh cells, CD8+ CD122+CD49dlow cells by immunoscope using primers for TCR Jβ combined with Vβ13, and some Vαs combined with Cα. The results of Vβ13-Jβ and Vα-Cα are shown in the Supplementary material, Fig. S1a and S1b, respectively. Although, the immunoscopic analysis using Jβ primers showed some skewed peaks as expected, it gave no further information than the analysis by Vβs-Cβ There was no clonal or oligoclonal enrichment of specific amplification of TCR clones, which would attract our attention to go into further analysis. By the analysis of α-chain by immunoscope of 11 different Vαs, we have not found any remarkable skewing of peaks in CD8+ CD122+ CD49dhigh cells or CD8+ CD122+ CD49dlow cells. We only analysed 11 different Vαs to represent all the Vαs, which are estimated to be around 100. Judged from the result of immunoscope assays using 11 primers corresponding to the 11 different Vα segments, we did not perform further immunoscopic analysis using other Vα primers.
Immunoscope analysis of very young mice
To assess whether clonal expansion occurred as a result of the advantage in thymic selection or superior proliferative capacity in the periphery, we analysed the spectratype of T cells obtained from neonatal mice. CD8+ CD122+CD49dhigh cells obtained from day-4 spleens had no detectable skewing of TCR length diversity in immunoscope analysis compared with those obtained from spleens of 6-week-old mice, indicating that clonal expansion causing skewing of TCR diversity occurred in mature T cells as the result of proliferation in the periphery (Fig. 5).
Figure 5.
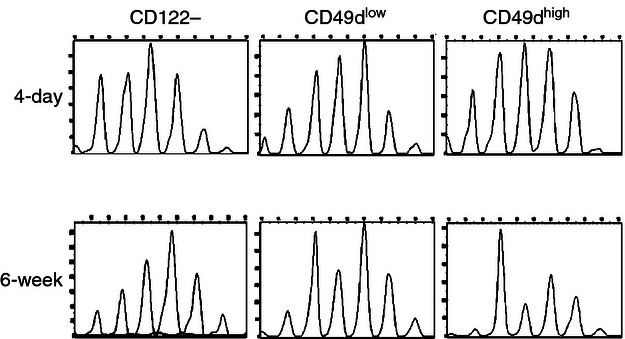
Immunoscope analysis of neonatal T cells. The cDNA of cell subsets sorted from the spleens of 4-day-old and 6-week-old mice were analysed with the Vβ13-specific primer in combination with the Cβ primer. Results are representative of two independent experiments.
Discussion
We studied TCR diversity of CD8+ CD122+ cells using CD49d. Expression of CD49d in CD8+ CD122+ cells seemed to correlate with that of PD-1 (Fig. 1b); PD-1 expression has been shown to indicate Treg cells.16 Although we have not investigated the regulatory function of CD8+ CD122+ CD49dhigh cells, such a correlation between PD-1 and CD49d suggests that CD8+ CD122+CD49dhigh cells also contain functional Treg cells similar to CD8+ CD122+ PD-1+ cells. We also observed that the proportion of CD122+ CD49dhigh cells among total CD8+ T cells was high (∼ 15%) in neonates or very young mice. Although we cannot address the meaning and mechanism of this phenomenon at present, it strongly correlates with our previous observation of a high proportion of CD122+ cells among total CD8+ T cells.10 It is known that the CD8+ CD122+ population contains memory T cells16 and such CD8+ CD122+ T cells appear in very young mice.28 Although these CD8+ CD122+ T cells were thought to be memory T cells because they quickly responded to stimulations and produced interferon-γ, it may also be possible to designate these CD8+ CD122+ cells as regulatory cells. In fact, we observed that CD8+ CD122+ CD49dhigh cells produced both IL-10 and interferon-γ when the cells were stimulated by anti-CD3 and anti-CD28 antibody-coated beads (our unpublished observation). If such CD8+ CD122+ memory T cells develop early and appear in very young mice, CD8+ CD122+ Treg cells may also develop earlier than conventional CD8+ CD122− T cells to avoid a condition without Treg cells because conventional CD8+ CD122− T cells, once activated by responding to either self or non-self antigens, may stay in the activated state and produce harmful levels of cytokines without regulation by CD8+ Treg cells.10
In the initial flow cytometric analysis using a panel of anti-Vβ-specific antibodies, skewed use of Vβ13 was found in CD8+ CD122+ CD49dhigh cells obtained from MLNs (Fig. 2b). This skewed use of Vβ13 was not observed in the cells obtained from spleens (Fig. 2a), suggesting a different distribution of CD8+ Treg cells among lymphatic organs. The rationale for this skewed use of Vβ13 may be of future interest. There may be an unknown function of CD8+ CD122+ Treg cells in the intestine. The data presented here may correlate with data in our previous study, which showed that CD8+ CD122+ Treg cells inhibit colitogenic CD4+ CD45RBhigh cells in vivo.12 However, immunoscope analysis showed a similar pattern between CD8+ CD122+ CD49dhigh cells obtained from MLNs (Fig. 3a) and spleens (Fig. 3b), which suggests that the results from flow cytometric analysis were the result of the lower sensitivity of this technique compared with immunoscope analysis.
CD8+ CD122+ CD49dhigh cells display a different use of their TCR from other CD8+ T-cell populations. Such limited diversity is probably generated by clonal expansion of mature CD8+ CD122+ CD49dhigh cells in the periphery rather than by preferential formation of TCR diversity in the thymus because such skewing of TCR diversity is not observed in the same CD8+ CD122+CD49dhigh cell population obtained from neonatal (4-day-old) mice. We investigated whether CD8+ CD122+CD49dhigh cells carrying the characteristic TCR are preferentially selected in the thymus or expanded in the periphery. The data obtained from analysing neonate spleen T cells suggest that they expanded in the periphery during the course of immune constitution (Fig. 5). In neonates, lymphopenia-induced homeostatic proliferation occurs, which leads to generation of T cells with an activated phenotype,29 CD8+ CD122+ Treg cells may recognize these activated T cells and expand during this period.
Understanding TCR diversity is of considerable importance. Several studies have examined TCR diversity of CD4+ CD25+ Foxp3+ Treg cells.30,31 In neutral conditions, the TCR of CD4+ CD25+ Foxp3+ Treg cells is diverse.32,33 We found characteristically skewed TCR use in CD8+ CD122+ CD49dhigh cells, which is different from that in CD4+ CD25+ Foxp3+ Treg cells. Although we have not identified the mechanism underlying such skewed TCR use in CD8+ CD122+ CD49dhigh cells, and possibly in CD8+ CD122+ CD49dlow cells as well, one possibility is that CD8+ CD122+ CD49dhigh cells and/or CD8+ CD122+ CD49dlow cells may be constantly making contact with activated T cells that are also constantly generated because of exposure to exogenous antigens. In a previous study, we proposed that CD8+ CD122+ Treg cells recognize antigens selectively expressed in activated T cells to exceed regulatory activity.34 On the basis of this hypothesis, we may be able to identify the target antigen recognized by CD8+ CD122+ Treg cells with the traditional method used for cytotoxic T lymphocytes, i.e. expression cloning from a cDNA library prepared from target cells. To study the characteristic TCR of CD8+ CD122+ Treg cells, namely that of Vβ13+ cells, will lead to the identification of their target antigen, which may provide insight into understanding their function.
By comparing the immunoscopic profile between CD8+ CD122+ CD49d+ cells and CD8+ CD122− cells using Vβ13 and Jβ primers, there are some skewing peaks in CD8+ CD122+ CD49d+ cells but they do not appear to be clonal or oligoclonal. It looks not much different from the analysis by various Vβ-Cβ immunoscopic analyses. From the sequence-determining analysis of Vβ13+ cells, the TCR clonality was less than 10% in the most frequently appeared clone, suggesting difficulty in showing clonality in the immunoscopic analysis by this case. The sequencing analysis showed the most frequently appeared clone to be Jβ2.1 and the immunoscope analysis of Vβ13-Jβ2.1 showed a skewed peak in CD8+ CD122+ CD49dhigh cells but the overall shape was not much different from that of Vβ13-Cβ.
A limitation of this study is that we did not show a relationship between each TCR and the regulatory function of the cells; this could be investigated by establishing many CD8+ CD122+ Treg cell clones, and then determining the regulatory function of the clones that possess the preferential CDR3 sequences detected in this study. Unfortunately, we have not succeeded in establishing functional CD8+ CD122+ Treg cell clones yet because these Treg cells lose their proliferating capacity in in vitro culture (our unpublished observation). It is difficult to determine the function of clonally expanded Treg cells obtained from wild-type mice because of the lack of methodology to purify a population with a single type of TCR. It may be necessary to make a number of lines of TCR transgenic mice to determine the function of T cells carrying one specific TCR.
The interpretation of this study is limited by the lack of a conclusion as to which subset of CD8+ CD122+CD49dhigh or CD8+ CD122+ CD49dlow cells are Treg cells. The study of PD-1+ cells in the CD8+ CD122+ population by Dai et al.16 and correlation of expression between PD-1 and CD49d (Fig. 1b) strongly suggests CD8+ CD122+CD49dhigh cells as Treg cells, while the possibility of CD49dlow as Treg cells still remains unknown (our unpublished observation). It has been demonstrated that memory T cells have skewed TCR diversity,35 whereas there is little information regarding the TCR diversity of CD8+ Treg cells. In this study, we observed an increased number of identical clones of TCR Vβ CDR3 (Fig. 4) in both CD8+ CD122+ CD49dhigh and CD8+ CD122+ CD49dlow populations compared with that of the CD8+ CD122− naive T-cell population, indicating clonal expansion of these CD122-expressing T cells. Importantly, identical clones were not shared between those obtained from the CD49dhigh population and the CD49dlow population (Figs. 4a,b). This result indicates that two fundamentally different cell populations (probably Treg cells and memory T cells) are efficiently separated into the CD8+ CD12-2+ CD49dlow population and the CD8+ CD122+ CD4-9dhigh population. Therefore, regardless of whether Treg cells are in the CD8+ CD122+ CD49dlow population or in the CD8+ CD122+ CD49dhigh population, the conclusion that CD8+ CD122+ Treg cells have skewed TCR diversity is unchanged.
Acknowledgments
We thank Prof. Ken-ichi Isobe for financial help and useful discussions.
This work was supported by a Grant-in-Aid from the Japanese Ministry of Education, Culture, Science, Sports, and Technology, the Japanese Society for the Promotion of Science [grant number 20-08460], DAIKO Foundation, the 24th General Assembly of the Japanese Association of Medical Sciences, and The Waksman Foundation of Japan Inc.
Glossary
- FAM
5-carboxyfluorescein
- IL-10
interleukin-10
- MLN
mesenteric lymph nodes
- PD-1
programmed death-1
- PE
phycoerythrin
- TCR
T-cell receptor
- Treg
regulatory T
Disclosures
The authors declare no financial or commercial conflict of interest.
Supporting Information
Additional Supporting Information may be found in the online version of this article:
Figure S1. (a) Immunoscope analysis with Vβ13-specific primers and Jβ primers was performed with cDNA obtained from CD8+ CD122− (black lines), CD8+ CD122+ CD49dlow (blue lines) and CD8+ CD122+ CD49dhigh (red lines) cells in mesenteric lymph nodes. (b) Immunoscope analysis with Vα-specific primers and Cα primers was performed with cDNA obtained from CD8+ CD122− (black lines), CD8+ CD122+ CD49dlow (blue lines) and CD8+ CD122+ CD49dhigh (red lines) cells in mesenteric lymph nodes.
Table S1. Primer sequences used for immunoscope analysis.
Table S2. Primer sequences used for immunoscope analysis.
References
- 1.Paust S, Cantor H. Regulatory T cells and autoimmune disease. Immunol Rev. 2005;204:195–207. doi: 10.1111/j.0105-2896.2005.00247.x. [DOI] [PubMed] [Google Scholar]
- 2.Tang XL, Smith TR, Kumar V. Specific control of immunity by regulatory CD8 T cells. Cell Mol Immunol. 2005;2:11–9. [PubMed] [Google Scholar]
- 3.Shevach EM, DiPaolo RA, Andersson J, Zhao DM, Stephens GL, Thornton AM. The lifestyle of naturally occurring CD4+ CD25+ Foxp3+ regulatory T cells. Immunol Rev. 2006;212:60–73. doi: 10.1111/j.0105-2896.2006.00415.x. [DOI] [PubMed] [Google Scholar]
- 4.Fontenot JD, Gavin MA, Rudensky AY. Foxp3 programs the development and function of CD4+ CD25+ regulatory T cells. Nat Immunol. 2003;4:330–6. doi: 10.1038/ni904. [DOI] [PubMed] [Google Scholar]
- 5.Khattri R, Cox T, Yasayko SA, Ramsdell F. An essential role for Scurfin in CD4+ CD25+ T regulatory cells. Nat Immunol. 2003;4:337–42. doi: 10.1038/ni909. [DOI] [PubMed] [Google Scholar]
- 6.Yong Z, Chang L, Mei YX, Yi L. Role and mechanisms of CD4+ CD25+ regulatory T cells in the induction and maintenance of transplantation tolerance. Transpl Immunol. 2007;17:120–9. doi: 10.1016/j.trim.2006.09.005. [DOI] [PubMed] [Google Scholar]
- 7.Thumar JR, Kluger HM. Ipilimumab: a promising immunotherapy for melanoma. Oncology (Williston Park) 2010;24:1280–8. [PubMed] [Google Scholar]
- 8.Kim HJ, Verbinnen B, Tang X, Lu L, Cantor H. Inhibition of follicular T-helper cells by CD8+ regulatory T cells is essential for self tolerance. Nature. 2010;467:328–32. doi: 10.1038/nature09370. [DOI] [PMC free article] [PubMed] [Google Scholar]
- 9.Apetoh L, Quintana FJ, Pot C, et al. The aryl hydrocarbon receptor interacts with c-Maf to promote the differentiation of type 1 regulatory T cells induced by IL-27. Nat Immunol. 2010;11:854–61. doi: 10.1038/ni.1912. [DOI] [PMC free article] [PubMed] [Google Scholar]
- 10.Rifa'i M, Kawamoto Y, Nakashima I, Suzuki H. Essential roles of CD8+ CD122+ regulatory T cells in the maintenance of T cell homeostasis. J Exp Med. 2004;200:1123–34. doi: 10.1084/jem.20040395. [DOI] [PMC free article] [PubMed] [Google Scholar]
- 11.Lee YH, Ishida Y. Rifa'i M, Shi Z, Isobe K, Suzuki H. Essential role of CD8+ CD122+ regulatory T cells in the recovery from experimental autoimmune encephalomyelitis. J Immunol. 2008;180:825–32. doi: 10.4049/jimmunol.180.2.825. [DOI] [PubMed] [Google Scholar]
- 12.Endharti AT, Okuno Y, Shi Z, Misawa N, Toyokuni S, Ito M, Isobe K, Suzuki H. CD8+ CD122+ regulatory T cells (Tregs) and CD4+ Tregs cooperatively prevent and cure CD4+ cell-induced colitis. J Immunol. 2011;186:41–52. doi: 10.4049/jimmunol.1000800. [DOI] [PubMed] [Google Scholar]
- 13.Saitoh O, Abiru N, Nakahara M, Nagayama Y. CD8+ CD122+ T cells, a newly identified regulatory T subset, negatively regulate Graves' hyperthyroidism in a murine model. Endocrinology. 2007;148:6040–6. doi: 10.1210/en.2007-0300. [DOI] [PubMed] [Google Scholar]
- 14.Endharti AT, Rifa IM, Shi Z, et al. Cutting edge: CD8+ CD122+ regulatory T cells produce IL-10 to suppress IFN-γ production and proliferation of CD8+ T cells. J Immunol. 2005;175:7093–7. doi: 10.4049/jimmunol.175.11.7093. [DOI] [PubMed] [Google Scholar]
- 15.Shi Z, Okuno Y, Rifa'i M, Endharti AT, Akane K, Isobe K, Suzuki H. Human CD8+ CXCR3+ T cells have the same function as murine CD8+ CD122+ Treg. Eur J Immunol. 2009;39:2106–19. doi: 10.1002/eji.200939314. [DOI] [PubMed] [Google Scholar]
- 16.Suzuki H, Shi Z, Okuno Y, Isobe K. Are CD8+ CD122+ cells regulatory T cells or memory T cells? Hum Immunol. 2008;69:751–4. doi: 10.1016/j.humimm.2008.08.285. [DOI] [PubMed] [Google Scholar]
- 17.Dai H, Wan N, Zhang S, Moore Y, Wan F, Dai Z. Cutting edge: programmed death-1 defines CD8+ CD122+ T cells as regulatory versus memory T cells. J Immunol. 2010;185:803–7. doi: 10.4049/jimmunol.1000661. [DOI] [PubMed] [Google Scholar]
- 18.Sprent J, Surh CD. T cell memory. Annu Rev Immunol. 2002;20:551–79. doi: 10.1146/annurev.immunol.20.100101.151926. [DOI] [PubMed] [Google Scholar]
- 19.Turner SJ, La Gruta NL, Kedzierska K, Thomas PG, Doherty PC. Functional implications of T cell receptor diversity. Curr Opin Immunol. 2009;21:286–90. doi: 10.1016/j.coi.2009.05.004. [DOI] [PMC free article] [PubMed] [Google Scholar]
- 20.Kedzierska K, La Gruta NL, Stambas J, Turner SJ, Doherty PC. Tracking phenotypically and functionally distinct T cell subsets via T cell repertoire diversity. Mol Immunol. 2008;45:607–18. doi: 10.1016/j.molimm.2006.05.017. [DOI] [PMC free article] [PubMed] [Google Scholar]
- 21.Knuth A, Jager D, Jager E. Cancer immunotherapy in clinical oncology. Cancer Chemother Pharmacol. 2000;46(Suppl):S46–51. doi: 10.1007/pl00014050. [DOI] [PubMed] [Google Scholar]
- 22.Nishikawa H, Kato T, Tawara I, et al. Definition of target antigens for naturally occurring CD4+ CD25+ regulatory T cells. J Exp Med. 2005;201:681–6. doi: 10.1084/jem.20041959. [DOI] [PMC free article] [PubMed] [Google Scholar]
- 23.Wang HY, Lee DA, Peng G, Guo Z, Li Y, Kiniwa Y, Shevach EM, Wang RF. Tumor-specific human CD4+ regulatory T cells and their ligands: implications for immunotherapy. Immunity. 2004;20:107–18. doi: 10.1016/s1074-7613(03)00359-5. [DOI] [PubMed] [Google Scholar]
- 24.Currier JR, Robinson MA. Spectratype/immunoscope analysis of the expressed TCR repertoire. Current Protocols in Immunology. 2001;38:10.28.1–10.28.24. doi: 10.1002/0471142735.im1028s38. [DOI] [PubMed] [Google Scholar]
- 25.Brochet X, Lefranc MP, Giudicelli V. IMGT/V-QUEST: the highly customized and integrated system for IG and TR standardized V-J and V-D-J sequence analysis. Nucleic Acids Res. 2008;36:W503–8. doi: 10.1093/nar/gkn316. (Web Server issue) [DOI] [PMC free article] [PubMed] [Google Scholar]
- 26.Bosc N, Lefranc MP. The mouse (Mus musculus) T cell receptor α (TRA) and δ (TRD) variable genes. Dev Comp Immunol. 2003;27:465–97. doi: 10.1016/s0145-305x(03)00027-2. [DOI] [PubMed] [Google Scholar]
- 27.Arden B, Clark SP, Kabelitz D, Mak TW. Mouse T-cell receptor variable gene segment families. Immunogenetics. 1995;42:501–30. doi: 10.1007/BF00172177. [DOI] [PubMed] [Google Scholar]
- 28.Wilson RK, Lai E, Concannon P, Barth RK, Hood LE. Structure, organization and polymorphism of murine and human T-cell receptor α and β chain gene families. Immunol Rev. 1988;101:149–72. doi: 10.1111/j.1600-065x.1988.tb00736.x. [DOI] [PubMed] [Google Scholar]
- 29.Ichii H, Sakamoto A, Hatano M, et al. Role for Bcl-6 in the generation and maintenance of memory CD8+ T cells. Nat Immunol. 2002;3:558–63. doi: 10.1038/ni802. [DOI] [PubMed] [Google Scholar]
- 30.Schuler T, Hammerling GJ, Arnold B. Cutting edge: IL-7-dependent homeostatic proliferation of CD8+ T cells in neonatal mice allows the generation of long-lived natural memory T cells. J Immunol. 2004;172:15–9. doi: 10.4049/jimmunol.172.1.15. [DOI] [PubMed] [Google Scholar]
- 31.Daniely D, Kern J, Cebula A, Ignatowicz L. Diversity of TCRs on natural Foxp3+ T cells in mice lacking Aire expression. J Immunol. 2010;184:6865–73. doi: 10.4049/jimmunol.0903609. [DOI] [PMC free article] [PubMed] [Google Scholar]
- 32.Pacholczyk R, Ignatowicz H, Kraj P, Ignatowicz L. Origin and T cell receptor diversity of Foxp3+ CD4+ CD25+ T cells. Immunity. 2006;25:249–59. doi: 10.1016/j.immuni.2006.05.016. [DOI] [PubMed] [Google Scholar]
- 33.Fujishima M, Hirokawa M, Fujishima N, Sawada K. TCRαβ repertoire diversity of human naturally occurring CD4+ CD25+ regulatory T cells. Immunol Lett. 2005;99:193–7. doi: 10.1016/j.imlet.2005.02.011. [DOI] [PubMed] [Google Scholar]
- 34.Kasow KA, Chen X, Knowles J, Wichlan D, Handgretinger R, Riberdy JM. Human CD4+ CD25+ regulatory T cells share equally complex and comparable repertoires with CD4+ CD25– counterparts. J Immunol. 2004;172:6123–8. doi: 10.4049/jimmunol.172.10.6123. [DOI] [PubMed] [Google Scholar]
- 35.Rifa'i M, Shi Z, Zhang SY, Lee YH, Shiku H, Isobe K, Suzuki H. CD8+ CD122+ regulatory T cells recognize activated T cells via conventional MHC class I-αβTCR interaction and become IL-10-producing active regulatory cells. Int Immunol. 2008;20:937–47. doi: 10.1093/intimm/dxn052. [DOI] [PubMed] [Google Scholar]
- 36.Kurachi M, Kakimi K, Ueha S, Matsushima K. Maintenance of memory CD8+ T cell diversity and proliferative potential by a primary response upon re-challenge. Int Immunol. 2007;19:105–15. doi: 10.1093/intimm/dxl127. [DOI] [PubMed] [Google Scholar]
Associated Data
This section collects any data citations, data availability statements, or supplementary materials included in this article.