

Abstract
In monoclonal gammopathies (MG) and multiple myeloma (MM), normal natural cytotoxicity receptors (NCR) expression (NCR1/NKp46, NCR2/NKp44, NCR3/NKp30) is observed in natural killer (NK) cells. Nonetheless, except in plasma cell leukemia, few tumor plasmocytes are present in PB, while NK studies have been performed on peripheral blood (PB). For this reason we focused our attention on NK from bone marrow (BM). Our study demonstrates that the down-regulation of NCR3/NKp30 is only detectable in NK from BM but not in PB, and shows a drastic decrease of both NKG2D and CD244/2B4/p38 expression in NK from BM in comparison with PB. In conclusion, our data more precisely describe the mechanism of immune escape of MG/MM from innate immunity since we show a drastic down regulation of 3 major activating NK receptors (NCR3/NKp30, NKG2D and CD244/2B4/p38) at the site of tumor, i.e BM, that was undetectable in PB. Further studies regarding immune regulatory drugs in MG/MM will imperiously require the assessment of immune cell status not only in PB but also in BM to obtain more relevant data regarding anti-tumor efficacy.
Keywords: anti-tumour immune response, CD244/2B4/p38, multiple myeloma, natural cytotoxicity receptors, natural killer cells, NKG2D
Introduction
Multiple myeloma (MM), despite initial response to conventional treatments and promising results with novel agents, is the paradigm of an incurable malignancy. Innate response and more specifically natural killer (NK) cells may participate in MM eradication or control (for review see ref. 1), as tumour plasmocytes are efficiently killed by normal NK cells.2 Nonetheless (i) high HLA class I molecule (particularly HLA-G) and high MHC class I chain-related protein A (MICA) expression on bone marrow (BM) myeloma cells may protect tumour cells from NK lysis,2–4 (ii) decreased cytotoxicity of peripheral blood (PB) NK cells has been described in monoclonal gammopathies (MG) and MM. Phenotype and functions of PB NK cells have already been analysed in MG/MM. Expression of normal natural cytotoxicity receptors (NCR) (NCR1/NKp46, NCR2/NKp44, NCR3/NKp30) was shown, and a down-regulation of CD244/2B4/p38 was present5 that may prevent its binding to the CD48 molecule at the MM cell surface.6 Nonetheless, except in plasma cell leukaemia, few tumour plasmocytes are present in PB, whereas NK studies have been performed on PB. As most MG/MM tumour cells are located in BM, we focused our attention on NK from BM.
Materials and methods
Blood samples were obtained from 13 patients before treatment: two MG of unknown significance (MGUS) and 11 MM. Healthy donors (HD, n = 37) were also analysed; 22 were selected as ‘age-matched’ (66·8 years ± 14.6 for HD versus 68 years ± 6 for patients). Regarding the International Myeloma Working Group prognosis index7, four patients were scored I, two patients scored II and five patients scored III, while regarding the MGUS one patient had a prognosis score8 of 1 and one had a score of 2. Median haemoglobin level was 114 g/l (80–148, n = 130–170), median calcemia level was 2·31 mmol/l (2·02–2·65, n = 2·23 to n = 2·58), median creatinine level was 90 μmol/l (63–464, n = 60–120), median percentage of BM plasmocytes was 20% (8–75, n < 5). Bence Jones proteinuria was detected at significant levels in four patients, MM-related bone lesions were detected in four patients. Cytogenetic analysis was performed in 11 patients and was abnormal in six patients. Data for each patient are detailed in Table 1. The analysis of PB was carried out less than 4 hr after blood sampling, on whole blood after red blood cell lysis (Q-Prep® lysing kit, Beckman-Coulter, Villepinte, France). The analysis of BM cells was performed after a Ficoll® gradient (Eurobio, Courtaboeuf, France) and depletion of plasmocytes (MACS® technology, using anti-CD138 monoclonal antibody, Miltenyi Biotec, Paris, France). The NK cell population was defined as CD3– CD56+. The following monoclonal antibodies were all obtained from Beckman-Coulter: anti-CD3-FITC (UCHT1), anti-CD56-PC5 (N901-NKH1), anti-NCR1/NKp46-phycoerythrin (PE), anti-NCR2/NKp44-PE, anti-NCR3/NKp30-PE, anti-NKG2D-PE, anti-CD244(2B4,p38)-PE. Triple staining was performed using CD3-FITC/CD56-PC5 in addition with anti-NCR1/NKp46-PE, anti-NCR2/NKp44-PE and anti-NCR3/NKp30-PE. For cell surface staining, cells (5 × 10⁵) were incubated for 20 min at 4° with 10 μl of the corresponding antibodies for 100 μl of cell preparation. Flow cytometry was performed on an Epics XL® flow cytometer (Beckman-Coulter). The results are expressed as follows; percentages correspond to (% positive cells – % isotype control), while the mean fluorescence intensities (MFI) correspond to the ratio (MFI positive cells : MFI isotype control). Statistical analysis was performed using the spss software (SPSS User's Guide. SPSS Inc., 1993; Chicago, IL). The Kolmogorov–Smirnov test was used to determine if the data fitted a normal distribution. As this test rejected the assumption of normality for all variables, comparisons were made using the non-parametric Wilcoxon matched-pairs (PB versus BM for each patient) signed rank test or the Student's t-test (patients versus HD).
Table 1.
Patient's characteristics
| Age (years) | Type of MC | Type of gammopathy | IPI | Hb (g/l) | Calcemia (mmol/l) | Creatinine (μmol/l) | BJ proteinuria | Bone lesions | Cytogenetics | Marrow plasmocytes (%) | |
|---|---|---|---|---|---|---|---|---|---|---|---|
| UPN1 | 74 | IgA κ | MM | I | 119 | 2·16 | 90 | No | No | t(4;14), 9% | 10 |
| UPN2 | 67 | IgG λ | MGUS | 2 | 142 | 2·41 | 77 | No | No | t(4;14), 86% | 8 |
| UPN3 | 67 | IgG λ | MM | I | 148 | 2·36 | 64 | No | No | Normal | 12 |
| UPN4 | 74 | IgG λ | MGUS | 0 | 132 | 2·27 | 63 | No | No | Not done | 4 |
| UPN5 | 55 | IgG λ | MM | I | 145 | 2·25 | 85 | No | No | p53 deletion | 11 |
| UPN6 | 58 | IgG λ | MM | II | 108 | 2·36 | 138 | No | No | Normal | 18 |
| UPN7 | 66 | IgG λ | MM | III | 106 | 2·02 | 119 | > 1 g/day | No | Normal | 20 |
| UPN8 | 75 | IgA λ | MM | I | 114 | 2·40 | 90 | No | No | t(4;14), 80% | 20 |
| UPN9 | 66 | λ | MM | III | 95 | 2·65 | 464 | > 1 g/day | Yes | Not done | 75 |
| UPN10 | 71 | IgG λ | MM | III | 80 | 2·22 | 387 | No | No | t(4;14), 85% | 40 |
| UPN11 | 71 | λ | MM | III | 108 | 2·25 | 66 | > 1 g/day | Yes | MAF del. | 50 |
| UPN12 | 74 | IgG λ | MM | III | 95 | 2·4 | 124 | No | Yes | Normal | 53 |
| UPN13 | 66 | κ | MM | II | 129 | 2·17 | 164 | > 5 g/day | Yes | Normal | 72 |
UPN, unique patient number; MC, monoclonal component; IPI, International Myeloma Working Group prognosis index; BJ, Bence Jones; MAF, musculo-aponeurotic fibrosarcoma oncogene homologue.
Results and discussion
First, we checked the percentage of NK cells in PB versus BM (data not shown), and failed to detect a significant difference both regarding the whole NK population (BM 11% ± 9 versus PB 9·5% ± 4, P > 0·05) and the CD56dim subpopulation (BM 98% ± 2 versus PB 94% ± 8, P > 0·05), whereas we detected a difference regarding the CD56bright subset (BM 2% ± 2 versus PB 6% ± 8, P < 0·05). We then compared the same parameters between PB from patients and HD (data not shown). We did not detect a difference regarding the whole NK population (10% ± 4 for HD versus 9·5 ± 4 for patients, P > 0·05), the CD56dim (87% ± 13 for HD versus 91 ± 9 for patients, P > 0·05) or the CD56bright subset (13% ± 13 for HD versus 9% ± 8 for patients, P > 0·05).
As defects in activating receptors have been described in NK cells from PB in many malignant haemopathies (see Sanchez et al.1 for review), we checked their expression by flow cytometry (Fig. 1a,b; % and MFI, respectively) in PB from HD (black bars) versus PB from patients (white bars). Regarding the percentage of cells expressing each receptor, we failed to detect any significant difference in NKp30/NCR3 (HD 67% ± 21 versus patients 61% ± 25, P > 0·05), NKp44/NCR2 (HD 7% ± 6 versus patients 11% ± 7, P > 0·05) and NKp46/NCR1 (HD 79·5% ± 14 versus patients 75% ± 17, P > 0·05) and CD244/2B4/p38 (HD 98% ± 1 versus patients 96% ± 7, P > 0·05). In contrast, we detected a significant difference regarding NKG2D (HD 94% ± 6 versus patients 85% ± 10 versus, P < 0·01). Regarding the MFI of each receptor, we failed to detect any significant difference in NKp30/NCR3 (HD 13 ± 7·5 versus patients 13·5 ± 14, P > 0·05), NKp44/NCR2 (HD 1·5 ± 0·35 versus patients 1·7 ± 0·4, P > 0·05) and NKp46/NCR1 (HD 20 ± 9 versus patients 21 ± 12, P > 0·05). In contrast, we detected a significant difference regarding NKG2D (HD 39 ± 16 versus patients 22 ± 9, P < 0·01) and CD244/2B4/p38 (HD 76 ± 36 versus 59 ± 30, P < 0·001).
Figure 1.
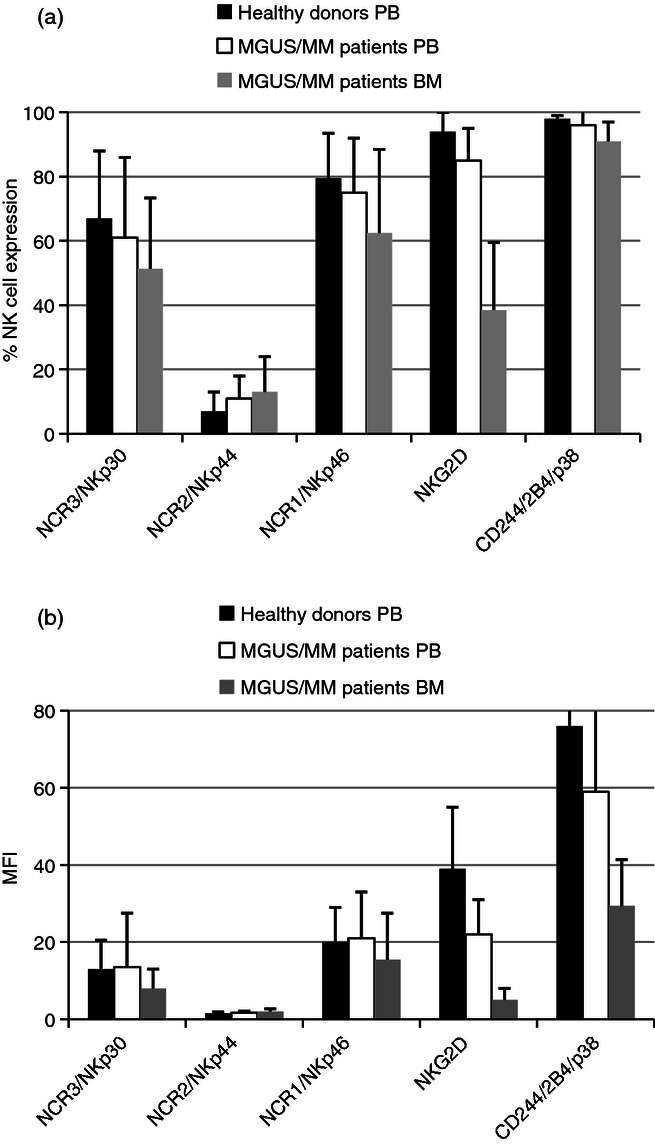
Comparison of the percentage (a) and mean fluorescent intensity (b) of natural killer (NK) cell expression of activating receptors in peripheral blood (PB) from healthy donors, PB of monoclonal gammopathies of unknown significance/multiple myeloma (MGUS/MM) patients, and bone marrow (BM) of MGUS/MM patients. The percentage (a) or mean fluorescence intensities (MFI) (b) of NK cell expression of the activating receptors in healthy donors’ PB (black bars), MGUS/MM patients’ PB (white bars) and MGUS/MM patients' BM (grey bars). Each plot corresponds to duplicate data from the 13 patients or 22 healthy donors, expressed as mean ± standard deviation. Percentages are expressed after subtraction of control isotype, whereas MFI corresponds to the ratio between the molecule studied and the isotype control. These results are based upon gated NK cells (CD3– CD56+).
Finally, we compared the expression of the various activating receptors (Fig. 1a,b; % and MFI, respectively) between PB (white bars) and BM (grey bars) of patients. Regarding the percentage of cells expressing each receptor, we detected a significant difference in NKp30/NCR3 expression (PB 61% ± 25 versus BM 51,4% ± 22, P < 0·05) but not for NKp44/NCR2 (PB 11% ± 7 versus BM 13,7% ± 11, P > 0·05) and NKp46/NCR1 (PB 75% ± 17 versus BM 62·5% ± 26, P > 0·05). We detected a significant difference for NKG2D expression (PB 85% ± 10 versus BM 38·5% ± 21, P < 0·01) and CD244/2B4/p30 expression (PB 96% ± 7 versus BM 91% ± 6, P < 0·05). Regarding the MFI of each receptor, we detected a significant difference in NKp30/NCR3 expression (PB 13·5 ± 14 versus BM 8 ± 5, P < 0·05) but not for NKp44/NCR2 (PB 1·7 ± 0·4 versus BM 2 ± 0·7, P > 0·05) or NKp46/NCR1 (PB 21 ± 12 versus BM 15·5 ± 12, P > 0·05). In contrast, we detected a significant difference regarding NKG2D expression (PB 22 ± 9 versus BM 5 ± 3, P < 0·01) and CD244/2B4/p38 (PB 59 ± 30 versus BM 29·4 ± 12, P < 0·01).
Our study (i) confirms our previous results regarding the down-regulation of NK cell activating receptors in MGUS/MM; (ii) extends our observation with the down-regulation of NKG2D in PB; (iii) shows that the down-regulation of NCR3/NKp30 is only detectable in BM but not in PB; (iv) more precisely defines the innate immune defects in MG/MM by demonstrating a further drastic decrease of both NKG2D and CD244/2B4/p38 expression from PB to BM. A drawback in our report is the lack of corresponding data for normal BM NK cells. This could suggest that the differences observed are only related to the site of sampling and not to the disease. This hypothesis is unlikely as a recent report of Eissens et al.9 failed to detect significant differences between NK from BM or PB regarding the molecules we studied. In conclusion, our data more precisely describe the mechanism of immune escape of MG/MM from innate immunity because we show a drastic down-regulation of three major activating NK receptors (NCR3/NKp30, NKG2D and CD244/2B4/p38) at the site of tumour, i.e. BM, whereas a less profound or absent down-regulation was observed in PB. Further studies regarding immune regulatory drugs in MG/MM will inevitably require the assessment of immune cell status not only in PB but also in BM to obtain more relevant data regarding anti-tumour efficacy.
Acknowledgments
This work was funded in part by the Association pour le DEveloppement de la REcherche Médicale (A.DE.RE.M).
Disclosure
The authors declare no conflict of interest.
References
- 1.Sanchez CJ, Le Treut T, Boehrer A, Knoblauch B, Imbert J, Olive D, Costello R. Natural killer cells and malignant haemopathies: a model for the interaction of cancer with innate immunity. Cancer Immunol Immunother. 2011;60:1–13. doi: 10.1007/s00262-010-0898-x. [DOI] [PMC free article] [PubMed] [Google Scholar]
- 2.Carbone E, Neri P, Mesuraca M, et al. HLA class I, NKG2D, and natural cytotoxicity receptors regulate multiple myeloma cell recognition by natural killer cells. Blood. 2005;105:251–8. doi: 10.1182/blood-2004-04-1422. [DOI] [PubMed] [Google Scholar]
- 3.Maki G, Hayes GM, Naji A, Tyler T, Carosella ED, Rouas-Freiss N, Gregory SA. NK resistance of tumor cells from multiple myeloma and chronic lymphocytic leukemia patients: implication of HLA-G. Leukemia. 2008;22:998–1006. doi: 10.1038/leu.2008.15. [DOI] [PubMed] [Google Scholar]
- 4.von Lilienfeld-Toal M, Frank S, Leyendecker C, et al. Reduced immune effector cell NKG2D expression and increased levels of soluble NKG2D ligands in multiple myeloma may not be causally linked. Cancer Immunol Immunother. 2010;59:829–39. doi: 10.1007/s00262-009-0807-3. [DOI] [PMC free article] [PubMed] [Google Scholar]
- 5.Fauriat C, Mallet F, Olive D, Costello RT. Impaired activating receptor expression pattern in natural killer cells from patients with multiple myeloma. Leukemia. 2006;20:732–3. doi: 10.1038/sj.leu.2404096. [DOI] [PubMed] [Google Scholar]
- 6.Hosen N, Ichihara H, Mugitani A, et al. CD48 as a novel molecular target for antibody therapy in multiple myeloma. Br J Haematol. 2012;156:213–24. doi: 10.1111/j.1365-2141.2011.08941.x. [DOI] [PubMed] [Google Scholar]
- 7.Greipp PR, San MJ, Durie BG, et al. International staging system for multiple myeloma. J Clin Oncol. 2005;23:3412–20. doi: 10.1200/JCO.2005.04.242. [DOI] [PubMed] [Google Scholar]
- 8.Kyle RA, Durie BG, Rajkumar SV, et al. Monoclonal gammopathy of undetermined significance (MGUS) and smoldering (asymptomatic) multiple myeloma: IMWG consensus perspectives risk factors for progression and guidelines for monitoring and management. Leukemia. 2010;24:1121–7. doi: 10.1038/leu.2010.60. [DOI] [PMC free article] [PubMed] [Google Scholar]
- 9.Eissens DN, Spanholtz J, van der Meer A, van Cranenbroek B, Dolstra H, Kwekkeboom J, Preijers FW, Joosten I. Defining early human NK cell developmental stages in primary and secondary lymphoid tissues. PLoS ONE. 2012;7:e30930. doi: 10.1371/journal.pone.0030930. [DOI] [PMC free article] [PubMed] [Google Scholar]