

SUMMARY
Fetal alcohol spectrum disorders (FASDs) are characterized by life-long changes in gene expression, neurodevelopment and behavior. What mechanisms initiate and maintain these changes are not known, but current research suggests a role for alcohol-induced epigenetic changes. In this study we assessed alterations to adult mouse brain tissue by assaying DNA cytosine methylation and small noncoding RNA (ncRNA) expression, specifically the microRNA (miRNA) and small nucleolar RNA (snoRNA) subtypes. We found long-lasting alterations in DNA methylation as a result of fetal alcohol exposure, specifically in the imprinted regions of the genome harboring ncRNAs and sequences interacting with regulatory proteins. A large number of major nodes from the identified networks, such as Pten signaling, contained transcriptional repressor CTCF-binding sites in their promoters, illustrating the functional consequences of alcohol-induced changes to DNA methylation. Next, we assessed ncRNA expression using two independent array platforms and quantitative PCR. The results identified 34 genes that are targeted by the deregulated miRNAs. Of these, four (Pten, Nmnat1, Slitrk2 and Otx2) were viewed as being crucial in the context of FASDs given their roles in the brain. Furthermore, ∼20% of the altered ncRNAs mapped to three imprinted regions (Snrpn-Ube3a, Dlk1-Dio3 and Sfmbt2) that showed differential methylation and have been previously implicated in neurodevelopmental disorders. The findings of this study help to expand on the mechanisms behind the long-lasting changes in the brain transcriptome of FASD individuals. The observed changes could contribute to the initiation and maintenance of the long-lasting effect of alcohol.
INTRODUCTION
An epigenetic mechanism brings about changes in gene expression or cellular phenotype through changes other than a change in the underlying DNA sequence. They are crucial to gene regulation at two distinct levels. The first is at the level of transcription, which is mainly accomplished by methylation of DNA (Métivier et al., 2008) and modification of histones. The second level of epigenetic control is achieved post-transcriptionally by small noncoding RNAs [ncRNAs; i.e. microRNAs (miRNAs)] and allows for the fine-tuning of gene expression (Moazed, 2009). miRNAs are key regulators of eukaryotic gene expression, acting via translational repression and mRNA decay (Friedman and Jones, 2009). Furthermore, miRNAs control the activity of more than 60% of all protein-coding genes in mammals and are involved in the regulation of most cellular processes (Fabian et al., 2010).
The two aforementioned levels of epigenetic regulation are particularly crucial during embryonic development (Howlett and Reik, 1991; Monk et al., 1987), where changes to the epigenome are tightly controlled (Howlett and Reik, 1991; Monk et al., 1987). Alcohol consumption during pregnancy results in the development of fetal alcohol spectrum disorders (FASDs) (May and Gossage, 2001). Phenotypes commonly associated with FASD include impairments in cognition, learning, executive function, judgment, attention and social adaptation (Herman et al., 2008; Jirikowic et al., 2008; Mattson et al., 1998). FASDs are relatively common in North America, affecting 2–5% of pregnancies, and have an annual cost in the tens of billions of dollars (Chudley et al., 2005; Lupton et al., 2004; May et al., 2009; Popova et al., 2011; Stade et al., 2009).
Insight into the effect of alcohol on the developing brain (Valenzuela et al., 2012) has been assessed using animal models, including rats for neuroscience based studies and the C57BL/6J (B6) strain of mice for molecular-biology-based studies. Previously, we reported that a mouse model for FASD based on voluntary maternal alcohol consumption throughout gestation resulted in offspring that showed mild developmental delay, anxiety-related traits and deficits in spatial learning (Kleiber et al., 2011). Next, we extended this model by evaluating the gene expression changes that occurred in the adult brains of C57BL/6J mice that were prenatally exposed to alcohol via maternal preference drinking (Kleiber et al., 2012). The results indicated that alcohol induces subtle but consistent changes to global gene expression. Gene enrichment analysis showed over-represented gene ontology classifications of cellular, embryonic and nervous system development. Furthermore, a number of genes identified have previously been implicated in FASD-relevant neurobehavioral phenotypes such as cognitive function, anxiety, attention deficit hyperactivity disorder and mood disorders (e.g. Otx2).
In our most recent experiments we have sought to examine how the variability seen in FASD phenotypes relates to the timing of alcohol exposure. In these experiments, mice were exposed to two acute doses of alcohol (5 g/kg body weight) at neurodevelopmental times representing the human first, second or third trimester equivalent. This method has been previously reported and induces a peak blood alcohol level of over 0.3 g/dl for 4–5 hours following injection, and is sufficient to induce neuronal apoptosis and result in FASD-related behaviors (Ikonomidou et al., 2000; Wozniak et al., 2004).
TRANSLATIONAL IMPACT.
Clinical issue
Birth defects caused by maternal consumption of alcohol during pregnancy are collectively termed fetal alcohol spectrum disorders (FASDs). Although the disorders are entirely preventable, they remain the leading cause of cognitive deficits in North America, highlighting the need to elucidate the underlying mechanisms and develop effective treatments. Studies using animal models of FASD have shed light on the effects of alcohol on the developing brain, and alcohol-induced changes in global gene expression have been reported. It has been proposed that long-term changes in the expression of specific gene modules, mediated by epigenetic mechanisms, are a key feature of FASDs, but the specific processes involved have not yet been determined.
Results
The authors of this report previously generated and characterized mouse models of FASD and observed alterations in post-natal development, adult behavior and gene expression. In this study, they sought to determine the mechanisms underlying the long-term alterations in brain gene expression following alcohol exposure during development. To this end, they examined the effects of fetal alcohol exposure on the epigenome of adult mice by assaying DNA methylation and non-coding RNA (ncRNA) expression. They observed alterations in DNA methylation and, by applying bioinformatics tools, identified the specific genomic regions affected. The changes mapped to promoters of small ncRNA molecules that are normally regulated in a parent-of-origin manner via epigenetic mechanisms. These molecules are known regulators of many genes, some of which have been previously implicated in FASD. Using array platforms and quantitative PCR, the group pinpointed 34 genes that are targeted by the deregulated ncRNA molecules, providing a suite of candidates for further analysis. Importantly, the authors demonstrate that the alterations in DNA methylation mediated by fetal alcohol exposure are long lasting.
Implications and future directions
The results of this study provoke a number of novel hypotheses and candidate molecular markers for FASD. Specifically, the study has identified key genomic regions and regulatory relationships that warrant further research and validation to uncover currently unknown functions driving the persistence of FASD into adulthood. Interestingly, the small RNA molecules implicated are known to be largely brain-specific and have been linked with a number of complex neurological disorders. Overall, the results suggest that a multistage process involving changes in DNA methylation, ncRNAs and gene expression underlies FASD and related diseases of fetal origin. Given the highly reversible nature of epigenetic markers, the newly identified markers from this work have great potential for use in FASD treatment.
In our first set of experiments we set out to examine the physiological, developmental and behavioral deficits associated with the paradigms examined (Mantha et al., 2013). The results showed that alcohol exposure at any time during gestation causes delays in motor skill and reflex development. Alcohol exposure during the trimester three equivalent seems to produce delays in most measures, followed closely by trimester two, whereas alcohol exposure at the first trimester producing subtle effects, with less than half of the milestones significantly altered. Finally, our results provided further support for deficits in learning and memory caused by prenatal alcohol exposure, as assessed by the Barnes maze.
After the battery of developmental milestones, physiological metrics and behavior work, the mice were reared to adulthood and changes to their adult brain transcriptome were assessed in a second group of experiments (Kleiber et al., 2013). The results suggested that alcohol disrupts biological processes that are actively occurring at the time of exposure. These include cell proliferation during trimester one, cell migration and differentiation during trimester two, and cellular communication and neurotransmission during trimester three. Furthermore, although alcohol altered a distinct set of genes depending on developmental timing, many of these show interrelatedness and can be associated with one another via ‘hub’ molecules and pathways.
Ultimately, the findings of our most recent experiments argue that long-term changes in the expression of specific gene modules represent the major feature of the effect of alcohol during the development of FASD. Our third set of experiments, which form the basis of this manuscript, seek to examine the mechanisms initiating and maintaining the long-term gene expression changes following fetal alcohol exposure (FAE). Currently, these mechanisms are unknown; however, recent studies by others have suggested that epigenetic alterations could underlie the effects seen in our first two sets of experiments (Govorko et al., 2012; Haycock and Ramsay, 2009; Kaminen-Ahola et al., 2010; Liu et al., 2009). Indeed, alcohol exposure during embryonic development affects the transfer of folate from the mother to the developing embryo (Hutson et al., 2012). This is of significance to the developing embryo because folate is essential in establishing and maintaining DNA methylation. The lack of folate has the potential to cause aberrant epigenetic profiles. Indeed, recent studies have observed methylation changes occurring in genes that are known to be genomically imprinted (Dietz et al., 2012; Liu et al., 2009; Shukla et al., 2011; Sittig et al., 2011). Imprinted genes are expressed in a parent-of-origin-specific manner that is based on differential methylation of an imprinting control region (ICR). Genomic imprinting acts only on a select set of genes (Laprise, 2009; Moore, 2001) that are important in early development, particularly neurodevelopment (Hager and Johnstone, 2003). These genes are crucial during neurodevelopment, as well as in the normal functioning of the brain (Davies et al., 2008). Interestingly, ∼30% of imprinted genes are hypothesized to be ncRNAs, including miRNAs (Morison et al., 2005). miRNAs have been implicated in a number of abnormalities that often show co-morbidity with FASD, including anxiety, depression and other psychiatric disorders (O’Connor et al., 2012). Approximately 11% (42/385) of examined miRNAs have been found to be differentially expressed in primary cortical neuronal cultures chronically exposed to alcohol (Guo et al., 2011). Interestingly, treatments that contain methyl group donors, such as choline (Zeisel, 2011), have been able to attenuate some of the effects of FAE. Of particular interest to this research is the observation that co-incubation of alcohol-exposed mouse embryos with folic acid, which is involved in establishing DNA methylation, was able to prevent altered expression of mir-10a and its target gene Hoxa1 (Wang et al., 2009). Such results argue that the alcohol-induced molecular cascade (Soares et al., 2012; Wang et al., 2009) might involve DNA methylation. However, the actual mechanism behind such interactions remains to be elucidated (Haycock and Ramsay, 2009; Miranda, 2012).
It is logical to hypothesize that FAE might alter DNA methylation, thus suppressing the transcriptional machinery involving a variety of transcription factors. For example, CTCF is a highly conserved ubiquitous 11-zinc-finger protein with multiple functions in chromatin organization and gene regulation, including chromatin insulator activity and transcriptional enhancement and silencing (Williams and Flavell, 2008). CTCF binds to a set of signal sequences, with this binding being sensitive to methylation (Filippova, 2008), while also having the potential to mediate long-range chromosomal interactions (Ling et al., 2006). Currently, 111,062 CTCF-binding sites in the mouse genome have been identified, with some being tissue specific and some ubiquitous (Shen et al., 2012). Indeed, CTCF-binding sites involved in the ICR of H19 and Igf2 (H19/Igf2) have shown significant differential methylation in FASD placental tissue (Haycock and Ramsay, 2009) and in the sperm of alcohol-consuming fathers (Knezovich and Ramsay, 2012). Furthermore, altered DNA methylation has the potential to directly or indirectly affect the expression of a specific set of miRNAs that could play a substantial role in maintaining long-term alterations in the gene expression.
The results presented in this report include three novel findings. First is the disruption of genome-wide DNA methylation in adult brain tissue. Second are the associated alterations in the expression of miRNAs and small nucleolar RNAs (snoRNAs). Third, we present the use of bioinformatic tools to identify specific (imprinted) genomic regions and their interactive protein, CTCF, which might initiate and maintain abnormalities caused by alcohol exposure in FASD.
RESULTS
Voluntary maternal drinking during pregnancy causes long-lasting changes to DNA methylation in resulting progeny
The first experiment in this report examines genome-wide differences in DNA methylation in the adult brain [postnatal day (PND) 70] in response to FAE by voluntary maternal drinking. It is followed by assessment of its potential biological effects as outlined below.
Global methylation changes to promoterome
Results showed that the differences across individuals representing alcohol-exposed and matched control brains, although variable, show a significant (P=0.01) effect of FAE on genome-wide DNA methylation. Upon hierarchal clustering (Fig. 1) analysis, it was observed that experimental and control mice group together according to exposure. Furthermore, the results reveal that at least 6660 promoter regions are differentially methylated as a result of FAE.
Fig. 1.
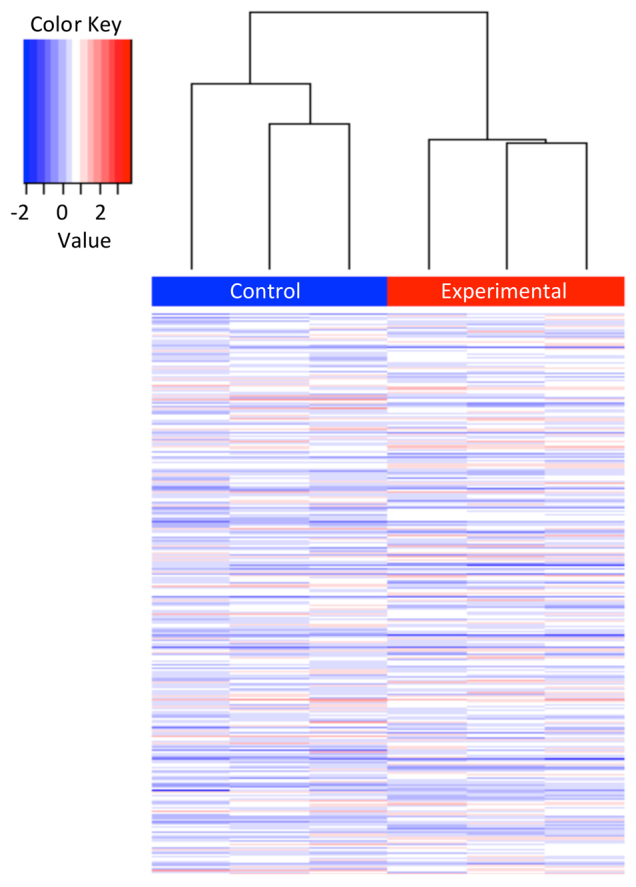
Hierarchical clustering analysis of differential DNA methylation enrichment peaks from arrays examining the effect of continuous preference drinking on B6 male brains. To compare differentially enriched regions between ethanol-exposed and control mice, the normalized log2-ratio scan values were averaged and then used to calculate the M′ value [M′=Average(log2 MeDIPE/InputE) – Average(log2 MeDIPC/InputC)] for each probe. NimbleScan sliding-window peak-finding algorithm was run on this data to find the differential enrichment peaks (DEPs).
Network analysis
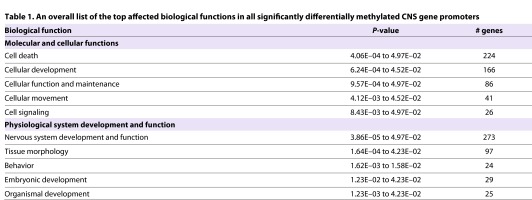
Next, we subjected the identified promoters to Ingenuity Pathway Analysis® (IPA®). This analysis revealed that a large number of genes related to cell death and nervous system development and function are significantly enriched for in fetal-alcohol-exposed brains (Table 1). Network analysis revealed that the ‘Behavior, Neurological Disease, and Psychological Disorders’ network was the most significantly affected network, with an IPA® score of 65. From this network a number of highly connected ‘hub genes’ were identified (supplementary material Fig. S1).
Table 1.
An overall list of the top affected biological functions in all significantly differentially methylated CNS gene promoters Biological function
Among the most prominent hub genes was App: its promoter is un-methylated in the treated mice. Furthermore, the promoters of a set of interacting genes (Akt1, Ghr, ApoE, Ntrk1) within this hub are also methylated following FAE. Finally, we examined the affected canonical pathways and found that the top two pathways were Cdk5 signaling (P=9.01E–7), with 47/78 molecules affected (supplementary material Fig. S2), and Pten signaling (P=1.9E–06), with 54/95 molecules affected (supplementary material Fig. S3).
Functional consequences
We then sought to examine whether the changes to DNA methylation occurred in any CTCF-binding sites. Indeed, the same region of H19/Igf2 identified by Haycock et al. also showed significant (P<0.01) differential methylation on our arrays (Fig. 2A). In addition to the H19/Igf2 locus, CTCF binds to differentially methylated regions (DMRs) at a number of other imprinted loci. One of these is the secondary DMR of Gtl2 (Meg3), which also showed significant differential methylation in a CTCF-binding site on our arrays (Fig. 2A).
Fig. 2.

The functional significance of altered CTCF-binding-site methylation after FAE. (A,B) Gene promoters (‘P’) with CTCF sites showing increased (A) and decreased (B) methylation after FAE. (C) Schematic of H19/IGF2 imprinting regulation and the effects of FAE. The black rectangle represents the H19 ICR, white lollipops represent unmethylated DNA, and black lollipops represent methylated DNA. On the wild-type locus, the ICR exhibits paternal-specific methylation and contains binding sites for CTCF. On the maternal allele, CTCF binds to the ICR and blocks the Igf2 promoter from accessing the 3′ shared enhancers (E). On the paternal allele, the ICR is methylated, and H19 transcription is repressed. Because CTCF binding is methylation sensitive, the ICR cannot act as an insulator on the paternal allele, allowing Igf2 expression to be driven from the enhancer. Our results suggest that, in the case of FAE, imprinting is deregulated owing to increased methylation in the CTCF-binding site, which causes the maternal allele to exhibit paternal imprinting marks.
Next, we sought to examine whether any of the 30 significantly differentially methylated peaks belonging to different regions of the promoters of major nodes from the ‘Behavior, Neurological Disease, and Psychological Disorders’ network (supplementary material Fig. S1) contained CTCF-binding sites (Bao et al., 2008). Of these 30 regions, 12 (40%) showed sequences that were strongly predicted to be CTCF-binding motifs (Fig. 2A,B). Eight of these promoter regions showed increased methylation and four showed decreased methylation. These genes of interest were then subjected to an independent pathway analysis using GeneMANIA (Warde-Farley et al., 2010), with the results supporting those of IPA® (Fig. 3). However, we note that other methylation-sensitive transcription factors and/or insulators are likely to be involved in the altered transcriptomics resulting from FAE.
Fig. 3.

Gene Mania network analysis of significantly differentially methylated genes containing CTCF-binding sites, from the ‘Behavior, Neurological Disease, and Psychological Disorders’ network.
Both voluntary chronic exposure and binge injections at different developmental time points cause long-lasting changes in miRNA and gene expression
The second set of experiments in this report identifies differences in ncRNA and gene expression. We assessed the effect of ethanol via voluntary maternal drinking on the transcripts in the brains of the resulting adult (PND 70) progeny. Furthermore, we also examined binge FAE (injection) at first (T1), second (T2) and third (T3) trimester equivalents of human development in order to confirm and expand on the results.
Prenatal ethanol causes changes in the adult brain miRNome
The results from mouse miRNA arrays show that FAE resulted in changes to global miRNA expression. The effect of each treatment paradigm was relatively consistent between biological replicates. Consequently, alcohol-treated and matched control expression patterns consistently group together when hierarchically clustered (Fig. 4).
Fig. 4.

Heat maps of miRNA expression generated using hierarchical clustering of the four FAE paradigms. Trimester 1 injection model, trimester 2 injection model, trimester 3 injection model and continuous preference drinking model (ANOVA P-value of 0.05 and minimum 1.2-fold cut-off).
Furthermore, the pattern of expression between alcohol-exposed and matched control brains is quite distinct. We note that the miRNAs that were affected were specific to the developmental timing of alcohol treatment (Fig. 5). Here, the treatment during T1, T2 or T3 resulted in the unique expression for 21/24 (88%), 38/45 (84%) and 60/68 (88%) of the affected miRNAs for each of the three trimesters, respectively. This number for the voluntary consumption [continuous preference drinking (CPD)] paradigm was also comparable [28/32 (88%)].
Fig. 5.
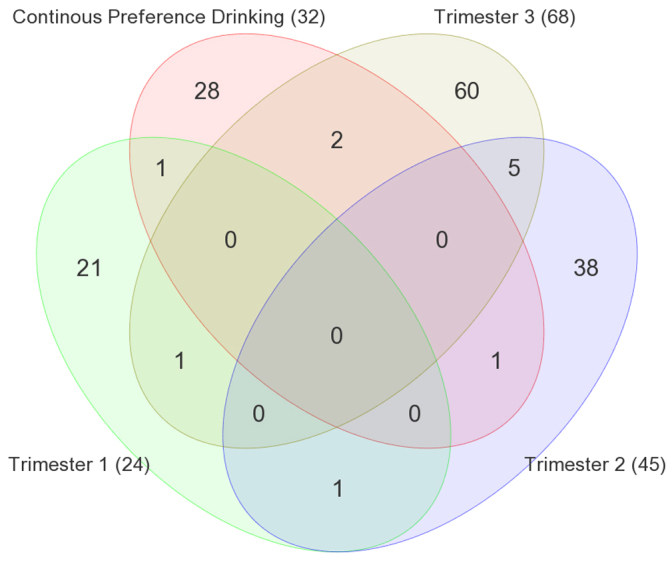
Venn diagram of common and unique differentially expressed miRNAs identified by four FAE models. Continuous preference drinking; trimester 1, binge treatment at GD8 and GD11; trimester 2, binge treatment at GD14 and GD16; trimester 3, binge treatment at PD4 and PD7. (ANOVA P-value of 0.05 and minimum 1.2-fold cut-off.)
miRNA and target gene alterations upon FAE via voluntary maternal consumption
Next, we used Ingenuity’s miRNA Target Filter® to analyze all possible miRNA and target-gene interactions from the miRNA and gene expression array data sets for the voluntary maternal consumption paradigm. The results were filtered based on the confidence of interaction, brain specificity, and an inverse miRNA to target mRNA relationship (supplementary material Table S1). Overall, 34 genes from the gene expression arrays showed inverse pairwise relationships with 1–13 miRNAs from the miRNA expression arrays that were predicted to target them.
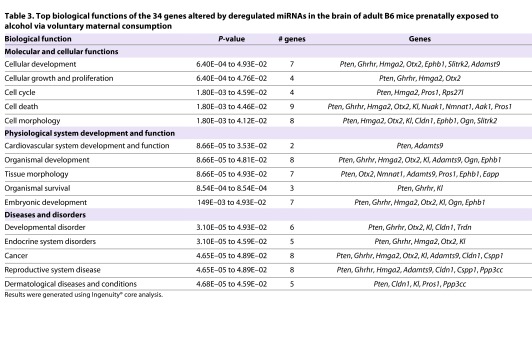
Of the 34 identified target genes, four (Pten, Nmnat1, Slitrk2 and Otx2) are of particular interest in the context of FASD, owing to their roles in the brain (Table 2), as discussed later. Next, we subjected the 34 genes to IPA®. The analysis revealed a number of fundamental biological processes that were significantly affected, including: a role for seven molecules in cellular development, a role for seven molecules in embryonic development and a role for six molecules in developmental disorders (Table 3). The four genes of interest (Pten, Nmnat1, Slitrk2 and Otx2) are significant players in these pathways, which suggests a newly identified role for these genes in FASD.
Table 2.
Top four genes and associated miRNAs identified by Ingenuity® miRNA target filter analysis in the maternal voluntary consumption B6 mouse model
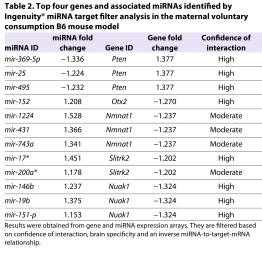
Table 3.
Top biological functions of the 34 genes altered by deregulated miRNAs in the brain of adult B6 mice prenatally exposed to alcohol via voluntary maternal consumption
Confirmation experiments
We then sought to confirm the results observed on the two independent array platforms by quantitative PCR (qPCR). Although the results showed similar fold changes to the arrays for all genes of interest examined (Pten, Nmnat1, Slitrk2 and Otx2), they were not statistically significant (P=0.122, P=0.129, P=0.452 and P=0.078, respectively).
However, given the current technological limitations of qPCR (see Discussion), we sought other avenues of confirmation for the miRNA arrays. In subsequent experiments we used an independent platform (Affymetrix mouse gene 1.0 ST expression arrays) for three of the four paradigms, because the gene expression arrays also contained different probes for both mouse-specific snoRNAs and some miRNAs. The results showed that a large number of ncRNAs are similarly affected on the two (miRNA and gene expression) arrays. For example, the MBII-52 snoRNA, belonging to Snrpn-Ube3a, is upregulated, whereas MBII-85 and snoRNA genes from the Dlk1-Dio3 region are downregulated.
Despite difficulties with confirming gene expression, we were able to validate the results of miRNA arrays of the voluntary consumption model by qPCR. mir-679-5p, which is located in the Dlk1-Dio3 region, showed a 1.45-fold increase (P=0.019) in mice that were treated with ethanol during neurodevelopment via maternal voluntary drinking (Fig. 6). The results provide support for the two independent (miRNA and gene expression) array platforms that showed 1.21 (P=0.03)- and 1.41 (P=0.04)-fold increases, respectively. Ultimately, these results suggest that the long-term changes in ncRNA expression following FAE are subtle and treatment specific, with the exception of MBII-52, and must be interpreted with caution given current technological limitations.
Fig. 6.
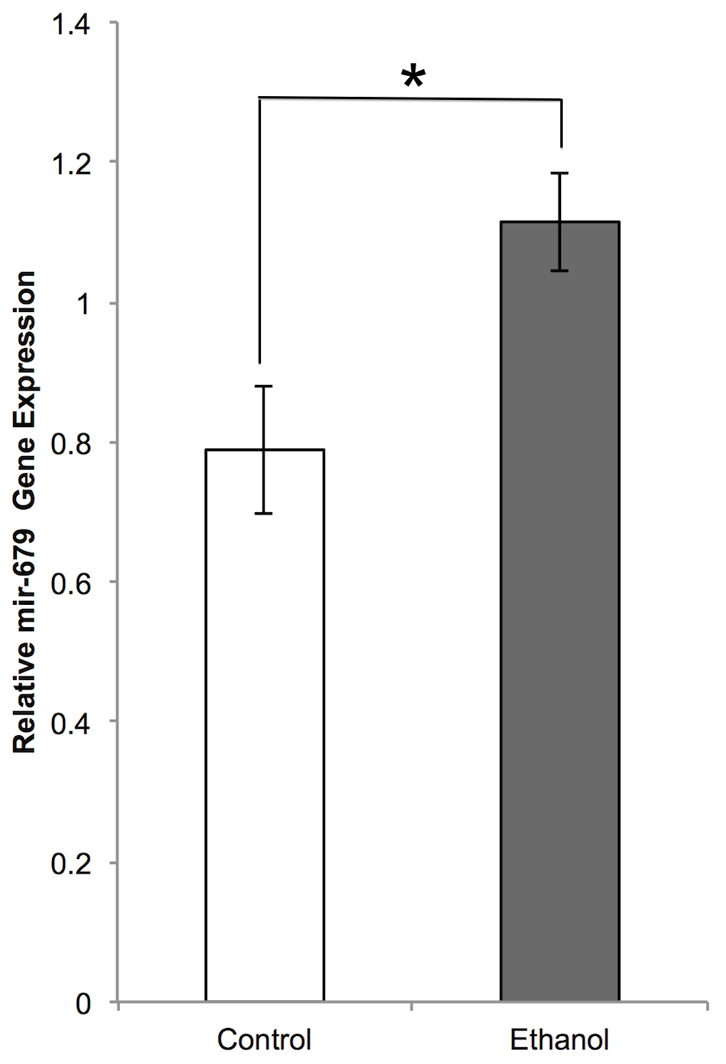
A bar graph depicting the quantitation of mmu-mir-679-5p expression in control and fetal alcohol-exposed (CPD) adult brains. The y-axis depicts the relative mir-679 expression normalized to snoRNA 202, expressed as a mean ± s.e.m. of both biological (n=6) and technical (n=3) replicates. *P<0.05.
Bioinformatic investigation of the interactions between epigenome and genome
The third set of experiments in this report examines the correlation between all three array-based assays using bioinformatic tools in order to generate a number of novel hypotheses.
Alterations in DNA methylation partially correlate to altered expression in the voluntary consumption model
First, we assessed the observed differential methylation of the promoters in relation to the altered expression of protein-coding transcripts (129) and miRNAs (33) in alcohol-exposed brains and their matched controls. A total of 16% (21/129) of the transcripts and 18% (6/33) of the miRNAs that showed significant (P<0.05) differential expression (fold change >±1.2) on the expression arrays also showed significant (P=0.01) differential methylation in their promoters (supplementary material Table S2). Furthermore, 50 of ∼100 known imprinted genes in the mouse genome and 28 imprinted miRNAs from the Dlk1-Dio3 region of chromosome 12 showed changes in methylation following FAE (supplementary material Table S3).
Genomic mapping of altered miRNA genes in all models
Finally, we mapped the altered miRNAs from the four exposure paradigms to chromosomal regions on the mouse genome. We also assessed them in relation to the mouse imprinting catalog (http://www.mousebook.org/catalog.php?catalog=imprinting). Interestingly, 8/32 (25%) of identified miRNA transcripts in the voluntary consumption treatment paradigm, 2/24 (8%) in the T1 paradigm, 13/45 (29%) in the T2 paradigm and 13/68 (19%) in the T3 paradigm mapped to three known imprinted regions of the mouse genome. The genomic locations include the Sfmbt2 region of mouse chromosome 2, the Snrpn-Ube3a region of chromosome 7 and the Dik1-Dio3 region of chromosome 12.
DISCUSSION
By their very nature the results included in this report offer advantages as well as limitations. Among the limitations are the resolution of molecular observations that are subtle and the complexity of our animal model. Indeed, a lack of statistically significant qPCR results casts reasonable doubts on the expression array results and suggests that some of the results are false positives and that there are a number of variables that must also be considered. First, we note that, although qPCR is the gold standard of confirming gene expression changes, the current technology contains a vital limitation related to experiments of this nature. Specifically, it is not sensitive enough to accurately detect low, but statistically significant, fold changes (<2.0) (Peirson and Butler, 2007; Vikalo et al., 2010) that are typical of the fine-tuning nature of miRNAs (Moazed, 2009). Second, we note that most results followed the same trend, up or down, similar to the array results. Finally, the aforementioned results might also represent the heterogeneous nature of whole brain tissue (Ernst et al., 2007; Soverchia et al., 2005; Sun et al., 2012) and the timing and dosage of FAE. These factors create the potential for a large amount of biological variation within the treatment groups that is not considered in the statistics. Thus, instead of relying on qPCR, our interpretation takes a different approach and is based on our observations from multiple exposure paradigms and multiple independent array technologies. Consequently, we leave the interpretation of these results to the reader by discussing both the strengths and weaknesses of the data sets presented.
However, we note that our results follow those of Wang et al., who also observed an alteration to mir-10b in fetal brains exposed to alcohol (Wang et al., 2009). Indeed, the pathways and genes identified in this report do not represent a random sample. Rather, they are significantly enriched for FASD-related endophenotypes. Finally, we also acknowledge that it is not easy to establish a one-to-one relationship between a miRNA and a gene because hundreds of miRNAs can regulate a single gene and a single miRNA can regulate hundreds of genes (Bartel, 2009; Mukherji et al., 2011); thus, our current understanding of the relationship between miRNAs and genes is still in its infancy.
With respect to experimental complexity and interpretation, it is worth noting that the results are on an animal model and not on humans. Also, there are limitations in matching the exact dose of alcohol in the two types of alcohol treatments, maternal preference drinking during pregnancy and injection of pups. Given that the mothers in the voluntary consumption paradigm had continuous (24 hour) access to ethanol and water, we did not assess blood alcohol concentration (BAC), owing to variations in consumption patterns between females and to avoid additional stress to pregnant dams related to blood-taking procedures (Kleiber et al., 2012). Although the precise BACs reached were unknown, pregnant females in this study consumed comparable volumes of alcohol (results not shown) to other continuous consumption models that produced peak blood alcohol concentrations of ∼80–120 mg/dl per day (Middaugh et al., 2003). Furthermore, other maternal consumption models with varying degrees of alcohol access have shown that pregnant B6 females will typically consume enough alcohol to reach pharmacologically significant BACs (Allan et al., 2003; Boehm et al., 2008; Caldwell et al., 2008), representing continuous moderate exposure with daily punctuated peaks high enough to result in significant neurocellular damage (Young and Olney, 2006b). This is also supported by the subtle but consistent behavioral changes we have observed in FAE offspring in our previous studies.
Finally, the data analysis is based on the effects of alcohol exposure at different stages of neurodevelopment rather than acting as an assessment of any dose response. Regardless of the potential for differences in blood alcohol levels achieved within and between the paradigms, the results obtained using these mouse models serve as an effective means to examine the long-term consequences of FAE to the developing brain at distinct time points (Clancy et al., 2001; Rice and Barone, 2000). Indeed, despite the aforementioned limitations, this research still advances the understanding of FASD because previous research into FASD has focused on cell lines, which are not appropriate for epigenetic experimentation, specifically in the case of genomic imprinting (Velker et al., 2012), and prior in vivo studies into the epigenetics of FASD have focused on whole embryo tissue (Liu et al., 2009). Ultimately, given these facts, we believe that our observations on adult whole-brain tissue are a substantial contribution to the literature and will help to focus future research into specific brain regions using the biomarkers identified.
Global changes to DNA methylation and related functional consequences
The results included in this report identify that prenatal alcohol causes significant changes in DNA methylation in the developing brain that lasts to adulthood (Fig. 1). It covers a relatively large number (∼6600) of gene promoters that are related to molecular, functional and phenotypic abnormalities implicated in FASD (Table 1). The most significant network identified (score 65) is that of ‘Behavior, Neurological Disease, and Psychological Disorders’, which has a distinct set of ‘hub genes’. Among the most prominent hub genes affected is App (amyloid precursor protein), which is a protein that helps direct the migration of neurons during early development (Priller et al., 2006). Interestingly, these results are backed by the literature (Liu et al., 2009) and argue that the crucial gene hubs (Akt1, Ghr, ApoE, Ntrk1) identified here (see Results) have the potential to play a crucial role in the manifestation of FASD-related effects. Such results support the relevance of the observed ethanol-induced gene methylation changes in FASD.
The results at hand also allow us to hypothesize on the potential mechanisms that could underlie the biological consequences. We argue that an alteration in promoter methylation might interfere with transcriptional machinery as demonstrated by the role of differential methylation of the H19 promoter (Hark et al., 2000). Interestingly, we also identified an identical methylation peak in the H19 promoter (Fig. 2A) that is involved in CTCF binding and imprinting (Lin et al., 2011). This specific peak has previously been identified as showing significant differential methylation in FASD placental tissue (Haycock and Ramsay, 2009). Logistically, CTCF binds to the H19/Igf2 ICR in a DNA-methylation-sensitive manner and mediates the insulator activity of the unmethylated maternal ICR by blocking the Igf2 promoter from engaging enhancers downstream of H19 that are shared by H19 and Igf2 (Fig. 2C) (Hark et al., 2000). The deletion or mutation of the four CTCF-binding sites within the ICR causes a paternalization of the maternal allele, Igf2 biallelic expression and H19 repression (Engel et al., 2006).
In addition to the H19 locus, CTCF binds to DMRs at a number of imprinted loci. One of these is the secondary DMR of Gtl2 (Meg3) (Nowak et al., 2011), which also showed differential methylation at a CTCF-binding site. Given the role of CTCF in these two important genes implicated in FASD, we sought to examine whether other important genes that were affected shared this regulatory motif in their promoters. From the ‘Behavior, Neurological Disease, and Psychological Disorders’ network, 30 significantly differentially methylated peaks were examined for CTCF-binding sites using the CTCFBS prediction tool (Bao et al., 2008). Of these 30 regions, 12 (40%) showed sequences that represented predicted CTCF-binding motifs (Fig. 2A,B). Eight of these promoter regions showed increased methylation and four showed decreased methylation. Among the most prominent hub genes was App, which is a protein that helps direct the migration of neurons during early development (Priller et al., 2006). Here, its promoter is unmethylated in the treated mice. Furthermore, the promoters of a set of interacting genes (Akt1, Ghr, ApoE, Ntrk1) within this hub are also methylated following FAE. These results on H19 and App follow previous research (Liu et al., 2009). However, our research is the first to expand on such genes and show these changes in adult brain tissue long after FAE. The 12 genes identified were then subjected to a pathway analysis (Fig. 3) using GeneMANIA (Warde-Farley et al., 2010), with the results supporting those of IPA (supplementary material Fig. S1).
Global and specific changes in ncRNA expression
The results of this report also show that FAE affects ncRNA expression in the adult brain (Fig. 4). It is seen in binge injection models as well as the voluntary maternal consumption model [labeled in Figs 4 and 5 as continuous preference drinking (CPD)]. These results suggest that the long-term changes in miRNA expression are dependent on the treatment paradigm (Fig. 5).
The exception to this pattern is the MBII-52-specific snoRNA expression, which is affected regardless of the timing of exposure (supplementary material Table S4). Furthermore, in the case of the voluntary maternal consumption paradigm (and possibly the three binge paradigms), FAE is associated with global changes to DNA methylation. These results expand on our hypothesis that a complex residual ‘footprint’ of FAE exists long after exposure (Kleiber et al., 2012).
A large number of studies suggest that the observed alterations in the brain transcriptome (including the miRNome) that follow FAE have a number of possible explanations. First, neuroscience-based brain-imaging studies suggest that they might reflect the result of selective cell death (apoptosis) that changes the proportions of different cell types in the developing brain (Archibald et al., 2001; Autti-Rämö et al., 2002; Gil-Mohapel et al., 2010; Ikonomidou et al., 2000; Klintsova et al., 2007). The elimination of susceptible cell types would result in an altered cellular composition, leading to a distorted transcriptome (which includes the miRNome) (Kleiber et al., 2011). However, although even low blood-alcohol levels can trigger apoptosis in the developing brain (Young and Olney, 2006a), FASD-related behaviors are commonly observed in individuals with no obvious brain abnormalities (Mattson and Riley, 1998; Spadoni et al., 2007), which suggests that a reduction in brain cell populations probably does not account for all the variation in FASD endophenotypes.
A second explanation, put forth by molecular biologists, is that epigenetic modifications could be directly affected by alcohol, given that alcohol is known to affect the biochemical pathway of one-carbon metabolism, which is involved in establishing and maintaining epigenetic marks (Haycock and Ramsay, 2009). Such modifications might include DNA methylation and ncRNAs, which subsequently affect gene expression, and form the focus of this report.
Third, and perhaps most likely, is that the observed changes could result from some combination of the aforementioned two mechanisms. If the changes in DNA methylation and ncRNAs are involved in alteration of gene expression (Kleiber et al., 2012), they must begin early, at the time of FAE. Such changes will be established early, with the marks being passed on through successive cell divisions and accounting for long-term effects. The results included in this report expand on epigenetic studies carried out by molecular biologists in the past decade (Haycock and Ramsay, 2009; Miranda, 2011), while relying on the fundamentals provided by neuroscientists over the past 40 years (Berman and Hannigan, 2000; Mattson et al., 2011).
Biological consequences of the observed epigenetic changes
Because we examined gene expression, miRNA expression and DNA methylation in a single treatment paradigm [voluntary maternal consumption (CPD)], we were able to examine for any relationships among these three observations. Interestingly, 34 genes, from the gene expression arrays, showed 104 inverse pairwise relationships with 1–13 (31 total) miRNAs, from the miRNA expression arrays, which were predicted to target them (supplementary material Table S1). Of the 34 genes identified by the miRNA target filter, four (Pten, Nmnat1, Slitrk2 and Otx2) are of special interest in the context of FASD because of their roles in the brain (Table 3).
The first, Pten, was upregulated (1.38-fold change and P=2.5E–03) and the three miRNAs (mir-369-5p, mir-25 and mir-495) predicted to target it were downregulated, with mir-369-5p belonging to the Dlk1-Dio3 cluster (Fig. 7). Additionally, 57% of the molecules involved in the Pten signaling pathway showed significant (P=1.9E–06) differential methylation (supplementary material Fig. S3). Pten functions as a lipid phosphatase that counteracts the kinase function of phosphatidylinositol-3-kinase (Pi3k) and suppresses Akt activation (Maehama and Dixon, 1998). Akt, which showed a gain of methylation at a predicted CTCF-binding site (Fig. 2A), is a major mediator of signaling pathways in response to a large spectrum of extracellular stimuli. Upon its activation in neurons, Akt phosphorylates different substrates, which in turn regulate diverse processes of neuronal development, including morphogenesis, dendritic development, synapse formation and synaptic plasticity (Yoshimura et al., 2006), all of which are altered in FASD. Studies in mice, with a targeted inactivation of Pten in differentiated neurons, showed abnormal social interaction and exaggerated responses to sensory stimuli (Kwon et al., 2006). Given the integral role of Pten in neurodevelopment, it is no surprise that it has been implicated in the developmental basis of many major psychiatric disorders (Kim et al., 2009) and now FASD.
Fig. 7.

Summary of select observed epigenetic associations. White lollipops indicate an absence of DNA cytosine methylation, whereas black lollipops indicate its presence. Green arrows indicate an increase of either methylation or expression, whereas red arrows indicate a decrease.
The second gene of interest is Nmnat1, which was downregulated (–1.24-fold change and P=0.01), whereas its three predicted target miRNAs (mir-1224, mir-431 and mir-743a) were upregulated (Fig. 7). Nmnat1 protects against axonal degeneration following mechanical or toxic insults by delaying axonal degeneration (Sasaki et al., 2006). More recent results support its role in protection of key brain structures, such as the hippocampus, that are affected in FASD (Verghese et al., 2011). The third gene of interest (Slitrk2) was downregulated (–1.20-fold change and P=2.15E–04), whereas two of its predicted miRNAs (mir-17* and mir-200a*) were upregulated. Significant expression of Slitrk2 is detected only in the adult brain (Aruga and Mikoshiba, 2003). Furthermore, Slitrk2 is uniquely expressed in immature neurons, and has an inhibitory effect on neurite outgrowth. Finally, Otx2 was downregulated (–1.27-fold change and P=0.02) along with one of its predicted miRNAs (mir-152) being upregulated (Fig. 7). Otx2 is expressed in the brain, is involved in mood disorders (Acampora et al., 1995; Sabunciyan et al., 2007) and was identified in our previous study on long-term brain gene expression changes in FASD (Kleiber et al., 2012).
On the basis of these results, we hypothesize that altered expression in a set of crucial genes with potential to contribute to the FASD endophenotypes (Fig. 7) following FAE involves transcriptional (methylation) as well as post-transcriptional (miRNA) regulation. Furthermore, the similarity and variability in the manifestation of FASD could be attributed to the common (MBII-52) and different ncRNAs and genes affected as a result of variability in exposure.
Genomic loci of interest
We have also observed that ∼20% of the ncRNAs affected are encoded by one of the three imprinted regions of the mouse genome: the Sfmbt2 (murine 2qA1), Snrpn-Ube3a (murine 7qC/human 15q11-q13) and Dlk1-Dio3 (murine 12qF1/human 14q32.2) regions, which also showed differential methylation in a number of regulatory sites (supplementary material Table S5). We have recently written an in-depth review on these regions (Laufer and Singh, 2012); however, here we will provide a brief description.
The murine Sfmbt2 region contains developmentally regulated neuron-specific transcripts and has a large cluster of miRNAs (Kagami et al., 2008). Snrpn-Ube3a expresses a neuron-specific polycistronic transcript that includes two clusters of snoRNAs, HB/MBII-52 and HB/MBII-85 (supplementary material Table S4) (de los Santos et al., 2000; Le Meur et al., 2005; Runte et al., 2001). The Dlk1-Dio3 locus expresses over 40 miRNAs contained in two clusters, including a cluster of snoRNAs that contains SNORD113 and SNORD114 (supplementary material Table S6) (Seitz et al., 2004). The ncRNAs from Snrpn-Ube3a and Dlk1-Dio3 are expressed in embryo, placenta and in the adult, in which their expression is confined mostly to the brain (Seitz et al., 2004). The Snrpn-Ube3a and Dlk1-Dio3 regions have also been associated with several neurodevelopmental disorders (Leung et al., 2009). Furthermore, all three of the ncRNA clusters are transcribed as a single polycistronic unit (Fiore et al., 2009; Le Meur et al., 2005; Wang et al., 2011) with all transcripts showing similar levels of expression, and differ only as a result of unequal stability (Seitz et al., 2004). This suggests that neurodevelopmental alcohol exposure might alter the regulation of not only individual miRNAs or snoRNAs, but entire clusters of co-regulated ncRNAs. More importantly, this process could involve differences in DNA methylation. Although we found differential methylation in these regions, specific experiments will be needed to establish their significance. Our methylation array results follow those of Liu et al., who have reported that FAE causes differential methylation in Ube3a, which is located in the Snrpn-Ube3a region (Liu et al., 2009).
The Sfmbt2, Snrpn-Ube3a and Dik1-Dio3 regions are of special interest to FASD because they are also known to affect a range of endophenotypes seen in FASD. These include impaired growth, craniofacial abnormalities, and a range of cognitive and behavioral deficits (May and Gossage, 2001). Maternal disomy of the Sfmbt2 region results in fetal and placental growth retardation, whereas paternal disomy was shown to result in normal fetal growth and placental overgrowth (Kuzmin et al., 2008). Also, the Snrpn-Ube3a locus is involved in the classic sister imprinting disorders Prader-Willi syndrome (OMIM: 176270) and Angelman syndrome (OMIM: 105830), both of which display developmental delay and deficits in cognitive function (Knoll et al., 1989; Wagstaff et al., 1992). Interestingly, H/MBII-52 and H/MBII-85, which we found to show altered expression as a result of FAE, are believed to be key players in these disorders (Cassidy et al., 2000; Ding et al., 2008; Skryabin et al., 2007). Furthermore, overexpression of MBII-52, in a paternal duplication mouse model, shows poor social interaction, behavioral inflexibility, abnormal ultrasonic vocalizations, and anxiety (Nakatani et al., 2009). Ultimately, given our observance of upregulated MBII-52 in all four paradigms examined, the confirmation of results across two independent array technologies, and the strikingly similar endophenotypes associated with alterations to it, we believe that MBII-52 serves as an ideal candidate for future research into FASD.
Our results also show that the Snrpn-Ube3a region is not the only brain-specific imprinted region affected by alcohol exposure during development. Indeed, altering the dosage of the imprinted genes at the Dlk1-Dio3 region has also been shown to cause a range of endophenotypes, from growth deficiencies and developmental defects in the embryo and placenta, to defects in adult metabolism and brain function (da Rocha et al., 2008). It has also recently been shown in a rat model that FAE alters the expression of Dio3 in the hippocampus, as well as altering related behaviors and physiology (Dietz et al., 2012; Sittig et al., 2011). In the case of our research, mir-369-5p, which is predicted to target Pten (both of which were deregulated in this study), also belongs to this imprinted cluster. Given the role of Pten in the brain, it comes as no surprise that alterations to the miRNAs in this cluster could have such profound effects in the brain (Fig. 7).
In conclusion, we report selective alterations in DNA methylation and miRNA expression in adults that were exposed to alcohol during neurodevelopment. The results show that the genes affected as a result of neurodevelopmental alcohol exposure are long lasting and do not represent a random sample. They represent genes involved in genomic imprinting and for which alterations of gene expression have been implicated in endophenotypes related to FASDs. Such observations, being reported for the first time in adult brain following FAE, add support to a role for epigenetic alterations in FASD, while also identifying a number of important biomarkers that warrant future research.
MATERIALS AND METHODS
Mice
Male and female C57BL/6J (B6) mice were originally obtained from Jackson Laboratories (Bar Harbor, ME) and maintained at the Health Sciences Animal Care Facility at the University of Western Ontario (London, Ontario, Canada). The Animal Use Subcommittee of the University of Western Ontario approved all procedures undertaken on the animals. B6 mice were housed in standard cages at 21–24°C with 40–60% humidity at a 14-hour light/10-hour dark cycle with access to food and water ad libitum. Virgin females of ∼8 weeks of age were time-mated and assessed for pregnancy using the presence of vaginal plugs [gestational day (GD) 0]. From conception (GD0) until weaning at postnatal day (PD) 21, the pups were housed in individual cages with their mothers.
Alcohol treatment
Alcohol treatment by injections (trimester 1, trimester 2 and trimester 3)
Pregnant dams were subcutaneously injected with two 2.5 g/kg body weight doses of ethanol in 0.15 M saline (alcohol-treated) spaced 2 hours apart (at 0 hours and 2 hours), or with saline alone (control), at GD8 and GD11 (trimester 1) or GD14 and GD16 (trimester 2) (Ikonomidou et al., 2000). Control and alcohol-treated dams were age- and weight-matched. Given that the third trimester human equivalent occurs postnatally in mice (Dobbing and Sands, 1979), a binge exposure during this neurodevelopmental period was modeled by treating pups directly on PD4 and PD7 via subcutaneous injection (trimester 3). In this model, pups from one litter were matched across treatment groups for sex and weight to control for litter effects. Injections represented two doses of 2.5 g/kg body weight spaced 2 hours apart with matched controls receiving 0.15 M saline. All resulting offspring were weaned on PD21 and housed in cages with two to four same-sex littermates.
Alcohol exposure by CPD
Pregnant females were placed in individual cages, given free access to 10% ethanol and water for 2 weeks to establish a stable drinking pattern, then time-mated and provided both ethanol and water from GD0 to PD10 as described previously (Kleiber et al., 2011). Control dams had access to water only. Voluntary maternal alcohol consumption was measured daily from GD0 to PD10, and females drinking less than 2 ml of alcohol per day were excluded from the study. Resulting pups, both alcohol-exposed and matched controls, were weaned at PD21 and housed in same-sex colony cages of two to four mice.
Tissue collections and nucleic acid isolation
Alcohol-treated and matched control adult males (PD70) resulting from the four treatment paradigms (n=12 per paradigm with six alcohol-exposed and six matched controls) were sacrificed using CO2 and cervical dislocation. Whole brains were extracted, snap frozen in liquid nitrogen, and stored at −80°C until RNA and DNA isolation. Whole-brain total RNA was isolated from frozen tissues using TRIzol® Reagent (Invitrogen, Carlsbad, CA), purified using the RNeasy® Mini Kit (QIAGEN, Valencia, CA), and quantified using a NanoDrop ND-1000 spectrophotometer (Thermo Fisher Scientific Inc., Wilmington, DE). Total RNA quality was assessed using the Agilent 2001 Bioanalyzer (Agilent Technologies Inc., Palo Alto, CA). Further, whole brain DNA was isolated from the interphase layer of TRIzol using sodium citrate, followed by ethanol precipitation and purification using the QIAamp® DNA Micro Kit (QIAGEN, Valencia, CA). DNA was then quantified using a NanoDrop ND-1000 spectrophotometer (Thermo Fisher Scientific Inc., Wilmington, DE) and all samples had OD260/OD280 nm ratios of 1.8–2.0 and OD260/OD230 nm ratios of 2.0–2.4.
miRNA expression analysis
Equal amounts of total RNA from non-littermate males (three for the injection models and two for the CPD model) were pooled per biological replicate to reduce litter effects, with no litter contributing more than one individual. Two biological replicates (arrays) were used for each injection model, and three for the voluntary maternal drinking (CPD) model. All sample labeling, hybridization and GeneChip processing was performed at the London Regional Genomics Centre (Robarts Research Institute, London, Ontario, Canada). Briefly, 1 μg total RNA from each treatment paradigm was labeled using the Flash Tag Biotin HSR kit (Genisphere, Hatfield, PA) and hybridized to Affymetrix miRNA 2.0 arrays for 16 hours at 45°C. Probe level (.CEL file) data was generated using Affymetrix Command Console v1.1. Probes were summarized to gene level data in Partek Genomics Suite v6.6 (Partek Inc., St Louis, MO) by using the RMA algorithm (Irizarry et al., 2003). Partek software was used to determine differences between control and ethanol-treated samples using one-way ANOVA and corresponding P-values and fold changes. For each treatment model, the miRNAs present on this array were filtered using stringency criteria of 1.2-fold change (P=0.05). The selected miRNAs were subjected to a hierarchical clustering analysis by using Euclidean distance and average linkage to assess consistency in ethanol response between the arrays of different treatment paradigms. Furthermore, the chromosomal locations for all miRNAs were determined by using miRBase and Ensembl (Flicek et al., 2011; Kozomara and Griffiths-Jones, 2011). The miRNA expression array results for all treatment protocols were deposited within the NCBI Gene Expression Omnibus (GEO) database under accession GSE34413.
Expression array hybridization
Single-stranded complementary DNA (sscDNA) was prepared from 200 ng of total RNA as per the Ambion WT Expression Kit for Affymetrix GeneChip Whole Transcript WT Expression Arrays (Applied Biosystems, Carlsbad, CA) and the Affymetrix GeneChip WT Terminal Labeling kit and Hybridization User Manual (Affymetrix, Santa Clara, CA). Total RNA was first converted to complementary DNA (cDNA) and followed by in vitro transcription to make cRNA. Subsequently, 5.5 μg of sscDNA was synthesized, end-labeled and hybridized for 16 hours at 45°C to Mouse Gene 1.0 ST arrays (Affymetrix, Santa Clara, CA). GeneChip Fluidics Station 450 performed all liquid handling steps, and GeneChips were scanned with the GeneChip Scanner 3000 7G using the Command Console v1.1 (Affymetrix, Santa Clara, CA). All hybridizations were performed by the London Regional Genomics Center at the Robarts Research Institute, University of Western Ontario. Probe level (.CEL file) data were generated using the Affymetrix Command Console v1.1. Probes were summarized to gene level data in Partek Genomics Suite v6.5 (Partek Inc., St Louis, MO) by quantile normalization using the RMA algorithm adjusted for GC content (Irizarry et al., 2003) and log2-transformed. Partek software was used to determine gene level ANOVA P-values and fold changes using a Chi-square test. All arrays were analyzed by using a 1.2-fold cut-off with a significance threshold of P=0.05. The gene expression array results for the trimester 1, trimester 3 and CPD protocols were deposited within the NCBI GEO database under accessions GSE34469, GSE34549 and GSE34305, respectively (trimester 2 gene expression data was not available).
Quantitative PCR validation of mir-679-5p
cDNA was reverse transcribed from 1 μg of RNA from the voluntary maternal consumption paradigm (n=6) and matched controls (n=6) using the Applied Biosystems TaqMan™ MicroRNA Reverse Transcription Kit (Foster City, CA) and sequence-specific stem-loop reverse transcription primers from TaqMan™ MicroRNA Assays (Foster City, CA) according to the manufacturer’s protocol. All qPCR primers and miRNA-specific TaqMan™ probes were selected by using the Applied Biosystems (Carlsbad, CA) search engine to identify previously characterized TaqMan™ MicroRNA Assays. snoRNA 202 was chosen as an endogenous control (Gao et al., 2010). The target and control reactions were run in separate tubes on the same plate for each sample as per the manufacturer’s protocol. Three technical replicates were averaged for both the endogenous control and gene of interest for each sample. qPCR reactions were performed on the Applied Biosystems StepOne™ Real-Time PCR System 2.0 according to the manufacturer’s protocol. Fold change was calculated using the ΔΔCt method (Schmittgen and Livak, 2008) and statistically analyzed using Applied Biosystems DataAssist™ Software v3.0. Statistical significance was assessed by an unpaired Student’s t-test.
miRNA target filter and pathway analysis
Data from the voluntary maternal consumption paradigm was analyzed through the use of Ingenuity® microRNA target filter [Ingenuity® Systems (www.ingenuity.com)] to generate lists of interactions between genes and miRNAs of interest. Results were filtered based on a moderate or high confidence of interaction (Lewis et al., 2005; Vergoulis et al., 2012), brain specificity, and an inverse miRNA to target mRNA expression relationship. The identified genes were then subjected to Ingenuity® Pathway Analysis.
Assessing DNA methylation by MeDIP-chip analysis
Equal amounts of brain DNA from two non-littermate males from the voluntary maternal consumption paradigm were pooled per biological replicate (n=3) to reduce litter effects. All methylated DNA immunoprecipitation (MeDIP), sample labeling, hybridization and processing was performed at the Arraystar Inc. (Rockville, MD). Briefly, genomic DNA was sonicated to 200- to 1000-bp fragments followed by immunoprecipitation of methylated DNA using Biomag™ magnetic beads coupled to mouse monoclonal antibody against 5-methylcytidine. The immunoprecipitated DNA was eluted and purified by phenol chloroform and ethanol precipitation. The total input and immunoprecipitated DNA were labeled with Cy3- and Cy5-labeled random 9-mers, respectively, and hybridized to NimbleGen MM9 DNA Meth 2.1M Deluxe array (Roche NimbleGen Inc., Madison, WI). This array is a single array design that contains CpG islands (MM9) annotated by the UCSC Genome Bioinformatics database (http://genome.ucsc.edu) and RefSeq promoter regions (from about −8.2 kb to +3 kb relative to the transcription start sites) with a coverage of ∼2,100,000 probes. Scanning was performed with the Axon GenePix 4000B microarray scanner.
Raw data on three arrays was extracted as pair files by NimbleScan software (Roche NimbleGen Inc.). Median-centering quantile normalization and linear smoothing by Bioconductor packages Ringo, limma and MEDME was performed. From the normalized log2-ratio data, a sliding-window peak-finding algorithm provided by NimbleScan v2.5 (Roche NimbleGen Inc.) was applied to find the enriched peaks with specified parameters (sliding window width: 750 bp; mini probes per peak: 2; P-value minimum cut-off: 2; maximum spacing between nearby probes within peak: 500 bp). The identified peaks were mapped to genomic features: transcripts and CpG Islands. The MA plots and box-plots were applied to assess the quality of raw data and effect of normalization. A correlation matrix was used to describe correlation among replicate experiments.
To compare differentially enriched regions between ethanol-exposed (E) and matched control (C) mice, the log2-ratio values were averaged and then used to calculate the M′ value [M′=Average(log2 MeDIPE/InputE) – Average(log2 MeDIPC/InputC)] for each probe. NimbleScan sliding-window peak-finding algorithm was run on this data to find the differential enrichment peaks (DEPs). The differential enrichment peaks, called by the NimbleScan algorithm, were filtered according to the following criteria: (i) at least one of the two groups had the median value of log2 MeDIP/Input ≥0.3 and a median value of M′ >0 within each peak region; (ii) at least half of the probes in a peak had the median value of coefficient of variability (CV) ≤0.8 in both groups within each peak region.
Using an R script program, a hierarchical clustering analysis was completed. The probe data matrix was obtained by using PeakScores from DMRs selected by DEP analysis. ‘PeakScore’ is a measure calculated from the P-values of the probes within the peak and reflects the significance of the enrichment. This analysis used a ‘PeakScore’ ≥2 to define the DEPs by using the NimbleScan sliding-window peak-finding algorithm. The peak score is a –log10 transformed P-value, which is the average of the P-values for all probes within the peak. Therefore, a ‘PeakScore’ ≥2 means the average P-value was ≤0.01.
All the annotated peaks from the result of DEP analysis were extracted and combined for peak filtering. The filtering criteria are set as ‘peaks within BOTH top 20% PeakScore AND top 20% PeakDMValue’. A heat map was plotted based on the log2 ratio of probes within the filtered peak regions of each sample and was generated by TMeV4.6.
Promoterome, pathway and CTCF analysis
The top gene promoters identified from the DNA methylation arrays were then subjected to Ingenuity Pathway Analysis. Given the role of the top affected genes, we sought to examine the global trend. The genes corresponding to all previously identified significantly affected promoters were subjected to an ingenuity core analysis. The Ingenuity Knowledge Base (genes only) was used to examine for direct and indirect relationships. Results were filtered to consider only molecules and/or relationships specific to species (mouse) and tissues (nervous system). From the identified ‘Behavior, Neurological Disease, and Psychological Disorders’ network, 30 significantly differentially methylated peaks belonging to different regions of the promoters of major nodes were examined for CTCF-binding sites using the CTCFBS prediction tool (Bao et al., 2008). The genes identified as having CTCF-binding sites were then subjected to a pathway analysis using GeneMANIA (Warde-Farley et al., 2010).
Supplementary Material
Acknowledgments
The authors thank David Carter from the London Regional Genomics Centre for hybridizing the expression arrays and aiding in the analysis, and Kristin Duncan for providing a thorough proofreading of the manuscript.
Footnotes
COMPETING INTERESTS
The authors declare that they do not have any competing or financial interests.
AUTHOR CONTRIBUTIONS
This project was developed by B.I.L., M.L.K., K.M., E.J.D. and S.M.S. B.I.L., K.M., M.L.K. and E.J.D. raised the mice, performed the experimental interventions and extracted the RNA. B.I.L. performed the bioinformatic analysis. S.M.F.A., B.I.L. and E.J.D. designed and performed the qPCR experiments. B.I.L., M.L.K. and S.M.S. wrote the manuscript.
FUNDING
This work was supported by an Ontario Graduate Scholarship (OGS) and Natural Sciences and Engineering Research Council of Canada (NSERC) scholarship to B.I.L., a Queen Elizabeth II Scholarship in Science and Technology (QEIISST) to M.L.K., a scholarship from NSERC to E.J.D., and grants from NSERC, the Canadian Institute of Health Research (CIHR) and the Ontario Mental Health Foundation (OMHF) to S.M.S. The funders had no role in study design, data collection and analysis, decision to publish, or preparation of the manuscript.
SUPPLEMENTARY MATERIAL
Supplementary material for this article is available at http://dmm.biologists.org/lookup/suppl/doi:10.1242/dmm.010975/-/DC1
REFERENCES
- Acampora D., Mazan S., Lallemand Y., Avantaggiato V., Maury M., Simeone A., Brûlet P. (1995). Forebrain and midbrain regions are deleted in Otx2−/− mutants due to a defective anterior neuroectoderm specification during gastrulation. Development 121, 3279–3290 [DOI] [PubMed] [Google Scholar]
- Allan A. M., Chynoweth J., Tyler L. A., Caldwell K. K. (2003). A mouse model of prenatal ethanol exposure using a voluntary drinking paradigm. Alcohol. Clin. Exp. Res. 27, 2009–2016 [DOI] [PubMed] [Google Scholar]
- Archibald S. L., Fennema-Notestine C., Gamst A., Riley E. P., Mattson S. N., Jernigan T. L. (2001). Brain dysmorphology in individuals with severe prenatal alcohol exposure. Dev. Med. Child Neurol. 43, 148–154 [PubMed] [Google Scholar]
- Aruga J., Mikoshiba K. (2003). Identification and characterization of Slitrk, a novel neuronal transmembrane protein family controlling neurite outgrowth. Mol. Cell. Neurosci. 24, 117–129 [DOI] [PubMed] [Google Scholar]
- Autti-Rämö I., Autti T., Korkman M., Kettunen S., Salonen O., Valanne L. (2002). MRI findings in children with school problems who had been exposed prenatally to alcohol. Dev. Med. Child Neurol. 44, 98–106 [DOI] [PubMed] [Google Scholar]
- Bao L., Zhou M., Cui Y. (2008). CTCFBSDB: a CTCF-binding site database for characterization of vertebrate genomic insulators. Nucleic Acids Res. 36 Database issue, D83–D87 [DOI] [PMC free article] [PubMed] [Google Scholar]
- Bartel D. P. (2009). MicroRNAs: target recognition and regulatory functions. Cell 136, 215–233 [DOI] [PMC free article] [PubMed] [Google Scholar]
- Berman R. F., Hannigan J. H. (2000). Effects of prenatal alcohol exposure on the hippocampus: spatial behavior, electrophysiology, and neuroanatomy. Hippocampus 10, 94–110 [DOI] [PubMed] [Google Scholar]
- Boehm S. L., II, Moore E. M., Walsh C. D., Gross C. D., Cavelli A. M., Gigante E., Linsenbardt D. N. (2008). Using drinking in the dark to model prenatal binge-like exposure to ethanol in C57BL/6J mice. Dev. Psychobiol. 50, 566–578 [DOI] [PMC free article] [PubMed] [Google Scholar]
- Caldwell K. K., Sheema S., Paz R. D., Samudio-Ruiz S. L., Laughlin M. H., Spence N. E., Roehlk M. J., Alcon S. N., Allan A. M. (2008). Fetal alcohol spectrum disorder-associated depression: evidence for reductions in the levels of brain-derived neurotrophic factor in a mouse model. Pharmacol. Biochem. Behav. 90, 614–624 [DOI] [PMC free article] [PubMed] [Google Scholar]
- Cassidy S. B., Dykens E., Williams C. A. (2000). Prader-Willi and Angelman syndromes: sister imprinted disorders. Am. J. Med. Genet. 97, 136–146 [DOI] [PubMed] [Google Scholar]
- Chudley A. E., Conry J., Cook J. L., Loock C., Rosales T., LeBlanc N., Public Health Agency of Canada’s National Advisory Committee on Fetal Alcohol Spectrum Disorder (2005). Fetal alcohol spectrum disorder: Canadian guidelines for diagnosis. CMAJ 172 Suppl., S1–S21 [DOI] [PMC free article] [PubMed] [Google Scholar]
- Clancy B., Darlington R. B., Finlay B. L. (2001). Translating developmental time across mammalian species. Neuroscience 105, 7–17 [DOI] [PubMed] [Google Scholar]
- da Rocha S. T., Edwards C. A., Ito M., Ogata T., Ferguson-Smith A. C. (2008). Genomic imprinting at the mammalian Dlk1-Dio3 domain. Trends Genet. 24, 306–316 [DOI] [PubMed] [Google Scholar]
- Davies W., Isles A. R., Humby T., Wilkinson L. S. (2008). What are imprinted genes doing in the brain? Adv. Exp. Med. Biol. 626, 62–70 [DOI] [PubMed] [Google Scholar]
- de los Santos T., Schweizer J., Rees C. A., Francke U. (2000). Small evolutionarily conserved RNA, resembling C/D box small nucleolar RNA, is transcribed from PWCR1, a novel imprinted gene in the Prader-Willi deletion region, which Is highly expressed in brain. Am. J. Hum. Genet. 67, 1067–1082 [DOI] [PMC free article] [PubMed] [Google Scholar]
- Dietz W. H., Masterson K., Sittig L. J., Redei E. E., Herzing L. B. (2012). Imprinting and expression of Dio3os mirrors Dio3 in rat. Front. Genet. 3, 279. [DOI] [PMC free article] [PubMed] [Google Scholar]
- Ding F., Li H. H., Zhang S., Solomon N. M., Camper S. A., Cohen P., Francke U. (2008). SnoRNA Snord116 (Pwcr1/MBII-85) deletion causes growth deficiency and hyperphagia in mice. PLoS One 3,e1709. [DOI] [PMC free article] [PubMed] [Google Scholar]
- Dobbing J., Sands J. (1979). Comparative aspects of the brain growth spurt. Early Hum. Dev. 3, 79–83 [DOI] [PubMed] [Google Scholar]
- Engel N., Thorvaldsen J. L., Bartolomei M. S. (2006). CTCF binding sites promote transcription initiation and prevent DNA methylation on the maternal allele at the imprinted H19/Igf2 locus. Hum. Mol. Genet. 15, 2945–2954 [DOI] [PubMed] [Google Scholar]
- Ernst C., Sequeira A., Klempan T., Ernst N., Ffrench-Mullen J., Turecki G. (2007). Confirmation of region-specific patterns of gene expression in the human brain. Neurogenetics 8, 219–224 [DOI] [PubMed] [Google Scholar]
- Fabian M. R., Sonenberg N., Filipowicz W. (2010). Regulation of mRNA translation and stability by microRNAs. Annu. Rev. Biochem. 79, 351–379 [DOI] [PubMed] [Google Scholar]
- Filippova G. N. (2008). Genetics and epigenetics of the multifunctional protein CTCF. Curr. Top. Dev. Biol. 80, 337–360 [DOI] [PubMed] [Google Scholar]
- Fiore R., Khudayberdiev S., Christensen M., Siegel G., Flavell S. W., Kim T. K., Greenberg M. E., Schratt G. (2009). Mef2-mediated transcription of the miR379-410 cluster regulates activity-dependent dendritogenesis by fine-tuning Pumilio2 protein levels. EMBO J. 28, 697–710 [DOI] [PMC free article] [PubMed] [Google Scholar]
- Flicek P., Amode M. R., Barrell D., Beal K., Brent S., Chen Y., Clapham P., Coates G., Fairley S., Fitzgerald S., et al. (2011). Ensembl 2011. Nucleic Acids Res. 39 Database issue, D800–D806 [DOI] [PMC free article] [PubMed] [Google Scholar]
- Friedman J. M., Jones P. A. (2009). MicroRNAs: critical mediators of differentiation, development and disease. Swiss Med. Wkly. 139, 466–472 [DOI] [PMC free article] [PubMed] [Google Scholar]
- Gao J., Wang W. Y., Mao Y. W., Gräff J., Guan J. S., Pan L., Mak G., Kim D., Su S. C., Tsai L. H. (2010). A novel pathway regulates memory and plasticity via SIRT1 and miR-134. Nature 466, 1105–1109 [DOI] [PMC free article] [PubMed] [Google Scholar]
- Gil-Mohapel J., Boehme F., Kainer L., Christie B. R. (2010). Hippocampal cell loss and neurogenesis after fetal alcohol exposure: insights from different rodent models. Brain Res. Rev. 64, 283–303 [DOI] [PubMed] [Google Scholar]
- Govorko D., Bekdash R. A., Zhang C., Sarkar D. K. (2012). Male germline transmits fetal alcohol adverse effect on hypothalamic proopiomelanocortin gene across generations. Biol. Psychiatry 72, 378–388 [DOI] [PMC free article] [PubMed] [Google Scholar]
- Guo Y., Chen Y., Carreon S., Qiang M. (2011). Chronic intermittent ethanol exposure and its removal induce a different miRNA expression pattern in primary cortical neuronal cultures. Alcohol. Clin. Exp. Res. [DOI] [PMC free article] [PubMed] [Google Scholar]
- Hager R., Johnstone R. A. (2003). The genetic basis of family conflict resolution in mice. Nature 421, 533–535 [DOI] [PubMed] [Google Scholar]
- Hark A. T., Schoenherr C. J., Katz D. J., Ingram R. S., Levorse J. M., Tilghman S. M. (2000). CTCF mediates methylation-sensitive enhancer-blocking activity at the H19/Igf2 locus. Nature 405, 486–489 [DOI] [PubMed] [Google Scholar]
- Haycock P. C., Ramsay M. (2009). Exposure of mouse embryos to ethanol during preimplantation development: effect on DNA methylation in the h19 imprinting control region. Biol. Reprod. 81, 618–627 [DOI] [PubMed] [Google Scholar]
- Herman L. E., Acosta M. C., Chang P. N. (2008). Gender and attention deficits in children diagnosed with a Fetal Alcohol Spectrum Disorder. Can. J. Clin. Pharmacol. 15, e411–e419 [PubMed] [Google Scholar]
- Howlett S. K., Reik W. (1991). Methylation levels of maternal and paternal genomes during preimplantation development. Development 113, 119–127 [DOI] [PubMed] [Google Scholar]
- Hutson J. R., Stade B., Lehotay D. C., Collier C. P., Kapur B. M. (2012). Folic acid transport to the human fetus is decreased in pregnancies with chronic alcohol exposure. PLoS ONE 7, e38057. [DOI] [PMC free article] [PubMed] [Google Scholar]
- Ikonomidou C., Bittigau P., Ishimaru M. J., Wozniak D. F., Koch C., Genz K., Price M. T., Stefovska V., Hörster F., Tenkova T., et al. (2000). Ethanol-induced apoptotic neurodegeneration and fetal alcohol syndrome. Science 287, 1056–1060 [DOI] [PubMed] [Google Scholar]
- Irizarry R. A., Bolstad B. M., Collin F., Cope L. M., Hobbs B., Speed T. P. (2003). Summaries of Affymetrix GeneChip probe level data. Nucleic Acids Res. 31, e15. [DOI] [PMC free article] [PubMed] [Google Scholar]
- Jirikowic T., Olson H. C., Kartin D. (2008). Sensory processing, school performance, and adaptive behavior of young school-age children with fetal alcohol spectrum disorders. Phys. Occup. Ther. Pediatr. 28, 117–136 [DOI] [PubMed] [Google Scholar]
- Kagami M., Sekita Y., Nishimura G., Irie M., Kato F., Okada M., Yamamori S., Kishimoto H., Nakayama M., Tanaka Y., et al. (2008). Deletions and epimutations affecting the human 14q32.2 imprinted region in individuals with paternal and maternal upd(14)-like phenotypes. Nat. Genet. 40, 237–242 [DOI] [PubMed] [Google Scholar]
- Kaminen-Ahola N., Ahola A., Maga M., Mallitt K. A., Fahey P., Cox T. C., Whitelaw E., Chong S. (2010). Maternal ethanol consumption alters the epigenotype and the phenotype of offspring in a mouse model. PLoS Genet. 6, e1000811. [DOI] [PMC free article] [PubMed] [Google Scholar]
- Kim J. Y., Duan X., Liu C. Y., Jang M. H., Guo J. U., Pow-anpongkul N., Kang E., Song H., Ming G. L. (2009). DISC1 regulates new neuron development in the adult brain via modulation of AKT-mTOR signaling through KIAA1212. Neuron 63, 761–773 [DOI] [PMC free article] [PubMed] [Google Scholar]
- Kleiber M. L., Wright E., Singh S. M. (2011). Maternal voluntary drinking in C57BL/6J mice: advancing a model for fetal alcohol spectrum disorders. Behav. Brain Res. 223, 376–387 [DOI] [PubMed] [Google Scholar]
- Kleiber M. L., Laufer B. I., Wright E., Diehl E. J., Singh S. M. (2012). Long-term alterations to the brain transcriptome in a maternal voluntary consumption model of fetal alcohol spectrum disorders. Brain Res. 1458, 18–33 [DOI] [PubMed] [Google Scholar]
- Kleiber M. L., Mantha K., Stringer R. L., Singh S. M. (2013). Neurodevelopmental alcohol exposure elicits long-term changes to gene expression that alter distinct molecular pathways dependent on timing of exposure. J. Neurodev. Disord. 5, 6. [DOI] [PMC free article] [PubMed] [Google Scholar]
- Klintsova A. Y., Helfer J. L., Calizo L. H., Dong W. K., Goodlett C. R., Greenough W. T. (2007). Persistent impairment of hippocampal neurogenesis in young adult rats following early postnatal alcohol exposure. Alcohol. Clin. Exp. Res. 31, 2073–2082 [DOI] [PubMed] [Google Scholar]
- Knezovich J. G., Ramsay M. (2012). The effect of preconception paternal alcohol exposure on epigenetic remodeling of the h19 and rasgrf1 imprinting control regions in mouse offspring. Front. Genet. 3, 10. [DOI] [PMC free article] [PubMed] [Google Scholar]
- Knoll J. H. M., Nicholls R. D., Magenis R. E., Graham J. M., Jr, Lalande M., Latt S. A. (1989). Angelman and Prader-Willi syndromes share a common chromosome 15 deletion but differ in parental origin of the deletion. Am. J. Med. Genet. 32, 285–290 [DOI] [PubMed] [Google Scholar]
- Kozomara A., Griffiths-Jones S. (2011). miRBase: integrating microRNA annotation and deep-sequencing data. Nucleic Acids Res. 39 Database issue, D152–D157 PubMed [DOI] [PMC free article] [PubMed] [Google Scholar]
- Kuzmin A., Han Z., Golding M. C., Mann M. R. W., Latham K. E., Varmuza S. (2008). The PcG gene Sfmbt2 is paternally expressed in extraembryonic tissues. Gene Expr. Patterns 8, 107–116 [DOI] [PMC free article] [PubMed] [Google Scholar]
- Kwon C. H., Luikart B. W., Powell C. M., Zhou J., Matheny S. A., Zhang W., Li Y., Baker S. J., Parada L. F. (2006). Pten regulates neuronal arborization and social interaction in mice. Neuron 50, 377–388 [DOI] [PMC free article] [PubMed] [Google Scholar]
- Laprise S. L. (2009). Implications of epigenetics and genomic imprinting in assisted reproductive technologies. Mol. Reprod. Dev. 76, 1006–1018 [DOI] [PubMed] [Google Scholar]
- Laufer B., Singh S. (2012). A macro role for imprinted clusters of MicroRNAs in the brain. MicroRNA 1, 59–64 [DOI] [PubMed] [Google Scholar]
- Le Meur E., Watrin F., Landers M., Sturny R., Lalande M., Muscatelli F. (2005). Dynamic developmental regulation of the large non-coding RNA associated with the mouse 7C imprinted chromosomal region. Dev. Biol. 286, 587–600 [DOI] [PubMed] [Google Scholar]
- Leung K. N., Vallero R. O., DuBose A. J., Resnick J. L., LaSalle J. M. (2009). Imprinting regulates mammalian snoRNA-encoding chromatin decondensation and neuronal nucleolar size. Hum. Mol. Genet. 18, 4227–4238 [DOI] [PMC free article] [PubMed] [Google Scholar]
- Lewis B. P., Burge C. B., Bartel D. P. (2005). Conserved seed pairing, often flanked by adenosines, indicates that thousands of human genes are microRNA targets. Cell 120, 15–20 [DOI] [PubMed] [Google Scholar]
- Lin S., Ferguson-Smith A. C., Schultz R. M., Bartolomei M. S. (2011). Nonallelic transcriptional roles of CTCF and cohesins at imprinted loci. Mol. Cell. Biol. 31, 3094–3104 [DOI] [PMC free article] [PubMed] [Google Scholar]
- Ling J. Q., Li T., Hu J. F., Vu T. H., Chen H. L., Qiu X. W., Cherry A. M., Hoffman A. R. (2006). CTCF mediates interchromosomal colocalization between Igf2/H19 and Wsb1/Nf1. Science 312, 269–272 [DOI] [PubMed] [Google Scholar]
- Liu Y., Balaraman Y., Wang G., Nephew K. P., Zhou F. C. (2009). Alcohol exposure alters DNA methylation profiles in mouse embryos at early neurulation. Epigenetics 4, 500–511 [DOI] [PMC free article] [PubMed] [Google Scholar]
- Lupton C., Burd L., Harwood R. (2004). Cost of fetal alcohol spectrum disorders. Am. J. Med. Genet. C. Semin. Med. Genet. 127C, 42–50 [DOI] [PubMed] [Google Scholar]
- Maehama T., Dixon J. E. (1998). The tumor suppressor, PTEN/MMAC1, dephosphorylates the lipid second messenger, phosphatidylinositol 3,4,5-trisphosphate. J. Biol. Chem. 273, 13375–13378 [DOI] [PubMed] [Google Scholar]
- Mantha K., Kleiber M. L., Singh S. M. (2013). Neurodevelopmental timing of ethanol exposure may contribute to observed heterogeneity of behavioral deficits in a mouse model of fetal alcohol spectrum disorder (FASD). J. Behav. Brain. Sci. 3,85–99 [Google Scholar]
- Mattson S. N., Riley E. P. (1998). A review of the neurobehavioral deficits in children with fetal alcohol syndrome or prenatal exposure to alcohol. Alcohol. Clin. Exp. Res. 22, 279–294 [DOI] [PubMed] [Google Scholar]
- Mattson S. N., Riley E. P., Gramling L., Delis D. C., Jones K. L. (1998). Neuropsychological comparison of alcohol-exposed children with or without physical features of fetal alcohol syndrome. Neuropsychology 12, 146–153 [DOI] [PubMed] [Google Scholar]
- Mattson S. N., Crocker N., Nguyen T. T. (2011). Fetal alcohol spectrum disorders: neuropsychological and behavioral features. Neuropsychol. Rev. 21, 81–101 [DOI] [PMC free article] [PubMed] [Google Scholar]
- May P. A., Gossage J. P. (2001). Estimating the prevalence of fetal alcohol syndrome. A summary. Alcohol Res. Health 25, 159–167 [PMC free article] [PubMed] [Google Scholar]
- May P. A., Gossage J. P., Kalberg W. O., Robinson L. K., Buckley D., Manning M., Hoyme H. E. (2009). Prevalence and epidemiologic characteristics of FASD from various research methods with an emphasis on recent in-school studies. Dev. Disabil. Res. Rev. 15, 176–192 [DOI] [PubMed] [Google Scholar]
- Métivier R., Gallais R., Tiffoche C., Le Péron C., Jurkowska R. Z., Carmouche R. P., Ibberson D., Barath P., Demay F., Reid G., et al. (2008). Cyclical DNA methylation of a transcriptionally active promoter. Nature 452, 45–50 [DOI] [PubMed] [Google Scholar]
- Middaugh L. D., Szumlinski K. K., Van Patten Y., Marlowe A. L., Kalivas P. W. (2003). Chronic ethanol consumption by C57BL/6 mice promotes tolerance to its interoceptive cues and increases extracellular dopamine, an effect blocked by naltrexone. Alcohol. Clin. Exp. Res. 27, 1892–1900 [DOI] [PubMed] [Google Scholar]
- Miranda R. C. (2011). Commentary: will analyzing the epigenome yield cohesive principles of ethanol teratology? Alcohol. Clin. Exp. Res. 35, 1201–1203 [DOI] [PubMed] [Google Scholar]
- Miranda R. C. (2012). MicroRNAs and fetal brain development: Implications for ethanol teratology during the second trimester period of neurogenesis. Front. Genet. 3, 77 PubMed [DOI] [PMC free article] [PubMed] [Google Scholar]
- Moazed D. (2009). Small RNAs in transcriptional gene silencing and genome defence. Nature 457, 413–420 [DOI] [PMC free article] [PubMed] [Google Scholar]
- Monk M., Boubelik M., Lehnert S. (1987). Temporal and regional changes in DNA methylation in the embryonic, extraembryonic and germ cell lineages during mouse embryo development. Development 99, 371–382 [DOI] [PubMed] [Google Scholar]
- Moore T. (2001). Genetic conflict, genomic imprinting and establishment of the epigenotype in relation to growth. Reproduction 122, 185–193 [DOI] [PubMed] [Google Scholar]
- Morison I. M., Ramsay J. P., Spencer H. G. (2005). A census of mammalian imprinting. Trends Genet. 21, 457–465 [DOI] [PubMed] [Google Scholar]
- Mukherji S., Ebert M. S., Zheng G. X., Tsang J. S., Sharp P. A., van Oudenaarden A. (2011). MicroRNAs can generate thresholds in target gene expression. Nat. Genet. 43, 854–859 [DOI] [PMC free article] [PubMed] [Google Scholar]
- Nakatani J., Tamada K., Hatanaka F., Ise S., Ohta H., Inoue K., Tomonaga S., Watanabe Y., Chung Y. J., Banerjee R., et al. (2009). Abnormal behavior in a chromosome-engineered mouse model for human 15q11–13 duplication seen in autism. Cell 137, 1235–1246 [DOI] [PMC free article] [PubMed] [Google Scholar]
- Nowak K., Stein G., Powell E., He L. M., Naik S., Morris J., Marlow S., Davis T. L. (2011). Establishment of paternal allele-specific DNA methylation at the imprinted mouse Gtl2 locus. Epigenetics 6, 1012–1020 [DOI] [PMC free article] [PubMed] [Google Scholar]
- O’Connor R. M., Dinan T. G., Cryan J. F. (2012). Little things on which happiness depends: microRNAs as novel therapeutic targets for the treatment of anxiety and depression. Mol. Psychiatry 17, 359–376 [DOI] [PubMed] [Google Scholar]
- Peirson S. N., Butler J. N. (2007). Quantitative polymerase chain reaction. Methods Mol. Biol. 362, 349–362 [DOI] [PubMed] [Google Scholar]
- Popova S., Stade B., Bekmuradov D., Lange S., Rehm J. (2011). What do we know about the economic impact of fetal alcohol spectrum disorder? A systematic literature review. Alcohol Alcohol. 46, 490–497 [DOI] [PubMed] [Google Scholar]
- Priller C., Bauer T., Mitteregger G., Krebs B., Kretzschmar H. A., Herms J. (2006). Synapse formation and function is modulated by the amyloid precursor protein. J. Neurosci. 26, 7212–7221 [DOI] [PMC free article] [PubMed] [Google Scholar]
- Rice D., Barone S., Jr (2000). Critical periods of vulnerability for the developing nervous system: evidence from humans and animal models. Environ. Health Perspect. 108 Suppl. 3, 511–533 [DOI] [PMC free article] [PubMed] [Google Scholar]
- Runte M., Hüttenhofer A., Gross S., Kiefmann M., Horsthemke B., Buiting K. (2001). The IC-SNURF-SNRPN transcript serves as a host for multiple small nucleolar RNA species and as an antisense RNA for UBE3A. Hum. Mol. Genet. 10, 2687–2700 [DOI] [PubMed] [Google Scholar]
- Sabunciyan S., Yolken R., Ragan C. M., Potash J. B., Nimgaonkar V. L., Dickerson F., Lienos I. C., Weis S. (2007). Polymorphisnis in the homeobox gene OTX2 may be a risk factor for bipolar disorder. Am. J. Med. Genet. 144B, 1083–1086 [DOI] [PubMed] [Google Scholar]
- Sasaki Y., Araki T., Milbrandt J. (2006). Stimulation of nicotinamide adenine dinucleotide biosynthetic pathways delays axonal degeneration after axotomy. J. Neurosci. 26, 8484–8491 [DOI] [PMC free article] [PubMed] [Google Scholar]
- Schmittgen T. D., Livak K. J. (2008). Analyzing real-time PCR data by the comparative C(T) method. Nat. Protoc. 3, 1101–1108 [DOI] [PubMed] [Google Scholar]
- Seitz H., Royo H., Bortolin M. L., Lin S. P., Ferguson-Smith A. C., Cavaillé J. (2004). A large imprinted microRNA gene cluster at the mouse Dlk1-Gtl2 domain. Genome Res. 14, 1741–1748 [DOI] [PMC free article] [PubMed] [Google Scholar]
- Shen Y., Yue F., McCleary D. F., Ye Z., Edsall L., Kuan S., Wagner U., Dixon J., Lee L., Lobanenkov V. V., et al. (2012). A map of the cis-regulatory sequences in the mouse genome. Nature 488, 116–120 [DOI] [PMC free article] [PubMed] [Google Scholar]
- Shukla P. K., Sittig L. J., Ullmann T. M., Redei E. E. (2011). Candidate placental biomarkers for intrauterine alcohol exposure. Alcohol. Clin. Exp. Res. 35, 559–565 [DOI] [PMC free article] [PubMed] [Google Scholar]
- Sittig L. J., Shukla P. K., Herzing L. B., Redei E. E. (2011). Strain-specific vulnerability to alcohol exposure in utero via hippocampal parent-of-origin expression of deiodinase-III. FASEB J. 25, 2313–2324 [DOI] [PMC free article] [PubMed] [Google Scholar]
- Skryabin B. V., Gubar L. V., Seeger B., Pfeiffer J., Handel S., Robeck T., Karpova E., Rozhdestvensky T. S., Brosius J. (2007). Deletion of the MBII-85 snoRNA gene cluster in mice results in postnatal growth retardation. PLoS Genet. 3, e235. [DOI] [PMC free article] [PubMed] [Google Scholar]
- Soares A. R., Pereira P. M., Ferreira V., Reverendo M., Simões J., Bezerra A. R., Moura G. R., Santos M. A. (2012). Ethanol exposure induces upregulation of specific microRNAs in zebrafish embryos. Toxicol. Sci. 127, 18–28 [DOI] [PubMed] [Google Scholar]
- Soverchia L., Ubaldi M., Leonardi-Essmann F., Ciccocioppo R., Hardiman G. (2005). Microarrays – the challenge of preparing brain tissue samples. Addict. Biol. 10, 5–13 [DOI] [PubMed] [Google Scholar]
- Spadoni A. D., McGee C. L., Fryer S. L., Riley E. P. (2007). Neuroimaging and fetal alcohol spectrum disorders. Neurosci. Biobehav. Rev. 31, 239–245 [DOI] [PMC free article] [PubMed] [Google Scholar]
- Stade B., Ali A., Bennett D., Campbell D., Johnston M., Lens C., Tran S., Koren G. (2009). The burden of prenatal exposure to alcohol: revised measurement of cost. Can. J. Clin. Pharmacol. 16, e91–e102 [PubMed] [Google Scholar]
- Sun W., Lee S., Zhabotynsky V., Zou F., Wright F. A., Crowley J. J., Yun Z., Buus R. J., Miller D. R., Wang J., et al. (2012). Transcriptome atlases of mouse brain reveals differential expression across brain regions and genetic backgrounds. G3 (Bethesda) 2,203–211 [DOI] [PMC free article] [PubMed] [Google Scholar]
- Valenzuela C. F., Morton R. A., Diaz M. R., Topper L. (2012). Does moderate drinking harm the fetal brain? Insights from animal models. Trends Neurosci. 35, 284–292 [DOI] [PMC free article] [PubMed] [Google Scholar]
- Velker B. A., Denomme M. M., Mann M. R. (2012). Embryo culture and epigenetics. Methods Mol. Biol. 912, 399–421 [DOI] [PubMed] [Google Scholar]
- Verghese P. B., Sasaki Y., Yang D., Stewart F., Sabar F., Finn M. B., Wroge C. M., Mennerick S., Neil J. J., Milbrandt J., et al. (2011). Nicotinamide mononucleotide adenylyl transferase 1 protects against acute neurodegeneration in developing CNS by inhibiting excitotoxic-necrotic cell death. Proc. Natl. Acad. Sci. USA 108, 19054–19059 [DOI] [PMC free article] [PubMed] [Google Scholar]
- Vergoulis T., Vlachos I. S., Alexiou P., Georgakilas G., Maragkakis M., Reczko M., Gerangelos S., Koziris N., Dalamagas T., Hatzigeorgiou A. G. (2012). TarBase 6.0: capturing the exponential growth of miRNA targets with experimental support. Nucleic Acids Res. 40, D222–D229 [DOI] [PMC free article] [PubMed] [Google Scholar]
- Vikalo H., Hassibi B., Hassibi A. (2010). Limits of performance of quantitative polymerase chain reaction systems. IEEE Trans. Inf. Theory 56, 688–695 [Google Scholar]
- Wagstaff J., Knoll J. H., Glatt K. A., Shugart Y. Y., Sommer A., Lalande M. (1992). Maternal but not paternal transmission of 15q11-13-linked nondeletion Angelman syndrome leads to phenotypic expression. Nat. Genet. 1, 291–294 [DOI] [PubMed] [Google Scholar]
- Wang L. L., Zhang Z., Li Q., Yang R., Pei X., Xu Y., Wang J., Zhou S. F., Li Y. (2009). Ethanol exposure induces differential microRNA and target gene expression and teratogenic effects which can be suppressed by folic acid supplementation. Hum. Reprod. 24, 562–579 [DOI] [PubMed] [Google Scholar]
- Wang Q., Chow J., Hong J., Smith A. F., Moreno C., Seaby P., Vrana P., Miri K., Tak J., Chung E. D., et al. (2011). Recent acquisition of imprinting at the rodent Sfmbt2 locus correlates with insertion of a large block of miRNAs. BMC Genomics 12, 204. [DOI] [PMC free article] [PubMed] [Google Scholar]
- Warde-Farley D., Donaldson S. L., Comes O., Zuberi K., Badrawi R., Chao P., Franz M., Grouios C., Kazi F., Lopes C. T., et al. (2010). The GeneMANIA prediction server: biological network integration for gene prioritization and predicting gene function. Nucleic Acids Res. 38 Web Server issue, W214–W220 [DOI] [PMC free article] [PubMed] [Google Scholar]
- Williams A., Flavell R. A. (2008). The role of CTCF in regulating nuclear organization. J. Exp. Med. 205, 747–750 [DOI] [PMC free article] [PubMed] [Google Scholar]
- Wozniak D. F., Hartman R. E., Boyle M. P., Vogt S. K., Brooks A. R., Tenkova T., Young C., Olney J. W., Muglia L. J. (2004). Apoptotic neurodegeneration induced by ethanol in neonatal mice is associated with profound learning/memory deficits in juveniles followed by progressive functional recovery in adults. Neurobiol. Dis. 17, 403–414 [DOI] [PubMed] [Google Scholar]
- Yoshimura T., Arimura N., Kawano Y., Kawabata S., Wang S., Kaibuchi K. (2006). Ras regulates neuronal polarity via the PI3-kinase/Akt/GSK-3beta/CRMP-2 pathway. Biochem. Biophys. Res. Commun. 340, 62–68 [DOI] [PubMed] [Google Scholar]
- Young C., Olney J. W. (2006a). Neuroapoptosis in the infant mouse brain triggered by a transient small increase in blood alcohol concentration. Neurobiol. Dis. 22, 548–554 [DOI] [PubMed] [Google Scholar]
- Young C., Olney J. W. (2006b). Neuroapoptosis in the infant mouse brain triggered by a transient small increase in blood alcohol concentration. Neurobiol. Dis. 22, 548–554 [DOI] [PubMed] [Google Scholar]
- Zeisel S. H. (2011). What choline metabolism can tell us about the underlying mechanisms of fetal alcohol spectrum disorders. Mol. Neurobiol. 44, 185–191 [DOI] [PMC free article] [PubMed] [Google Scholar]
Associated Data
This section collects any data citations, data availability statements, or supplementary materials included in this article.