Abstract
Context:
Genome-wide association studies (GWASs) and meta-analyses of GWASs have led to the identification of a number of promising genes for osteoporosis. However, inconsistent findings are seen among and between GWASs and meta-analyses, and inconsistencies have even been observed between meta-analyses whose samples overlapped to a large extent.
Objectives:
We carefully evaluated the usefulness and limitations of GWASs and their meta-analyses, with an emphasis on understanding the reasons for inconsistent results.
Design:
Based on published empirical data for osteoporosis, we performed a series of theoretical analyses using simulation studies.
Results:
The power of meta-analyses is limited to identifying a particular locus with modest effect size. In the situation in which individual GWASs were not included in the meta-analysis (ie, nonoverlap), the meta-analysis has rather limited power to replicate particular loci identified from the individual GWASs. Between-study heterogeneity may result in a power loss in meta-analyses, implying that adding heterogeneous samples into a meta-analysis may reduce the power, rather than having the anticipated effect of increasing power due to increased sample size.
Conclusions:
Discordant findings in GWASs and meta-analyses are not unexpected, even for true susceptible genes. Contrary to the general belief, meta-analyses should not and cannot be used as a gold standard to evaluate the results of individual GWASs. Individual GWASs in homogeneous populations can detect true disease genes that meta-analyses may have low power to replicate.
Recent genome-wide association studies (GWASs) and large-scale meta-analyses have greatly advanced our understanding of the pathophysiology of osteoporosis. To date, more than 15 GWASs and their meta-analyses have identified more than 60 genes/loci associated with variations in bone mineral density (BMD) (1). In particular, the GEnetic Factors for OSteoporosis (GEFOS) Consortium published 2 large-scale GWAS meta-analyses (2, 3). Their first meta-analysis (GEFOS-1), which included 19 195 subjects, identified 20 BMD loci (2). Their second GWAS meta-analysis (GEFOS-2), the largest one to date in the bone field, included 32 961 and 50 933 individuals in the discovery and replication phase, respectively, which identified a total of 56 BMD loci (3).
However, comparison of the results across individual GWASs and meta-analyses raises a number of critical questions such as the following: 1) are individual GWASs still useful when a meta-analysis, with a much larger sample size, is available; 2) why did some genes/loci identified as being significant in independent individual GWASs [eg, ADAMTS18 (4)] fail to attain significance in independent GEFOS-2 meta-analyses (3), which had a much larger sample size; 3) why did some genes/loci identified as being significant in individual GWASs [eg, RAP1A, TBC1D8, and OSBPL1A (5)] fail to attain significance at the genome-wide level in GEFOS-2, in circumstances in which the samples used in the individual GWASs were included in GEFOS-2 (3); 4) why have inconsistent findings even been observed between meta-analyses [eg, GEFOS-1 (2) and GEFOS-2 (3)] whose samples overlapped to a large extent; and 5) should the meta-analysis with the largest number of individuals be considered as the gold standard to evaluate findings of other independent GWASs?
To address these questions, we performed a series of theoretical analyses using simulation studies. Our purpose was to explore the usefulness and limitations of GWASs and meta-analyses in genetic studies of osteoporosis, recognizing that our findings will be relevant across studies of other endocrine and metabolic diseases such as diabetes and obesity.
Materials and Methods
For illustration, we based our meta-analysis simulation on the sample structure of GEFOS-2 (with 17 GWASs with 32 961 subjects in discovery stage) so that it would correspond closely to the empirical studies for osteoporosis. For comparison, we simulated an individual GWAS with 10 000 subjects (including both discovery and replication samples), approximating those of major independent individual GWASs (4, 6, 7). Simulation was shown under example situations for simple demonstration of general principles of the results. In power calculation, the significance level (even those for replication) was set at the genome-wide scale of 5 × 10⁻⁸ because it has been a practice in the field that the genome-wide significant results in meta-analyses have been used to judge the robustness and validity of GWAS findings of other individual studies (1). In practice, replication should be assessed against appropriate thresholds (eg, P = .05/N, where N is the number of genes/variants to be tested for replication in a meta-analysis).
Although the true distribution of individual loci effects is unknown, estimation could be made based on the GEFOS-2 findings. The 56 single-nucleotide polymorphisms (SNPs) identified by GEFOS-2 explained approximately 5% of variation in BMD, resulting in an average effect of approximately 0.1% per SNP. Because it is reasonable to assume that loci that have eluded detection are likely to have a smaller effect on phenotypic variation than those already identified, an average effect less than 0.1% would be expected. Consequently, when setting general parameters for simulations, we selected a plausible, but arbitrary, average effect of 0.05%. The assumption of the average effect size of 0.05% is also supported by the empirical data. So far, most published GWASs and meta-analyses (of similar scale to GEFOS-2) for human diseases/traits (eg, body mass index for obesity) have reported SNPs/loci that in total explain less than 5% of the variation in the each of the studied traits (8–11). The effect size per SNP/locus is generally between 0.01% and 0.1% (8–11), although a few limited major loci may have larger effect size (for example, FTO may explain approximately 0.3% of variance in body mass index) (8). Moreover, theoretical studies demonstrate that reported associations often have inflated (not underestimated) effects compared with the true effect sizes (12, 13). However, for comparison, in simulation analyses we also considered the situation of a larger average effect size of 0.1% (which is among the extreme top according to the extensive literature).
We set the total heritability accounted for by common variants at 50% for BMD. Therefore, the total number of independent causal SNPs was 1000 for the average effect size of 0.05% (ie, 50% total heritability divided by 0.05% average effect per locus) or 500 for an average effect size of 0.1% (ie, 50% total heritability divided by 0.1% average effect per locus). The minor allele frequency (MAF) of each SNP was set at 0.3.
Results
Power and value of individual GWASs
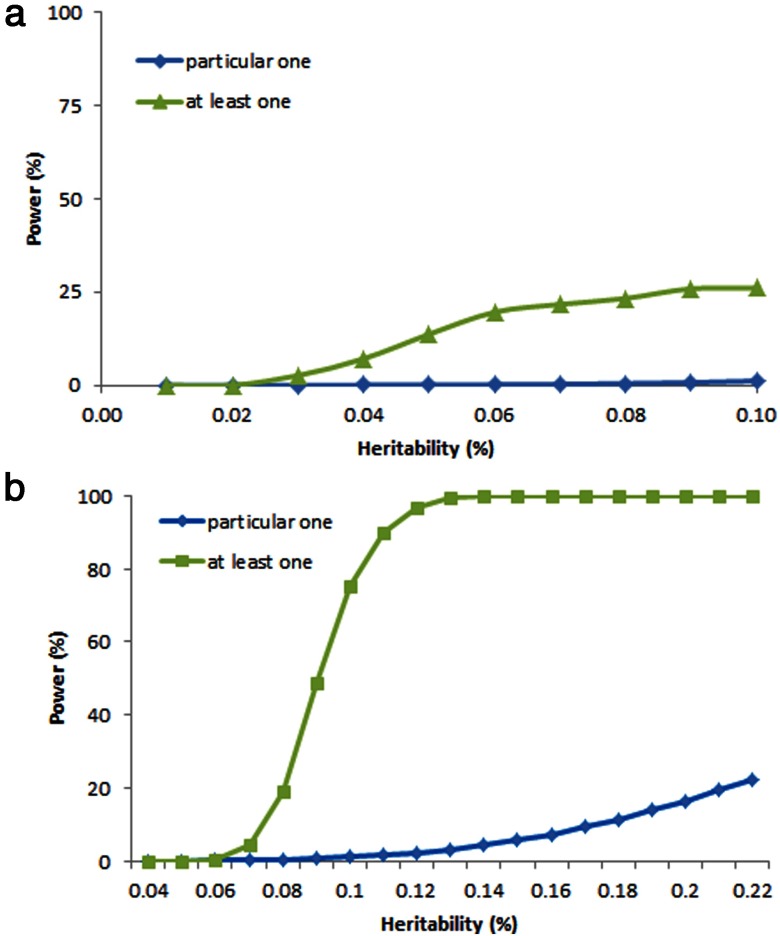
Although individual GWASs are smaller in sample size than meta-analyses, they are more homogeneous in sample recruitment criteria, phenotyping, genotyping methodology, and statistical analytical methods. Figure 1 shows the power of individual GWASs based on the assumption described above. First, the power of an individual study to identify any particular locus is limited. In the situation of 1000 causal SNPs, the power is only 0.07% to detect a particular SNP with an effect size of 0.05%. In the situation of 500 causal SNPs, the power is only 1.1% to detect a particular SNP with an effect size of 0.1%. With an effect size as high as 0.2%, the power to detect the SNP is still only 16.4%. Second, the power to identify at least one (any one) true locus is moderate for the situation of 1000 causal SNPs. For SNPs with average or lower effects, the power to identify at least one is approximately 14%. For the situation of 500 causal SNPs, the power of identifying at least one (any one) locus is pretty high (>75%).
Figure 1.
Power of an individual GWAS. A total of 10 000 unrelated subjects were simulated for the situation of 1,000 Causal SNPs with the average effect size of 0.05% (A) and the situation of 500 causal SNPs with the average effect size of 0.1% (B). The MAF of SNPs was set at 0.3. The significance level was set at the genome-wide level of 5.0 × 10⁻⁸.
These findings may explain the observation that a number of previous individual GWASs have identified novel loci despite the relatively limited sample sizes. Therefore, given the anticipated large number of significant loci that have eluded detection thus far, individual studies are still valuable in identifying at least some of these underlying effect loci.
Value of meta-analyses
In the simulation analysis, we considered an optimum situation in which all individual GWAS samples for a meta-analysis are ideally homogeneous in terms of locus effect and other parameters (eg, phenotype measurements, environment, etc). The power of meta-analyses for the situations of 1000 and 500 causal SNPs is displayed in Figure 2, based on which of the following conclusions are drawn:
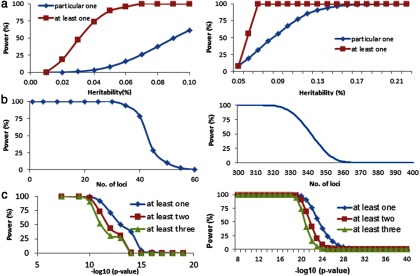
The power of a meta-analysis is moderate (ie, > 60%) for identifying a particular SNP with large effects (ie, > 0.1%). For SNPs with small to modest effect sizes (<0.05%), the power is quite low (<9%) (Figure 2A).
The power to identify at least 1 SNP is generally high (>80% for a SNP with an effect size of 0.05%). However, when the effect threshold decreases to 0.02%, the power decreases dramatically to 18%. Therefore, identifying SNPs with small effects remains challenging, even with the increased sample size in a meta-analysis.
The number of loci that can be detected in meta-analyses greatly exceeds the number that can be detected in individual GWASs (Figure 2B). For the situation of 1000 causal SNPs, the meta-analyses may detect as many as 40 independent loci with 80% power. For 500 causal SNPs, the meta-analyses may detect as many as 330 independent loci with 80% power. However, as the number of loci increases further, the power to simultaneously detect them drops rapidly. For example, for 1000 causal SNPs, the power to detect 50 independent loci is only 7%, even at the significance level of 5 × 10⁻⁸. For 500 causal SNPs, the power to detect 350 independent loci is only 15%. With increasing significance stringency, the power to detect significant loci drops rapidly, and at more stringent significance levels (eg, < 1 × 10⁻¹⁵), causal loci are highly likely to escape detection (Figure 2C).
Figure 2.

Power of a meta-analysis in ideally homogeneous populations. The left and right columns show the results for the situations of 1000 and 500 causal SNPs, respectively. A, We simulated several homogeneous GWAS samples (total sample size of 32 961 study subjects) for a meta-analysis. The significance level was set at the genome-wide scale of 5 × 10⁻⁸. Power was estimated on 10 000 simulation replications. For at least 1 case, the x-axis corresponded to the heritability threshold. B, Power of a meta-analysis for identifying at least a specified number of loci. C, Power of a meta-analysis to identify at least 1, 2, or 3 independent SNPs for various significance levels.
Replicability of individual GWASs by meta-analysis
We investigated the power of meta-analyses to replicate individual GWAS findings, again under the optimum condition of sample homogeneity across individual studies.
We first considered the situation in which an individual GWAS was not included in the meta-analysis (ie, nonoverlap). As displayed in Figure 2A, the meta-analysis has rather limited power to replicate particular loci from individual GWASs, especially for SNPs with small effects (<0.05%), suggesting that the inconsistency of findings between independent individual GWASs and a meta-analysis is not unexpected, considering the limited power of a meta-analysis for replication. This may explain why ADAMTS18 identified in an independent GWAS (4) was not significant in GEFOS-2 (3).
We further considered the replication in a situation in which an individual GWAS was included in a meta-analysis [eg, GEFOS-2 consisted of the samples of the GWAS by Hsu et al (5)]. We found that the power of the meta-analysis to replicate the individual GWAS is high (>88% for SNPs with average effect of 0.05%). However, in this case, consistency of findings between individual GWASs and a meta-analysis does not actually confer independent replication because the samples used are nonindependent.
Challenge of meta-analysis
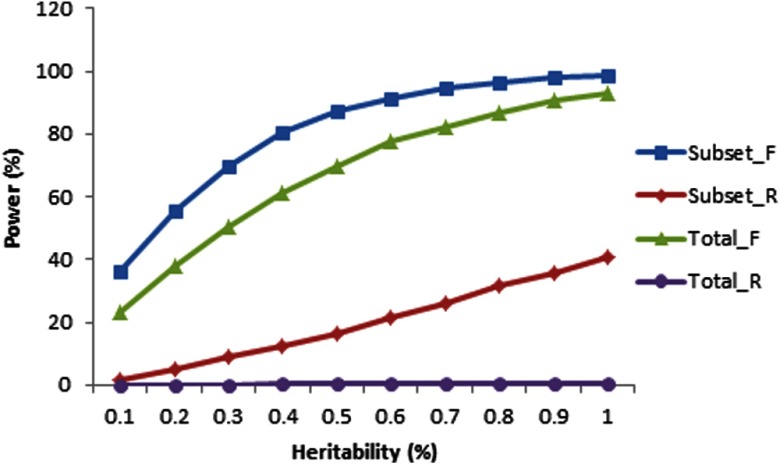
It is important to recognize that the assumption of between-study homogeneity for meta-analyses in the above-mentioned simulations is an oversimplification. We further evaluated the potential effects of heterogeneity on results of a meta-analysis. We simulated a specific SNP for illustration and took into account the fact that, in the absence of overall locus effect, individual studies could still present study-specific effects due to sampling error (14). We sampled each study-specific locus effect from the normal distribution N(β0, σb2), where β0 and σb2 represent the overall locus effect and within-study variance, respectively. The effects of heterogeneity on association power were investigated under the situation of various degrees of heterogeneity effects among individual studies. We simulated a subset of samples with true effects and the other subset of samples without effects. Figure 3 shows that heterogeneity may result in power loss in both the mixed-effects and random-effects models, implying that adding heterogeneous samples into a meta-analysis may reduce the power, rather than having the anticipated effect of increasing power due to increased sample size. Therefore, selecting samples with homogeneous effects may be at least as important as enlarging the sample size for a meta-analysis. This observation may help explain the inconsistent findings between GEFOS-1 (2) and GEFOS-2 (3) despite the fact that the latter included most samples in the former and approximately 3 times as many total samples.
Figure 3.
Power of a meta-analysis in heterogeneous populations. We simulated 17 studies (total sample size of 32 961 study subjects), 7 studies having phenotypic effects and 10 studies having no phenotypic effects. For simplicity, each sample was simulated with MAF of 0.3. Between-study variance was set at 0.6. Subset samples were those having effects, and total was total samples. The _F and _R denote fixed-effects and random-effects models for the meta-analysis. The significance level of a meta-analysis was set at 5 × 10⁻⁸. Power was estimated based on 10 000 replications.
Discussion
This study demonstrates that inconsistent finding across individual GWASs and meta-analyses are not unexpected. Although a meta-analysis can be powerful for the detection of more significant loci, its application should be executed with caution. To implement a meta-analysis, homogeneous populations and phenotypes are essential. Well-designed independent individual GWASs may yield new findings that may not necessarily be significant in a meta-analysis. Meta-analyses should not be regarded as the gold standard to evaluate other studies. Eventually the gold standard of validating the functional importance of significant genetic variants relies on in vivo or in vitro molecular functional mechanism studies.
Acknowledgments
This work was partially supported by grants from R01AR050496, R21AG027110, R01AG026564, R21AA015973, R01AR057049, and R03TW008221 from the National Institutes of Health and Specialized Center of Research Grant P50 AR055081 supported jointly by the National Institute of Arthritis and Musculoskeletal and Skin Diseases and the Office of Research on Women's Health. The study was also supported by grants from the National Science Foundation of China, the Ministry of Education of China, and Grant S30501 from the Shanghai Leading Academic Discipline Project.
Disclosure Summary: The authors have nothing to disclose.
Footnotes
- BMD
- bone mineral density
- GEFOS
- GEnetic Factors for OSteoporosis
- GWAS
- genome-wide association study
- MAF
- minor allele frequency
- SNP
- single-nucleotide polymorphism.
References
- 1. Richards JB, Zheng HF, Spector TD. Genetics of osteoporosis from genome-wide association studies: advances and challenges. Nat Rev Genet. 2012;13(8):576–588 [DOI] [PubMed] [Google Scholar]
- 2. Rivadeneira F, Styrkarsdottir U, Estrada K, et al. Twenty bone-mineral-density loci identified by large-scale meta-analysis of genome-wide association studies. Nat Genet. 2009;41(11):1199–1206 [DOI] [PMC free article] [PubMed] [Google Scholar]
- 3. Estrada K, Styrkarsdottir U, Evangelou E, et al. Genome-wide meta-analysis identifies 56 bone mineral density loci and reveals 14 loci associated with risk of fracture. Nat Genet. 2012;44(5):491–501 [DOI] [PMC free article] [PubMed] [Google Scholar]
- 4. Xiong DH, Liu XG, Guo YF, et al. Genome-wide association and follow-up replication studies identified ADAMTS18 and TGFBR3 as bone mass candidate genes in different ethnic groups. Am J Hum Genet. 2009;84(3):388–398 [DOI] [PMC free article] [PubMed] [Google Scholar]
- 5. Hsu YH, Zillikens MC, Wilson SG, et al. An integration of genome-wide association study and gene expression profiling to prioritize the discovery of novel susceptibility loci for osteoporosis-related traits. PLoS Genet. 2010;6(6):e1000977. [DOI] [PMC free article] [PubMed] [Google Scholar]
- 6. Richards JB, Rivadeneira F, Inouye M, et al. Bone mineral density, osteoporosis, and osteoporotic fractures: a genome-wide association study. Lancet. 2008;371(9623):1505–1512 [DOI] [PMC free article] [PubMed] [Google Scholar]
- 7. Styrkarsdottir U, Halldorsson BV, Gretarsdottir S, et al. Multiple genetic loci for bone mineral density and fractures. N Engl J Med. 2008;358(22):2355–2365 [DOI] [PubMed] [Google Scholar]
- 8. Speliotes EK, Willer CJ, Berndt SI, et al. Association analyses of 249 796 individuals reveal 18 new loci associated with body mass index. Nat Genet. 2010;42(11):937–948 [DOI] [PMC free article] [PubMed] [Google Scholar]
- 9. Thorleifsson G, Walters GB, Gudbjartsson DF, et al. Genome-wide association yields new sequence variants at seven loci that associate with measures of obesity. Nat Genet. 2009;41(1):18–24 [DOI] [PubMed] [Google Scholar]
- 10. Wen W, Cho YS, Zheng W, et al. Meta-analysis identifies common variants associated with body mass index in east Asians. Nat Genet. 2012;44(3):307–311 [DOI] [PMC free article] [PubMed] [Google Scholar]
- 11. Yang J, Ferreira T, Morris AP, et al. Conditional and joint multiple-SNP analysis of GWAS summary statistics identifies additional variants influencing complex traits. Nat Genet. 2012;44(4):369–373 [DOI] [PMC free article] [PubMed] [Google Scholar]
- 12. Ioannidis JP. Why most discovered true associations are inflated. Epidemiology. 2008;19(5):640–648 [DOI] [PubMed] [Google Scholar]
- 13. Kraft P. Curses—winner's and otherwise—in genetic epidemiology. Epidemiology. 2008;19(5):649–651 [DOI] [PubMed] [Google Scholar]
- 14. Higgins JP, Thompson SG, Spiegelhalter DJ. A re-evaluation of random-effects meta-analysis. J R Stat Soc Series A Stat Soc. 2009;172(1):137–159 [DOI] [PMC free article] [PubMed] [Google Scholar]


