

Abstract
C-Myc, a key regulator of cell cycle and proliferation, is commonly overexpressed in leukemia and associated with poor prognosis. Conventional antisense oligonucleotides targeting c-myc may attenuate leukemic cell growth, however, are poorly taken into cells, rapidly degraded, and have unwanted effects on normal cells. The c-myc promoter contains a guanine-rich sequence (PU27), capable of forming quadruplex (four-stranded) DNA, which may negatively regulate c-myc transcription, however, its biological significance is unknown. We show that treatment of leukemia with an oligonucleotide encoding the genomic PU27 sequence induces cell cycle arrest and death by oncotic-necrosis due to PU27-mediated suppression of c-myc mRNA/protein expression. Furthermore, PU27 is abundantly taken into cells, localized in the cytoplasm/nucleus, inherently stable in serum and intracellularly, and has no effect on normal cells. Suppression of c-myc expression by PU27 caused significant DNA damage, cell and mitochondrial swelling, and membrane permeability, characteristic of oncotic-necrosis. Induction of oncosis caused mitochondrial dysfunction, depletion of cellular ATP levels and enhanced oxidative stress. This novel anti-leukemic strategy addresses current concerns of oliginucleotide therapeutics including problems with uptake, stability, and unintentional effects on normal cells and is the first report of selective cancer cell killing by a genomic DNA sequence.
Keywords: c-myc, PU27, quadruplex, oncosis, leukemia
INTRODUCTION
The c-myc gene encodes a nuclear phosphoprotein with key regulatory roles in a wide array of cellular processes including the regulation of cell cycle progression, cell proliferation, differentiation, transformation, angiogenesis, and apoptosis (1–5). Normally, expression of c-myc is tightly regulated and closely correlated with proliferation. When cells are quiescent, c-myc is undetectable, however, upon growth factor stimulation, c-myc levels rapidly rise and sharply decrease as cells progress through the proliferative cycle (6). However, in a variety of human cancers, deregulation and inappropriate activation of c-myc commonly occurs as a consequence of chromosomal translocation, gene amplification, and increased transcription/translation resulting in pronounced c-myc gene amplification (7). In leukemia, aberrant c-myc expression imparts a proliferative advantage over normal cells causing a failure in cellular differentiation. Reducing c-myc expression with oligonucleotides (ODNs) may attenuate cell growth and represents a potential anti-leukemic approach.
Although blocking c-myc expression with ODNs induces differentiation of myelocytes and myeloid leukemia cells, their use is complicated by nuclease degradation in serum and intracellularly, poor uptake into cancer cells, and unwanted effects on normal cells. However, it was found that DNA sequences rich in guanines, capable of forming four-stranded structures known as quadruplexes, may be inherently stable in biological fluids and sufficiently taken into cells. The use of random G-rich quadruplex-forming ODNs as therapeutic agents have shown impressive anti-proliferative activity against a wide range of cancer cells, while being virtually non-toxic to normal cells (8, 9).
Recently, it has been shown that quadruplex sequences are represented disproportionately in biologically important regions of the genome such as telomeres and in the promoters of growth regulatory genes (10). Tumor suppressors tend to possess low quadruplex-forming potential, while oncogenes such as c-myc have a high generation of tetrahelical domains (11). The c-myc quadruplex-forming sequence, PU27, is a 27-base-pair sequence comprising five regions of consecutive runs of guanines within the non-coding strand. It is located −142 to 115 bp upstream of the P1 and P2 promoters within the nuclear hypersensitivity element III1 (NHE III1), which controls 80–90% of c-myc transcription (12, 13). This DNA duplex element can slowly equilibrate between transcriptionally active forms (duplex and single-stranded) to a silenced form (14). Single G to A mutations within PU27 destabilize quadruplex formation and induce a 3-fold increase in transcriptional activity suggesting a role for quadruplexes in gene regulation and that their formation may be critical for transcriptional silencing (15–17).
It has been proposed that formation of quadruplex structure upstream of the c-myc promoter may play a role in modulating c-myc transcription, however, the biological implications of the PU27 sequence are currently unknown. This study characterizes the biological role of the PU27 genomic quadruplex-forming promoter sequence on the regulation of c-myc transcription and proposes that exogenous addition of synthetic PU27 ODNs induces leukemic cell death by downregulating c-myc expression.
MATERIALS AND METHODS
General
U937 (acute myelogenous), HL60 (acute myelogenous), K562 (chronic myelogenous), CCRF-CEM (acute lymphocytic), and MOLT-4 (acute lymphoblastic) leukemia cells and CA46 and Raji (Burkitt’s) lymphoma cells (ATCC, USA, identity confirmed by STR analysis, isoenzymology, and cytochrome C subunit PCR assay) were maintained in RPMI media supplemented with 10% FBS and 100U penicillin/streptomycin at 5% CO2 and 37°C. Stromal cells derived from umbilical cord blood were maintained under the same conditions in DMEM media with 10% FBA and 100U penicillin/streptomycin. The following ODNs were used: PU27 5′TGGGGAGGGTGGGGAGGGTGGGGAAGG 3′ and MutPU27 5′TGAGTAGCGTGAGCAGAGTGCGTAACG 3′. Synthesized ODNs (Oligos Etc.) were dissolved in RNAse/DNAse free ultrapure dH2O to a stock concentration of 500μM and boiled at 95°C for 5 min. Cells in logarithmic phase (2X10⁵ cells/ml) were treated with 10μM PU27 (final concentration unless otherwise specified) or the respective mutant control ODN, MutPU27, for various time intervals and used for subsequent biochemical analysis.
MTT Assay
Cell proliferation of all leukemia cell lines and non-transformed stromal cells were assessed by 3-(4,5-dimethylthiazol-2yl)-2,5-diphenyltetrazolium bromide (MTT) assay. Cells were treated in a 96-well plate with 1μM-15μM PU27 or MutPU27 for 72 h (5X10³ cells/well) or 6 days (1X10³ cells/well). MTT reagent (100μg/ml PBS) was added and cells were incubated at 37°C and 5% CO2. After 4 h, cells were lysed and the formazan product was detected at 570 nm.
Circular Dichroism Spectroscopy
PU27 and MutPU27 ODNs were annealed by boiling for 5 minutes, adding physiological buffer to final concentrations of 20mM KH2PO4 dibasic, 120mM KCl, 5mM MgCl2, and slow cooling to room temperature. Annealed ODNs were dissolved in physiological buffer at a concentration giving an absorbance at 260 nm of 0.8 (about 5μM). Structures of ODNs in solution were determined using circular dichroism spectroscopy (CD). Spectra were recorded on a Jasco-810 spectropolarimeter (Jasco, Easton, MD), using a quartz cell of 1 mm optical path length, an instrument scanning speed of: 200 nm/min, response time of 2 sec, and over a wavelength range of 340 nm to 220 nm. The spectra are representative of 3 average scans taken at 25°C and were baseline corrected for signal contributions due to buffer.
Analysis of PU27 and MutPU27 Uptake
Cellular uptake of PU27 or MutPU27 was analyzed by FACS, Amnis Image Stream, and confocal microscopy analysis. U937 cells were incubated with 10μM of FITC-labeled PU27 or MutPU27 for 1–72 h, washed with PBS, and analyzed immediately. For Amnis Image Stream analysis, a FACS method for imaging individuals cells as they pass through a detector, cells incubated with FITC-labeled PU27 or MutPU27 were fixed with 3% paraformaldehyde, washed with PBS, and stained with the nuclear DRAQ 5 stain. Intensity of intracellular FITC-labeled ODNs and nuclear translocation (co-localization of FITC and DRAQ) were assessed.
ODN uptake was also compared in U937 cells and non-transformed stromal cells by confocal microscopy to determine if uptake is exclusive to cancer cells. U937 or stromal cells were treated for 72 h with FITC-labeled PU27 or MutPU27, washed with PBS, fixed in 4% paraformaldehyde, and visualized by confocal microscopy with an Olympus Fluoview FV500 laser scanning confocal microscope.
Cell Cycle Analysis
U937 cells treated with PU27 or MutPU27 for 6–72 h were collected and washed in PBS. Isolated nuclei were stained with propidium iodide (CycleTest™ Plus DNA Reagent, BD Biosciences) and analyzed by FACS analysis.
Serum and Intracellular Stability of PU27
PU27 and MutPU27 were end labeled using [γ-32P]-dATP with T4 polynucleotide kinase and incubated in RPMI medium with 10% FBS at 37°C or in the presence of U937 nuclear or cytoplasmic (S100) cell extract for 0–72 h. Cold PU27 or MutPU27 were added to give a final ODN concentration of 10μM. After heating in 98% formamide buffer at 65°C, ODNs were run on a 12% denaturing gel and analyzed by autoradiography.
RT-PCR
Total RNA was extracted from U937 cells using TriZol® (Invitrogen) reagent according to manufacturer’s instructions. RNA purity was determined by A260/A280 ratio and quantified by A260. Preparation of cDNA and forward and reverse primers for c-myc and β- actin were as previously described (18). RT-PCR was performed for a uniform amount of cDNA using the Fast 7500 System (Applied Biosystems). Reactions were diluted 1:2 with SYBR Green I Master Mix (Applied Biosystems) and amplification by PCR was as follows: 1 repetition at 50ºC for 2 min., 1 repetition at 95ºC for 10 min., and 40 repetitions of 95ºC for 15 sec. and 60ºC for 1 min. A no template control reaction was run for each gene to control for DNA contamination of RNA extracts. A dissociation curve was performed to provide evidence for a single reaction product. Message of c-myc in PU27-treated cells was compared to untreated cells collected at the same time point to calculate an expression ratio.
Western Blot Analysis
Total cell lysates were separated by 4–15% SDS-Tris PAGE and electroblotted onto PVDF membranes. The membranes were blocked in 5% non-fat dry milk and incubated overnight at 4°C with c-myc antibodies (Santa Cruz Biotechnology). After washing, the membranes were incubated with a horseradish peroxidase (HRP)-conjugated secondary antibody. Proteins were visualized by standard chemiluminescence (ECL) methods (GE Healthcare). Equal loading of proteins was verified by probing the membrane with a mouse monoclonal anti-β-actin primary antibody (Santa Cruz Biotechnology).
DNA Tunnel Assay
DNA strand breaks occurring during cleavage of DNA were measured with DNA Tunnel assay per manufacturer’s instructions (Roche Applied Science). DNA strand breaks were labeled with terminal deoxynucleotidyl transferase (TDT), which catalyzes polymerization of labeled nucleotides to free 3′-OH DNA ends in a template-independent manner. Incorporated fluorescein was detected by microscopy. Positive (cells treated with DNAse I) and negative (no TDT treatment) controls were performed in parallel.
Electron Microscopy
U937 cells treated with 10μM PU27 or MutPU27 for 72 h were collected, washed in cacodylate buffer, and immediately fixed in 3% glutaraldehyde in cacodylate buffer pH 7.4 ov -fixation in 1% OsO4 in cacodylate buffer, cell pellets were dehydrated in graded ethanol, embedded, and sections were cut (80 μm) with an ultramicrotome. Sections were stained with saturated aqueous uranium acetate and lead citrate and viewed with a Philips CM12 electron microscope operating at 60 KV.
Annexin V/PI Staining and Mitocapture™
After treatment with PU27 or MutPU27, cells were collected, washed with PBS, and incubated in binding buffer containing Annexin-V Fluorescein Isothiocyanate (FITC) conjugate and propidium iodide (PI) according to manufacturer’s instructions (Apoptosis Detection Kit, Biovision). Annexin V binds to phosphatidylserine extruded on the surface of apoptotic cells, while PI is impermeable to viable cells and identifies cells with compromised plasma membranes. Changes in mitochondrial membrane potential were measured with the Mitocapture Mitochondrial Apoptosis Detection kit (Mitocapture™, Biovision), which uses a cationic dye fluorescing red in healthy mitochondrial membrane impermeable cells and green in dying mitochondrial membrane-permeable cells. All samples were analyzed by FACS.
Detection of Reactive Oxygen Species (ROS)
ROS generation was assessed as previously described (18) by 2′, 7′-dichlorofluorescin diacetate (DCFH-DA) (Sigma Chemical), a lipid– permeable non-fluorescent compound that when oxidized by intracellular reactive oxygen species (ROS), forms the fluorescent compound 2′, 7′-dichlorofluorescein (DCF). U937 cells were plated in phenol-red free RPMI containing 10μM DCFH-DA and treated with PU27 or MutPU27. After 24 or 72 h, the culture media and cells were collected. The media was saved and the cells were washed with phenol-red free media and lysed in RIPA buffer. The fluorescence of DCF in lysates and media was read in a black plate at 538 nm emission and 485 nm excitation and the values were standardized by lysate protein concentration. Negative controls containing DMSO instead of DCFH-DA showed negligible fluorescence.
ATP detection
Media ATP was determined by a luminescence assay system according to manufacturer’s instructions (Promega). Culture media from cells treated with PU27 for 24 or 72 h was collected and trichloroacetic acid was added to final concentration of 0.5% and kept at 4°C for 30 min. The media was neutralized with 4 volumes of 250mM Tris acetate (pH 7.75) and mixed with luciferin/luciferase ATP assay reagents. Luminescence was measured with a Zylux Femtometer FB12 luminometer and the resulting relative light units were standardized by cell number and expressed as a percentage of untreated cells.
Data Analysis
All values represent mean ± SEM. Differences between treatments were determined by a non-paired t-test (2-tailed) using Sigma Stat software 3.5. A probability level of p < 0.05 was used to indicate statistical significance.
RESULTS
PU27 forms a parallel quadruplex in solution
To characterize the secondary structure of PU27 and MutPU27, ODNs were analyzed by CD spectroscopy. PU27 formed a quadruplex in physiological buffer, represented by a peak absorbance at 260 nm and a trough absorbance at 240 nm (Fig. 1B). The mutant PU27 sequence did not form a quadruplex in solution.
Figure 1.

A. Hydrogen bonding arrangements of guanine nucleotides (left). Guanine-rich DNA with at least four tracts of 2–4 guanines fold into square planar arrangements of 4 guanines bonded cyclically to form quadruplex secondary structures (center). Location of the genomic c-myc quadruplex-forming sequence (PU27), upstream of the P1/P2 promoter (right).
B. PU27 forms a quadruplex in physiological solution. Circular dichrosim spectroscopy of PU27 and MutPU27 oligonucleotides. Peak absorbance at 260 nm and trough absorbance of PU27 at 240 nm are indicative of quadruplex formation, compared to the MutPU27 sequence, which did not form a quadruplex.
PU27 inhibits leukemic cell proliferation
Treatment of U937 cells with 1–15μM PU27 for 24–144 h caused a dose and time dependent decrease in cell proliferation, culminating to 100% inhibition after 144 h with 10 and 15 μM and more than 90% inhibition with 5μM (Fig. 2A). Little change in cell proliferation occurred with MutPU27 treatment. Non-transformed stromal cells derived from human cord blood were treated identically to determine if the anti-proliferative activity of PU27 is cancer cell specific (Fig. 2B). No significant change in stromal cell proliferation was noted in response to PU27 (up to 15μM) after 72 h or 144 h of treatment. This suggests that growth inhibition by PU27 may be specific for leukemia cells but not non-transformed stromal cells. The effect of PU27 or MutPU27 dose-escalation (1–15 μM) on cell proliferation was also compared in 7 leukemic cell lines (U937, HL60, CA46, K562, Raji, Molt-4, and CCRF-CEM) after 72 h and 144 h (Fig. 2C–F). There was significant dose-dependent inhibition of cell proliferation with PU27 in all 7 leukemic cell lines after 72 h and 144 h compared to untreated and cells treated with MutPU27. IC50 values after 144 h were: U937 < 5μM, HL60 < 5μM, K562 < 5μM, Raji < 1μM, CA46 < 1μM, Molt-4 < 5μM, and CCRF-CEM < 3μM). Little change was noted with MutPU27, however, some cell lines (Raji, CA46, CCRF-CEM) responded to the highest concentrations.
Figure 2.
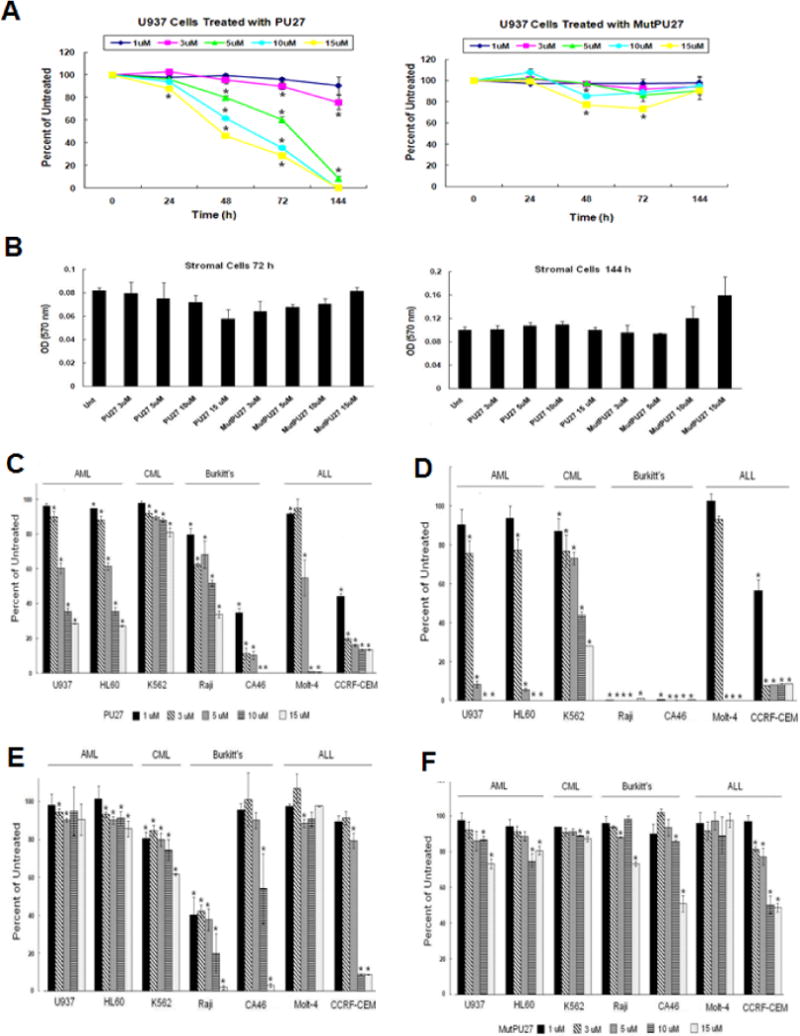
A&B. PU27 inhibits U937 but not stromal cell proliferation. Dose response of U937 acute myeloid leukemia cells to PU27 or MutPU27 after 24–144 h (A) and non-transformed stromal cells after 72–144 h (B) determined by MTT assay. Bars represent mean ± SEM absorbance of three separate determinations. * indicates (p < 0.05)
C–F. PU27 inhibits cell proliferation of multiple leukemia cell lines. Dose response of AML, CML, Burkitt’s, and ALL leukemia cell lines to PU27 after 72 h (C) or 144 h (D) or MutPU27 after 72 h (E) or 144 h (F) determined by MTT assay. Bars represent mean ± SEM absorbance of three separate determinations. * indicates (p < 0.05)
Cellular uptake of PU27 and MutPU27
FITC-PU27 was immediately taken into cells after 1 h, with increased uptake after 72 h (Fig. 3A). FITC-MutPU27 was minimally taken into cells after 1 h, with little change in uptake after 72 h. Confocal microscopy confirmed these results, showing marked uptake of FITC-PU27 (cytoplasmic and nuclear) into U937 cells after 72 h, while FITC-MutPU27 was virtually undetectable at the same intensity settings (Fig. 3B). Although FITC-PU27 was prominently taken into non-transformed stromal cells, it appeared largely localized in the cytoplasm (Fig. 3C). Thus, PU27 was rapid internalized compared to MutPU27 and appears to be largely localized in the nucleus.
Figure 3.

A–C. Cellular uptake of PU27 or MutPU27 in U937 and stromal cells. Uptake of FITC-labeled PU27 or MutPU27 (10μM) after 1 h or 72 h determined by FACS analysis (A). Confocal microscopy analysis of U937 (B) or non-transformed stromal cells (C) treated with 10 μM FITC-labeled PU27 or MutPU27 after 72 h. In microscopy analysis, cell nuclei were stained with DAPI. Note significant uptake of PU27 compared to MutPU27 in U937 and stromal cells.
D. FACS Image Stream analysis of PU27 or MutPU27 uptake. Single cell uptake of FITC-labeled PU27 or MutPU27 (10μM) after 6–72 h. Cells were fixed and stained with DRAQ nuclear stain (pink). Note significant uptake (green) and nuclear translocation (yellow) of PU27 compared to MutPU27.
Amnis Image Stream was used to quantify the percentage of cells taking up FITC-PU27 and its subcellular localization. FITC-PU27 uptake was significantly greater compared to FITC-MutPU27, with 54% of cells taking up FITC-PU27 after 6 h and 98% of cells after 24 h compared to 2% and 61% respectively of FITC-MutPU27 (Fig. 3D). After 24 h, 52% of cells had PU27 co-localized in the nucleus while only 3% of cells treated with MutPU27 had colocalization. However, after 72 h, 100% of cells had PU27 or MutPU27 translocated in the nucleus.
Increased cell size with PU27 treatment
To determine whether treatment with PU27 caused a change in cell size, Amnis Image Stream was used to assess the size of U937 cells treated with PU27 or MutPU27. There was no difference in cell size with PU27 treatment after 6 or 24 h (6 h: 9.44μm; 24 h: 10.66μm) compared to MutPU27 (6 h: 8.88μm; 24 h: 10.14μm). However, PU27 treatment significantly increased cell size (13.44μm) compared to MutPU27 (10.34μm) after 72 h. This size change is likely related to cell swelling and induction of cell death by PU27.
Serum and intracellular stability of PU27
Since the therapeutic utility of ODNs is limited by their susceptibility to nuclease degradation, we examined the stability of PU27 in serum and intracellularly. PU27 was inherently stable in serum and intracellularly (nucleus and cytoplasm) up to 72 h compared to MutPU27, which significantly degraded after 4 h (Fig. 4A). This remarkable increase in stability is undoubtedly related to nuclease resistance of quadruplex DNA.
Figure 4.

A. Serum and Intracellular stability of the PU27 and MutPU27 oligonucleotides. 32P-labeled PU27 and MutPU27 sequences were incubated in RPMI media at 37°C with 10% FBS (A), U937 S100 extract (B), or U937 nuclear extract (C) for 0–72 h. Greater serum and intracellular stability occurred with PU27 compared to MutPU27. Note significant degradation of MutPU27 after 4 h.
B. PU27 treatment induces G0/G1cell cycle arrest. Cell cycle analysis of U937 cells in response to 10 μM PU27 (blue) or MutPU27 (green) treatment after 6–72 h determined by FACS analysis.
C&D. PU27 treatment increases annexin and propidium iodide positive stained U937 cells and DNA fragmentation. Treatment with 10μM PU27 not MutPU27 for 24–72 h induced a significant increase in both annexin positive only cells (lower right quadrant) and annexin/PI positive cells (upper right quadrant) (A). DNA fragmentation was induced in PU27-treated but not MutPU27-treated cells as determined by TUNEL staining and fluorescent microscopy (B).
E. Electron micrographs of PU27-treated cells. Untreated U937 cells (A&B) and U937 cells treated with 10μM PU27 for 72 h (C-F). Morphological features of PU27 treatment included diffuse cell swelling, plasma membrane rupture, chromatin clumping along the nuclear envelope (arrow CC), widespread vacuolization (arrow V), swollen mitochondria (arrow A), and autophagic vacuolization (arrow AV) characteristic of oncotic-necrosis (original magnification-7100X-A,D,E,F; 3400X-B,C). Note the pronounced size of PU27-treated cells compared to untreated cells (frame C compared to frame B respectively).
PU27 causes G0/G1 cell cycle arrest
To examine whether the anti-proliferative effect of PU27 was partially due to cell cycle perturbation, changes in the cell cycle after 6–72 h were determined. PU27 treatment arrested cells in G0/G1 after 24 h, which continued through 72 h (Fig. 4B). Increased G0/G1 arrest was associated with a small shift in FL-2A (PI) staining, coincident with the increase in cell size.
Annexin V and PI staining
PU27 treatment significantly increased staining of annexin positive cells after 24 h (31.5%) and annexin/PI positive cells (14.4%) compared to untreated and MutPU27 treatment (Fig. 4C). Although 25.9% of cells stained annexin positive with PU27 after 72 h, a significantly larger proportion stained annexin/PI positive (64.1%).
DNA fragmentation
Although no DNA fragmentation (TUNEL staining) was measured after 24 h, PU27 treatment for 72 h caused significant fragmentation compared to untreated or MutPU27 treatment (Fig. 4D).
Electron microscopy
PU27 treatment for 72 h caused diffuse cell swelling, blister formation, condensation of chromatin into irregular clumps, and a compromised cell membrane, all characteristic of oncosis (Fig. 4E). Ultrastructural damage included significant mitochondrial swelling, widespread cytoplasmic vacuolization, and the appearance of autophagic fluid-filled vacuoles.
Mitochondrial transmembrane potential/ROS formation/ATP levels
Treatment with PU27 for 24 h increased mitochondrial membrane permeability, which indicated dissipation of the transmembrane potential (Fig. 5A). This was demonstrated by a pronounced shift from red to green fluorescence of the cationic dye with PU27 compared to untreated or MutPU27 treatment. The PU27-induced decrease in mitochondrial transmembrane potential after 24 h corresponded with reduced cellular ATP production and greater total ROS production after 72 h, indicated by greater oxidation of DCFH-DA (Figs. 5B&C).
Figure 5.
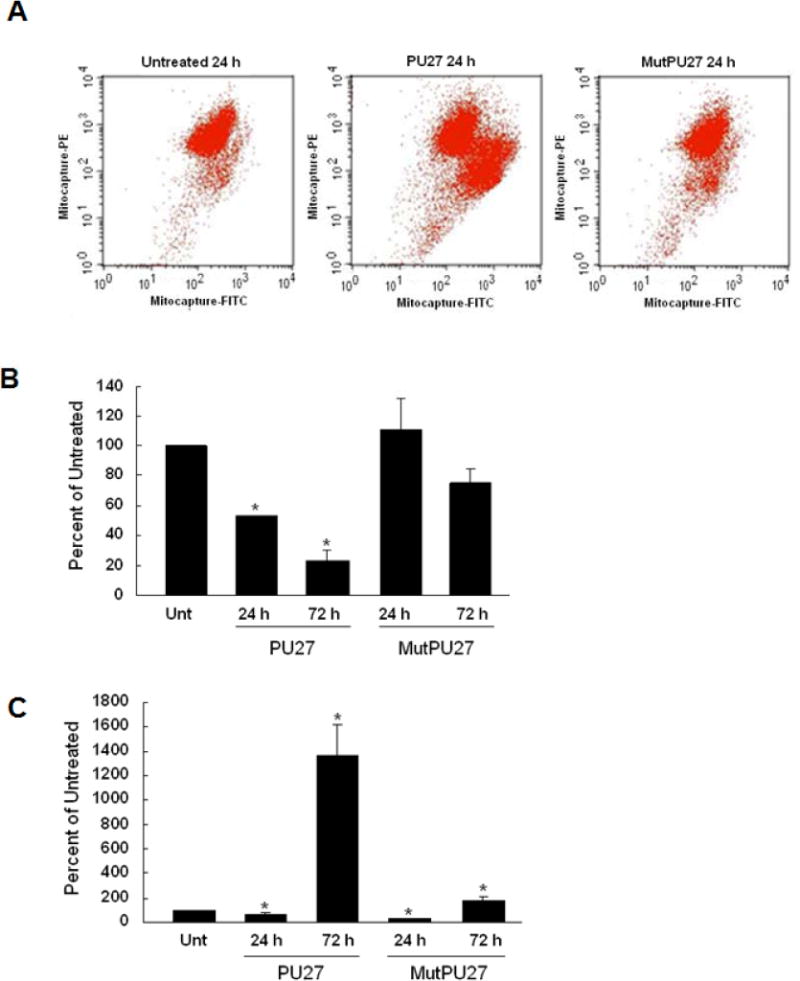
A–C. PU27 treatment decreases mitochondrial membrane potential and ATP production, increasing reactive oxygen species production (ROS). Changes in U937 mitochondrial membrane potential (A), ATP production (B), or ROS generation (C) were measured after 24 h–72 h treatment with 10μM PU27 or MutPU27. PU27 treatment induced a shift from red (mitocapture-PE) to green (mitocapture-FITC) fluorescence, denoting dissipation of mitochondrial membrane potential. A significant loss in ATP production occurred after 24 h of PU27 treatment, which fell further after 72 h. This corresponded with massive ROS generation after 72 h. Bars represent mean ± SEM absorbance of three separate determinations. * indicates (p < 0.05).
PU27 inhibits c-myc expression
PU27 treatment significantly decreased c-myc mRNA after 6 h compared to untreated cells. These levels continued to fall through 48 h, culminating to a 90% decrease after 72 h (Fig 6A). This is in marked contrast to cells treated with MutPU27, which showed little change in c-myc mRNA from 6–48 h and a slight increase at 72 h.
Figure 6.
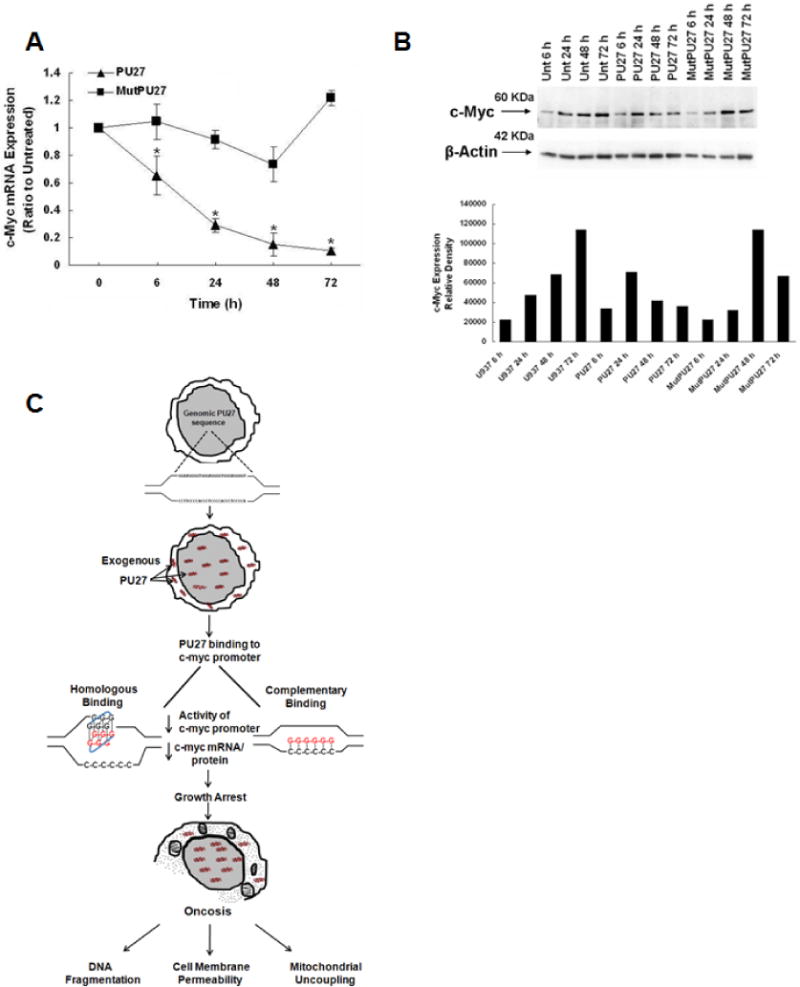
A&B. PU27 treatment decreases c-myc mRNA and protein expression. Time course of c-myc mRNA (A) and c-myc protein expression (B) after 6–72 h of 10 μM PU27 or MutPU27 treatment as determined by RT-PCR. Note over 90% decrease in c-myc mRNA and 60% decrease in protein expression after 72 h of PU27. Bars are a representation of three separate experiments.
C. Summary of proposed mechanism of PU27-mediated cell death. PU27 is a guanine-rich genomic sequence located upstream of the P1/P2 promoters of c-myc. U937 leukemia cells were treated exogenously with an oligonucleotide encoding PU27, which localizes in both the cytoplasm and nucleus. After nuclear translocation, PU27 binds to the homologous guanine-rich strand or the complementary strand upstream of the c-myc promoter leading to decreased c-myc promoter activity and subsequent c-myc mRNA and protein expression. This results in a G0/G1 growth arrest, inducing oncotic cell death, characterized by DNA fragmentation, cell membrane permeability, and mitochondrial uncoupling.
In general, c-myc protein expression paralleled c-myc mRNA levels. No changes in c-myc expression were measured after 6 h of PU27 treatment, however, a significant decrease in c-myc occurred after 48 and 72 h compared to untreated and MutPU27, coincident with the decrease in c-myc mRNA (Fig. 6B). This is in contrast to untreated and MutPU27-treated cells, which showed an increase in c-myc expression over time.
Summary of the proposed mechanism of PU27-mediated cell death in leukemia cells (Fig. 6C)
DISCUSSION
The promoters of several cancer-related genes, such c-myc, contain a disproportionate number of sequences within nuclease hypersensitivity regions that are capable of forming quadruplex (four-stranded) DNA (10). There is strong evidence that the quadruplex-forming sequence within the c-myc promoter, PU27, plays an important role in downregulation of c-myc transcription, however, the biological significance of PU27 is currently unknown.
Although inhibition of gene expression has proven effective in promoting tumor regression in animal models, many biological barriers exist which prevent this approach from being used therapeutically. Conventional ODNs can be rapidly degraded by DNases and serum nucleases in biological fluids (19), are poorly transported into human cells (20), and have unwanted effects on normal cells (21). ODN uptake into hematological cells is especially poor, as leukemic cells are often more resistant to uptake enhancement strategies (22). This study introduces a unique strategy for abrogating c-myc expression in leukemia that addresses all of the current limitations of ODN therapy. We used the genomic c-myc promoter sequence to treat leukemia cells in the absence of any uptake enhancement strategy and have shown that it is nontoxic to normal cells, abundantly taken up by leukemia cells, is remarkably stable in serum and intracellularly, and has potent anti-leukemic activity in a variety of leukemia cells.
We have demonstrated that PU27 has potent biological activity in multiple leukemia cell lines, causing significant dose-dependent inhibition of cell proliferation after 72 h and 6 days. PU27 is remarkably resistant to nuclease degradation in serum and in the presence of cellular extracts and is abundantly taken into cells after 1 h in comparison to the mutant sequence, colocalizing in both the nucleus and cytoplasm. The cellular internalization and stability of PU27 is further demonstrated by the prominent uptake and visualization of FITC-labeled PU27 after over 14 days (unpublished results). Although PU27 was taken up by non-transformed stromal cells, no change in cell growth occurred after 6 days, suggesting that the anti-proliferative effects of PU27 may be specific for transformed cells and have no adverse effects on normal cells. These results are consistent with previous studies, which demonstrated that quadruplex-forming ODNs often show enhanced cellular uptake into cells, form inherent nuclease resistant structures, and have minimal effects on normal cells (23, 9). In general, G-quadruplex DNA has also been shown to accumulate and have greater retention in the nucleus compared to unstructured ODNs (24), which may be due to binding of specific targets inside the nucleus and/or G-quadruplex binding proteins (25).
Coincident with the anti-proliferative effect of PU27, treatment of U937 cells with PU27 induced prominent G0/G1 cell cycle arrest beginning at 24 h concurrent with significant attenuation of c-myc mRNA and protein expression. This is consistent with previous studies which showed that treatment of U937 cells with a small molecule c-myc inhibitor markedly reduced c-myc protein expression after 24 h, inducing G0/G1 cell cycle arrest (26). Inhibition of HL60 acute myeloblastic leukemia cells with antisense c-myc fragments also effectively induced G0/G1 cell cycle arrest after 48 h, accompanied by reduced c-myc mRNA and protein expression (3). Therefore, downregulation of c-myc is an important early event related to growth arrest and occurs in a variety of cell types (27, 28).
In conjunction with G0/G1 cell cycle arrest, treatment with PU27 induced cell death which was accompanied by a significant increase in staining of annexin positive cells and a larger proportion of both annexin and propidium iodide positive cells as well as significant DNA damage (29–31). Although these results initially suggest an apoptotic cell death, exposure of phosphatidyserine on the cell surface (recognized by annexin V) and TUNEL positive staining for DNA damage also occurs in oncotic-necrosis (32). Oncotic-necrosis is a pro-inflammatory pathway accompanied by cell and organelle swelling (oncosis) and significant membrane permeability (necrosis), a process of cell death related to oxidative stress and energy depletion that is morphologically and biochemically distinct from apoptosis. Apoptosis and oncosis can coexist or cells may transition from apoptosis to oncosis depending on their threshold for sustaining ion homeostasis and ATP production (32). Inhibition of glycolysis and ATP synthesis in mitochondria and increased plasma membrane permeability inactivates Na+/K+-ATPase causing accumulation of intracellular Na+ accompanied by Cl− and water and increased intracellular Ca2+ from decreased Na+/Ca2+ exchange causing significant cell swelling (33). Analysis of PU27-treated cells by electron microscopy showed diffuse cell and organelle swelling, a compromised cell membrane with surface blebs and blisters, and significant ultrastructural damage including widespread cytoplasmic vacuolization, characteristic of oncotic-necrosis, and autophagic fluid-filled vacuoles. This is much different from a non-inflammatory apoptotic cell death, which is characterized by nuclear and cytoplasmic condensation, formation of apoptotic bodies, and maintenance of an intact plasma membrane (34).
In this study, induction of oncotic-necrosis corresponded with significant changes in cellular energetics as demonstrated by early disruption of mitochondrial membrane potential leading to suppression of ATP synthesis and ROS formation. This is consistent with c-myc’s role in mitochondrial biogenesis and regulation of glucose metabolism. c-Myc transcriptionally upregulates target glycolytic genes involved in aerobically converting glucose to lactate (35, 36). Cell death by oncosis has previously been shown to occur in U937 cells in response to NaN3, a chemical blocking ATP production at complex IV of the mitochondria inducing oxidative stress (32) as well as in K562 chronic myelogenous leukemia cells in response to sanguinarine (37) or arsenic trioxide (38).
Therefore, our studies suggest that treatment of U937 leukemia cells with exogenous addition of the genomic 27 bp PU27 sequence induces G0/G1 growth arrest and cell death by oncosis through a mechanism involving inhibition of c-myc mRNA and protein expression. Significant c-myc suppression corresponded with prominent mitochondrial dysfunction leading to loss of ATP production and enhanced oxidative stress. The nature of PU27-mediated inhibition of c-myc and its affiliation with the endogenous c-myc promoter is currently under investigation and may be related to either binding of PU27 to the quadruplex-forming homologous sequence upstream of the c-myc promoter or binding to the non-quadruplex-forming, complementary strand. This study represents a promising therapy for the treatment of multiple forms of leukemia and is the first report of selective cancer cell killing by a genomic DNA sequence.
Acknowledgments
The authors would like to thank Cathie G. Caple for assistance with electron microscopy sample preparation, Katherine Richardson Hobbing for assistance with mitochondrial potential measurements, and Magdelena Dailey and Nichola Garbett for assistance with CD spectroscopy. We would also like to thank Magdalena Kucia for assistance with stromal cell experiments.
References
- 1.McGuffie EM, Pacheco D, Carbone GM, Catapano CV. Antigene and antiproliferative effects of a c-myc-targeting phosphorothioate triple helix-forming oligonucleotide in human leukemia cells. Cancer Res. 2000 Jul 15;60(14):3790–9. [PubMed] [Google Scholar]
- 2.Dang CV. c-Myc target genes involved in cell growth, apoptosis, and metabolism. Mol Cell Biol. 1999 Jan;19(1):1–11. doi: 10.1128/mcb.19.1.1. [DOI] [PMC free article] [PubMed] [Google Scholar]
- 3.Chen JP, Chen L, Leek J, Lin C. Antisense c-myc fragments induce normal differentiation cycles in HL-60 cells. Eur J Clin Invest. 2006 Jan;36(1):49–57. doi: 10.1111/j.1365-2362.2006.01589.x. [DOI] [PubMed] [Google Scholar]
- 4.Cole MD, McMahon SB. The Myc oncoprotein: a critical evaluation of transactivation and target gene regulation. Oncogene. 1999 May 13;18(19):2916–24. doi: 10.1038/sj.onc.1202748. [DOI] [PubMed] [Google Scholar]
- 5.Dang CV, O’Donnell KA, Zeller KI, Nguyen T, Osthus RC, Li F. The c-Myc target gene network. Semin Cancer Biol. 2006 Aug;16(4):253–64. doi: 10.1016/j.semcancer.2006.07.014. [DOI] [PubMed] [Google Scholar]
- 6.Obaya AJ, Mateyak MK, Sedivy JM. Mysterious liaisons: the relationship between c-Myc and the cell cycle. Oncogene. 1999 May 13;18(19):2934–41. doi: 10.1038/sj.onc.1202749. [DOI] [PubMed] [Google Scholar]
- 7.Nesbit CE, Tersak JM, Prochownik EV. MYC oncogenes and human neoplastic disease. Oncogene. 1999 May 13;18(19):3004–16. doi: 10.1038/sj.onc.1202746. [DOI] [PubMed] [Google Scholar]
- 8.Bates PJ, Kahlon JB, Thomas SD, Trent JO, Miller DM. Antiproliferative activity of G-rich oligonucleotides correlates with protein binding. J Biol Chem. 1999 Sep 10;274(37):26369–77. doi: 10.1074/jbc.274.37.26369. [DOI] [PubMed] [Google Scholar]
- 9.Bates PJ, Choi EW, Nayak LV. G-rich oligonucleotides for cancer treatment. Methods Mol Biol. 2009;542:379–92. doi: 10.1007/978-1-59745-561-9_21. [DOI] [PubMed] [Google Scholar]
- 10.Huppert JL, Balasubramanian S. G-quadruplexes in promoters throughout the human genome. Nucleic Acids Res. 2007;35(2):406–13. doi: 10.1093/nar/gkl1057. [DOI] [PMC free article] [PubMed] [Google Scholar]
- 11.Eddy J, Maizels N. Gene function correlates with potential for G4 DNA formation in the human genome. Nucleic Acids Res. 2006;34(14):3887–96. doi: 10.1093/nar/gkl529. [DOI] [PMC free article] [PubMed] [Google Scholar]
- 12.Hurley LH, Von Hoff DD, Siddiqui-Jain A, Yang D. Drug targeting of the c-MYC promoter to repress gene expression via a G-quadruplex silencer element. Semin Oncol. 2006 Aug;33(4):498–512. doi: 10.1053/j.seminoncol.2006.04.012. [DOI] [PubMed] [Google Scholar]
- 13.Yang D, Hurley LH. Structure of the biologically relevant G-quadruplex in the c-MYC promoter. Nucleosides Nucleotides Nucleic Acids. 2006;25(8):951–68. doi: 10.1080/15257770600809913. [DOI] [PubMed] [Google Scholar]
- 14.Collins I, Weber A, Levens D. Transcriptional consequences of topoisomerase inhibition. Mol Cell Biol. 2001 Dec;21(24):8437–51. doi: 10.1128/MCB.21.24.8437-8451.2001. [DOI] [PMC free article] [PubMed] [Google Scholar]
- 15.Eddy J, Vallur AC, Varma S, Liu H, Reinhold WC, Pommier Y, et al. G4 motifs correlate with promoter-proximal transcriptional pausing in human genes. Nucleic Acids Res. 2011 Mar 3;39(12):4975–83. doi: 10.1093/nar/gkr079. [DOI] [PMC free article] [PubMed] [Google Scholar]
- 16.Seenisamy J, Rezler EM, Powell TJ, Tye D, Gokhale V, Joshi CS, et al. The dynamic character of the G-quadruplex element in the c-MYC promoter and modification by TMPyP4. J Am Chem Soc. 2004 Jul 21;126(28):8702–9. doi: 10.1021/ja040022b. [DOI] [PubMed] [Google Scholar]
- 17.Simonsson T, Pribylova M, Vorlickova M. A nuclease hypersensitive element in the human c-myc promoter adopts several distinct i-tetraplex structures. Biochem Biophys Res Commun. 2000 Nov 11;278(1):158–66. doi: 10.1006/bbrc.2000.3783. [DOI] [PubMed] [Google Scholar]
- 18.Sedoris KC, Thomas SD, Miller DM. Hypoxia induces differential translation of enolase/MBP-1. BMC Cancer. 2010 Apr 22;10:157. doi: 10.1186/1471-2407-10-157. [DOI] [PMC free article] [PubMed] [Google Scholar]
- 19.Giles RV, Spiller DG, Green JA, Clark RE, Tidd DM. Optimization of antisense oligodeoxynucleotide structure for targeting bcr-abl mRNA. Blood. 1995 Jul 15;86(2):744–54. [PubMed] [Google Scholar]
- 20.Clark RE. Antisense therapeutics in chronic myeloid leukaemia: the promise, the progress and the problems. Leukemia. 2000 Mar;14(3):347–55. doi: 10.1038/sj.leu.2401677. [DOI] [PubMed] [Google Scholar]
- 21.Vaerman JL, Moureau P, Deldime F, Lewalle P, Lammineur C, Morschhauser F, et al. Antisense oligodeoxyribonucleotides suppress hematologic cell growth through stepwise release of deoxyribonucleotides. Blood. 1997 Jul 1;90(1):331–9. [PubMed] [Google Scholar]
- 22.Kronenwett R, Steidl U, Kirsch M, Sczakiel G, Haas R. Oligodeoxyribonucleotide uptake in primary human hematopoietic cells is enhanced by cationic lipids and depends on the hematopoietic cell subset. Blood. 1998 Feb 1;91(3):852–62. [PubMed] [Google Scholar]
- 23.Choi EW, Nayak LV, Bates PJ. Cancer-selective antiproliferative activity is a general property of some G-rich oligodeoxynucleotides. Nucleic Acids Res. Mar;38(5):1623–35. doi: 10.1093/nar/gkp1088. [DOI] [PMC free article] [PubMed] [Google Scholar]
- 24.Forsha SJ, Panyutin IV, Neumann RD, Panyutin IG. Intracellular traffic of oligodeoxynucleotides in and out of the nucleus: effect of exportins and DNA structure. Oligonucleotides. Dec;20(6):277–84. doi: 10.1089/oli.2010.0255. [DOI] [PMC free article] [PubMed] [Google Scholar]
- 25.Lipps HJ, Rhodes D. G-quadruplex structures: in vivo evidence and function. Trends Cell Biol. 2009 Aug;19(8):414–22. doi: 10.1016/j.tcb.2009.05.002. [DOI] [PubMed] [Google Scholar]
- 26.Huang MJ, Cheng YC, Liu CR, Lin S, Liu HE. A small-molecule c-Myc inhibitor, 10058-F4 induces cell-cycle arrest, apoptosis, and myeloid differentiation of human acute myeloid leukemia. Exp Hematol. 2006 Nov;34(11):1480–9. doi: 10.1016/j.exphem.2006.06.019. [DOI] [PubMed] [Google Scholar]
- 27.Dimberg A, Bahram F, Karlberg I, Larsson LG, Nilsson K, Oberg F. Retinoic acidinduced cell cycle arrest of human myeloid cell lines is associated with sequential downregulation of c-Myc and cyclin E and posttranscriptional up-regulation of p27(Kip1) Blood. 2002 Mar 15;99(6):2199–206. doi: 10.1182/blood.v99.6.2199. [DOI] [PubMed] [Google Scholar]
- 28.Henriksson M, Luscher B. Proteins of the Myc network: essential regulators of cell growth and differentiation. Adv Cancer Res. 1996;68:109–82. doi: 10.1016/s0065-230x(08)60353-x. [DOI] [PubMed] [Google Scholar]
- 29.de Torres C, Munell F, Ferrer I, Reventos J, Macaya A. Identification of necrotic cell death by the TUNEL assay in the hypoxic-ischemic neonatal rat brain. Neurosci Lett. 1997 Jul 11;230(1):1–4. doi: 10.1016/s0304-3940(97)00445-x. [DOI] [PubMed] [Google Scholar]
- 30.Dong Z, Saikumar P, Weinberg JM, Venkatachalam MA. Internucleosomal DNA cleavage triggered by plasma membrane damage during necrotic cell death. Involvement of serine but not cysteine proteases. Am J Pathol. 1997 Nov;151(5):1205–13. [PMC free article] [PubMed] [Google Scholar]
- 31.Grasl-Kraupp B, Ruttkay-Nedecky B, Koudelka H, Bukowska K, Bursch W, Schulte-Hermann R. In situ detection of fragmented DNA (TUNEL assay) fails to discriminate among apoptosis, necrosis, and autolytic cell death: a cautionary note. Hepatology. 1995 May;21(5):1465–8. doi: 10.1002/hep.1840210534. [DOI] [PubMed] [Google Scholar]
- 32.Lecoeur H, Prevost MC, Gougeon ML. Oncosis is associated with exposure of phosphatidylserine residues on the outside layer of the plasma membrane: a reconsideration of the specificity of the annexin V/propidium iodide assay. Cytometry. 2001 May 1;44(1):65–72. doi: 10.1002/1097-0320(20010501)44:1<65::aid-cyto1083>3.0.co;2-q. [DOI] [PubMed] [Google Scholar]
- 33.Trump BF, Berezesky IK. The role of altered [Ca2+]i regulation in apoptosis, oncosis, and necrosis. Biochim Biophys Acta. 1996 Oct 11;1313(3):173–8. doi: 10.1016/0167-4889(96)00086-9. [DOI] [PubMed] [Google Scholar]
- 34.Fink SL, Cookson BT. Apoptosis, pyroptosis, and necrosis: mechanistic description of dead and dying eukaryotic cells. Infect Immun. 2005 Apr;73(4):1907–16. doi: 10.1128/IAI.73.4.1907-1916.2005. [DOI] [PMC free article] [PubMed] [Google Scholar]
- 35.Dang CV, Le A, Gao P. MYC-induced cancer cell energy metabolism and therapeutic opportunities. Clin Cancer Res. 2009 Nov 1;15(21):6479–83. doi: 10.1158/1078-0432.CCR-09-0889. [DOI] [PMC free article] [PubMed] [Google Scholar]
- 36.Morrish F, Neretti N, Sedivy JM, Hockenbery DM. The oncogene c-Myc coordinates regulation of metabolic networks to enable rapid cell cycle entry. Cell Cycle. 2008 Apr 15;7(8):1054–66. doi: 10.4161/cc.7.8.5739. [DOI] [PMC free article] [PubMed] [Google Scholar]
- 37.Hallock S, Tang SC, Buja LM, Trump BF, Liepins A, Weerasinghe P. Aurintricarboxylic acid inhibits protein synthesis independent, sanguinarine-induced apoptosis and oncosis. Toxicol Pathol. 2007;35(2):300–9. doi: 10.1080/01926230701194211. [DOI] [PubMed] [Google Scholar]
- 38.Zhu J, Okumura H, Ohtake S, Nakamura S, Nakao S. The molecular mechanism of arsenic trioxide-induced apoptosis and oncosis in leukemia/lymphoma cell lines. Acta Haematol. 2003;110(1):1–10. doi: 10.1159/000072407. [DOI] [PubMed] [Google Scholar]