

Abstract
A new program, TALOS-N, is introduced for predicting protein backbone torsion angles from NMR chemical shifts. The program relies far more extensively on the use of trained artificial neural networks than its predecessor, TALOS+. Validation on an independent set of proteins indicates that backbone torsion angles can be predicted for a larger, ≥ 90% fraction of the residues, with an error rate smaller than ca 3.5%, using an acceptance criterion that is nearly two-fold tighter than that used previously, and a root mean square difference between predicted and crystallographically observed (φ,ψ) torsion angles of ca 12°. TALOS-N also reports sidechain χ1 rotameric states for about 50% of the residues, and a consistency with reference structures of 89%. The program includes a neural network trained to identify secondary structure from residue sequence and chemical shifts.
Keywords: backbone dynamics, order parameter, protein structure, secondary structure, SPARTA, structure determination, TALOS, heteronuclear chemical shift, backbone and sidechain conformation, dynamics
Introduction
It has long been recognized that chemical shifts are dominated by local protein structure (Saito 1986) (Spera and Bax 1991) (Wishart et al. 1991) (de Dios et al. 1993). As a consequence, much effort has been invested in establishing quantitative relations between protein backbone chemical shifts and local geometry, in particular the backbone torsion angles φ and ψ. The earliest work focused primarily on ring current effects and 1H chemical shifts (Haigh and Mallion 1979; Williamson and Asakura 1993; Case 1995; Sahakyan et al. 2011), but the introduction of triple resonance protein NMR spectroscopy in the early 1990s stimulated the search for quantitative approaches to take advantage of the wealth of 13C and 15N chemical shift data that became readily accessible in such studies. Two distinctly different avenues have been taken to develop quantitative relations between heteronuclear chemical shifts and protein structure: quantum chemistry methods and database-derived empirical methods. The quantum chemistry methods include density functional theory (DFT) and Hartree Fock (HF) calculations (de Dios et al. 1993) (Xu and Case 2001; Czinki and Csaszar 2007; Moon and Case 2007; Vila et al. 2008) (Villegas et al. 2007; Vila et al. 2009) (Vila et al. 2010). This approach has yielded quantitative insight into the impact of individual local geometric factors on both the anisotropic and isotropic chemical shifts, but results also highlight the exquisite sensitivity of computed chemical shifts to small structural imperfections (Vila et al. 2009). The latter are unavoidable in practice, when an intrinsically dynamic protein is represented by a single static structure that approximates its time-averaged coordinates. By contrast, empirical methods are largely “blind” to the steep chemical shift gradients caused by steric clashes or bond length and angle distortions, as the structural data used as input by these methods are typically of insufficient accuracy to afford development of a quantitative account for such effects. Inversely, when using an imperfect structural representation to predict chemical shifts, empirical methods therefore tend to predict chemical shifts at somewhat higher accuracy than quantum chemical approaches, although the latter clearly benefit from using an ensemble representation of the protein structure (Vila et al. 2009) (Li and Brüschweiler 2010; Li and Bruschweiler 2012).
A wide range of empirical methods to predict chemical shifts from known protein structure has been developed over the past two decades, including the popular SHIFTX (Neal et al. 2003) and SHIFTX2 (Han et al. 2011), CamShift (Kohlhoff et al. 2009), SPARTA and SPARTA+ (Shen and Bax 2007) (Shen and Bax 2010) programs, each with its own advantages and limitations. For example, CamShift is based on empirically derived distances of a given nucleus to those of its surrounding atoms, allowing calculation of the gradient of the chemical shift as a function of the local coordinates, thereby enabling its use in molecular dynamics and structure refinement protocols (Robustelli et al. 2010). SHIFTX2 provides extremely good predictions when (remotely) homologous structures to that of the query protein can be identified in the reference database. When no homology data are available, the SPARTA+ program appears to yield the most accurate results (Li and Bruschweiler 2012). SPARTA+ relies on an artificial neural network that has been trained to recognize backbone and side-chain torsion angles, as well as H-bonding, electric field and ring current effects. A very recently introduced program, shAIC, relies on the Akaikes Information Criterion to generate a functional form of the relationship between structure and chemical shift, and has been reported to yield some further improvement over SPARTA+ (Nielsen et al. 2012), in particular when considering NMR-derived ensembles as the reference structure.
Although prediction of chemical shifts for a known local geometry is a relatively straightforward procedure, the inverse relation is generally under defined because the chemical shift of a given nucleus is a multivariate function. Nevertheless, by smoothing empirically derived (φ,ψ) chemical shift surfaces, which allows calculation of its local derivatives, it was possible to use 13Cα and 13Cβ chemical shifts for protein structure refinement (Kuszewski et al. 1995), and the more recent CamShift (Kohlhoff et al. 2009) and shAIC (Nielsen et al. 2012) programs generalize this approach. The multiple minima encountered when calculating the difference between observed and calculated chemical shifts on the high-dimensional surface represented by the many structural variables in practice will complicate the search for the best match, however.
Alternative approaches that take advantage of chemical shifts in protein structure determination aim to generate unique restraints for the various backbone and sidechain torsion angles. These include the widely used programs TALOS and TALOS+ (Cornilescu et al. 1999) (Shen et al. 2009a), PREDITOR (Berjanskii et al. 2006), DANGLE (Cheung et al. 2010), and SimShiftDB (Ginzinger and Coles 2009). By using Bayesian statistics, an estimate for the accuracy of the prediction can be derived by some of these programs. TALOS and TALOS+ use a more ad hoc approach, and base the reliability of a prediction on the consistency between fragments selected from a database that best match the chemical shifts and sequence parameters of the query peptide. Whereas the original TALOS program simply searched a database of assigned proteins of known structure for tripeptides with similar secondary chemical shifts and sequence, TALOS+ added an artificial neural network (ANN) component to this procedure. This ANN filters the output of TALOS to be compatible with the ANN-derived prediction on whether a residue resides in the α, β, or positive φ region of the Ramachandran map. Together with an expansion in database size, TALOS+ then manages to generate predictions for ca 88% of the residues, with an “error” rate of less than 2.5% (Shen et al. 2009a). Calculation of the “error” rate was based on validation of the program for a set of proteins not used in training the program, and included a substantial fraction where the difference between predicted and reference structure was not necessarily an error, considering that many of the “erroneous” predictions matched the backbone angles seen in X-ray structures closely homologous to that of the reference protein. On the other hand, the criteria used to assign an “error” to a prediction were rather generous in terms of backbone angle tolerance, and required differences in backbone torsion angles ≥60°, and even larger when considering the sum of φ and ψ.
Here, we introduce the TALOS-N program, which is based on the same general structure as TALOS+, but has a far greater reliance on the use of ANN, thereby increasing the coverage and reliability of its predictions. Even after tightening the criteria for a valid prediction by nearly two-fold, TALOS-N reports reliable predictions for the same fraction of residues as TALOS+, without increasing the error rate. For about one third of the residues where TALOS-N cannot generate a reliable prediction, it nevertheless produces a “generous” prediction, which in validation tests matches the reference backbone angles for about 77% of these predictions. Importantly, TALOS-N also includes an ANN component to derive sidechain χ1 angle information. The χ1 value is known to impact the backbone chemical shifts (de Dios et al. 1993), in particular those of 15N and 13Cα. Unfortunately, automated analysis of X-ray derived protein structures in terms of χ1 angles is complicated by the fact that many residues are subject to rotameric averaging, with commonly only a single conformer represented in the X-ray structures. Nevertheless, TALOS-N can identify the chemical shift signature of a given χ1 rotamer for about 50% of the residues, all corresponding to cases where no extensive rotamer averaging is taking place. When just considering β-branched residues (Ile, Val, Thr) predictability increases to over 80% but, conversely, predictability of hydrophilic residues such as Lys, Arg, Glu, Asn, His and Ser as well as the highly flexible Met sidechain falls below 25%, on average.
Methods
Before describing the overall design of TALOS-N and its performance in validation tests, we briefly present the various essential elements on which this software package relies.
Preparation of the NMR and sequence database
TALOS-N utilizes a database of 580 proteins, originally developed for the SPARTA+ chemical shift prediction program (Shen and Bax 2010). This database contains proteins with nearly complete backbone NMR chemical shifts (δ15N, δ13C′, δ13Cα, δ13Cβ, δ1Hα and δ1HN) as well as atomic coordinates, extracted from the BMRB (Markley et al. 2008) and from high-resolution X-ray structures in the PDB (Berman et al. 2012), respectively. Details regarding the preparation of the database, including calibration of reference frequencies, removal of outliers, etc., have been described previously (Shen and Bax 2007). For the current application, if the database contains two or less assigned chemical shifts for any given residue, these chemical shift entries are removed. For other residues with incomplete sets of chemical shifts (≤5 for non-Gly/Pro residues, ≤4 for Gly and ≤3 for Pro), a standard TALOS database search (Cornilescu et al. 1999) was first performed to find the 10 best-matched triplets. The average (secondary) chemical shifts for the atoms of the center residues of these 10 best-matched triplets are then assigned to the atom(s) with missing experimental chemical shifts. Therefore, after this adjustment the database contains residues with either complete 15N, 13C′, 13Cα, 13Cβ, 1Hα and 1HN chemical shifts, or no chemical shift values at all. Note that those predicted chemical shifts are only used as input for training the artificial neural networks and are not used to calculate the chemical shift statistics or chemical shift matching score during the second step of database searching.
TALOS-N also uses a second database of 9523 proteins, originally prepared for the CS-Rosetta program (Shen et al. 2009b), to provide a large pool of high quality protein structural elements. This database, referred to as the protein structure database, contains proteins with PDB coordinates from high-resolution X-ray structures but without experimental chemical shift assignments. However, the 15N, 13C′, 13Cα, 13Cβ, 1Hα and 1HN chemical shifts are added to this database by using the prediction program SPARTA+ (Shen and Bax 2010). In addition, for each residue in this database, the DSSP secondary structure (Kabsch and Sander 1983) is determined from the X-ray coordinates, and further regrouped into three states: H (Helix; DSSP classification of H or G), E (Extended strand; E or B) and L (Loop; comprising DSSP classifications I, S, T and C).
2D φ/ψ residue density map
The TALOS+ program used a three-state backbone “φ/ψ distribution” code (A for the α-region; P for the left-handed helical region; and B for the remainder of the Ramachandran map) to represent the backbone conformation of each residue in the database, and used an ANN to correlate this code in an optimal manner with the NMR chemical shifts (Shen et al. 2009a). For TALOS-N, the 360°×360° Ramachandran map is binned into 18×18 square boxes, or voxels, depicted in Supplementary Information (SI) Fig. S1. A backbone “φ/ψ distribution” code with 324 states, D(φi,ψi)k, is then assigned to each residue (i) in the chemical shift database according to their φi and ψi torsion angles:
| (1) |
where k (1, …, 324) is the voxel index number, incremented from the bottom (ψ = −180°) to top (ψ = 180°) and from left (φ = −180°) to right (φ = 180°) in the Ramachandran map according to:
| (2) |
where φk and ψk refer to the center of voxel k, i.e., φk =20×(mod(k−1,18)−9) + 10 and ψk =20×(⌊(k−1)/18⌋−9)+10, where ⌊x⌋ is a “floor” function, returning the largest integer not greater than x, and mod(x) is the Modulo function. Note that Eq. 1 uses a Gaussian function to distribute residue density smoothly across bins neighboring the ‘native’ k(φi, ψi)-th voxel in which residue i resides. The radius of the Gaussian function (√800°) was adjusted empirically to yield optimal results. Therefore, the calculated backbone “φ/ψ distribution” code D(φi, ψi)k, hereafter also referred as the density map of residue i, contains 324 values, representing the smoothened likelihood of residue i to reside in each of the 324 squared φ/ψ voxels (SI Fig. S1). The φ/ψ distribution of residues is highly non-uniform across the Ramachandran map and use of the density map D(φi, ψi)k as input for training an ANN tends to overemphasize these highly populated regions. We therefore applied an empirically optimized normalization of D(φi, ψi)k by dividing its value by the square root of the corresponding average residue density for any given voxel, k, calculated over all residues in the database, <Dk>:
| (3) |
where N is the total number of residues in the database. The normalized values, , are used below as a representation of a residue’s backbone conformation (SI Fig. S1 a′–d′) and will be correlated with the experimental NMR chemical shifts by training of the ANN. Again, the <Dk> exponent of 0.5 used for normalization was optimized empirically, but its precise value was found to be not particularly critical.
Neural network for φ/ψ distribution
Similar to the TALOS+ program (Shen et al. 2009a), TALOS-N uses a two-level feed-forward multilayer ANN, referred as a (φ,ψ)-ANN, to predict the φ/ψ distribution of a residue from its NMR chemical shifts and residue type, and those of its adjacent residues.
The input signals to the first layer of the neural network (SI Fig. S2) consist of pentapeptide parameter sets derived from the above described chemical shift database. Each pentapeptide set has 160 nodes, representing six secondary chemical shift values, six “chemical shift completeness flag” values and twenty amino acid type similarity scores for each residue. In the hidden layer of the network, where each node receives a weighted sum of the input layer nodes as a signal, 180 such nodes (or hidden neurons) are used. The output of a hidden layer node is obtained through a nodal transformation function; here a standard sigmoid function is used (f1; Eq. 4).
For the purpose of predicting the φ/ψ torsion angle distribution from NMR chemical shifts, the above described 324-state residue density map, , of the center residue (i) of each pentapeptide in the database is used as the training target of the first level network. Each output value has one node with a linear activation function (f2(x) = x, Eq. 4). This procedure is schematically shown in SI Fig. S2. The empirical relationship between the φ/ψ distribution and NMR chemical shift data received by the first level network is given by
| (4) |
with f1(x) = 1/(1+e−x), and f2(x) = x. X1×160 is the input data vector consisting of 160 elements; W (1) and b(1) are the weight matrix and bias, respectively, for the connection between the nodes in the input and the hidden layer; W (2) and b(2) are the weight matrix and bias, for the connection between the nodes in the hidden and output layer; D1×324 is the training target or output vector.
The second level of the neural network functions to smoothen the prediction by accounting for commonly observed patterns in proteins. The two-level artificial neural network, as shown in SI Fig. S2, uses the input information from five sequential residues for both the first level and the second level. The input layer for the second level uses the parameter set of the 324-state φ/ψ torsion angle distribution predicted by the first level of the network for each available pentapeptide in the database, i.e., each set has 1620 nodes when the input of five sequential residues is used. The hidden layer contains 360 nodes, and the 324-state φ/ψ torsion angle distribution of the center residue of the corresponding pentapeptide in the database is used again in the output layer and as the target of the neural network. The empirical formula of the second level of the neural network is similar to Eq. 4:
| (5) |
where X1×1620 is the input vector containing the 1620 nodes; the definitions of weights, biases, and activation functions are the same as those in Eq. 4. Equations 4 and 5 of this two-level network, with the optimized weights and biases obtained from the training dataset, are then used to predict the 324-state φ/ψ distribution codes (residue density maps) for residues in any protein of unknown structure. The Eq. 5 network output vector, D1×324, after applying the reverse normalization by multiplication with the square root of the average residue density of Eq. 3, denoted as , represents the predicted probabilities for the query (center) residue, i, to reside in each of the 324 φ/ψ voxels.
A slightly modified version of the above two-level neural network has been trained to optimize application for chemical shift data collected by solid-state NMR methods, which typically lack 1H chemical shifts. This ANN, called (φ,ψ)ssNMR-ANN, uses in the input layer of the first level network only four chemical shifts (Δδ13Cα; Δδ13Cβ; Δδ13C′ and Δδ15N) from pentapeptides, i.e., each pentapeptide set has 5×28=140 nodes, representing four secondary chemical shift values, four chemical shift completeness flags and 20 amino acid type similarity scores for each residue.
Neural network for secondary structure
TALOS-N also includes an ANN to predict the three-state secondary structure (helix or H, extended strand, or E, and loop, L) from NMR chemical shifts. This SS-ANN utilizes again the same two-level neural network architecture, and the three-state secondary structure classification of the center residue of each corresponding pentapeptide in the database is used in the output layer and as the training target for both levels of the neural network. Analogous to other well-known ANN-based bioinformatics programs, such as PHD (Rost and Sander 1993) and PsiPred (Jones 1999), we developed an additional neural network, with the same two-level architecture used above, that uses only the sequence input from longer protein fragments to predict the secondary structure classification of the center residue. This so-called SSseq-ANN therefore can be used to predict the secondary structure of proteins lacking chemical shift data, but as described below it is particularly useful for proteins with incomplete chemical shifts when used in a “hybrid” manner with the above SS-ANN.
Neural networks for χ1 rotameric state
TALOS-N also includes 17 residue-specific single-level ANNs, referred to as (χ1)a-ANN (a denotes any residue type, excepting Ala, Gly and Pro), for predicting the χ1 rotameric state. These (χ1)a-ANN networks are trained to recognize the (φ,ψ)-dependent impact of sidechain χ1 torsion angles on the backbone chemical shifts. The fact that the backbone chemical shifts are impacted by the χ1 rotameric state has long been known (de Dios et al. 1993), but has not been exploited widely in structural studies. The impact of χ1 on the chemical shifts of the backbone atoms depends on the backbone torsion angles too (Fig. 1), complicating the parameterization of its impact in terms of empirical surfaces, which become three-dimensional (φ,ψ, and χ1) and are residue-specific.
Fig. 1.
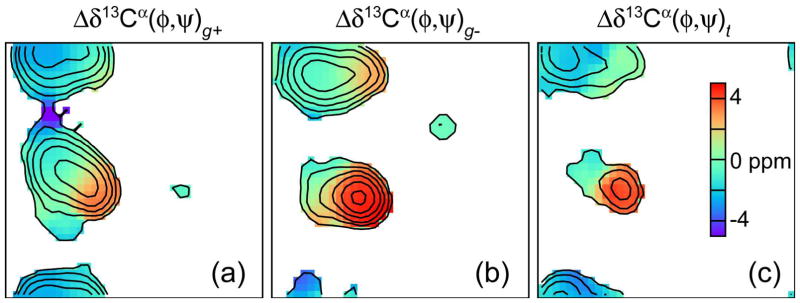
Average (φ,ψ)-dependence of the Δδ13Cα chemical shift in Thr for three different χ1 rotameric states: (a) g+; (b) g−; and (c) t, displayed as Ramachandran maps. Only regions with a residue density (for definition see (Spera and Bax 1991)) larger than one are color coded. The residue density is marked by gray contour lines, increasing from 1 with an increment factor of 3.2. The average secondary chemical shifts for residues in the α regions are 0.6±2.0, 3.9±1.7 and 2.0±−2.4 ppm, for χ1 rotameric states of g+, g− and t, respectively, and −2.2±1.2, −0.2±1.4, and −2.2±1.5 ppm, respectively, for residues in the β region.
The dataset used to train each (χ1)a-ANN was generated by initially selecting, for each heptapeptide i in the chemical shift database, the pool of 1000 heptapeptide fragments jk (k = 1, …,1000) from the structural database that most closely match the φ/ψ angles predicted by TALOS-N for i, while insisting that the center residues of jk and query peptide i are of the same type, a. For subsequent ANN training, only the center three residues of these fragments are considered, but the use of heptapeptides initially ensures that these tripeptides are located in similarly structured regions. For Na residues of type a in the chemical shift database, a corresponding collection of 1,000×Na tripeptides T(i,jk)a was then used to train the (χ1)a-ANN. The input signals to the (χ1)a-ANN consist of the tripeptide parameter sets derived from T(i,jk)a: 38 input nodes, representing the 18 chemical shift differences between the three residues of database tripeptide (j) and query tripeptide (i), and the six or seven torsion angles for each residue of database tripeptide (j). The torsion angles are represented by a total of 20 input parameters: sin(φj+n), cos(φj+n), sin(ψj+n), cos(ψj+n), sin(χ1j+n) and cos(χ1j+n) for n=−1,0,1, as well as a Boolean flag (needed for Gly, Ala, and Pro) to indicate whether a χ1 angle is valid for the first (n=−1) and the last (n=1) residue in tripeptide j. The secondary chemical shift matching score is calculated from the difference between the observed (secondary) chemical shift for the query residue ( ) and the SPARTA+ predicted (secondary) chemical shift for the corresponding database residue ( ) according to , where X = [15N, 13C′, 13Cα, 13Cβ, 1Hα and 1HN], and is the chemical shift prediction uncertainty generated by SPARTA+ for . The hidden layer contains 15 nodes. A binary matching score S(i,j)χ1, derived using the χ1 rotameric state of the center residue of the query tripeptide (χ1i) and the χ1 rotameric state of the center residue of the database tripeptide (χ1j), is used in the output layer and as the target of the neural network. The χ1 matching score S(i,j)χ1 is assigned to 0 if χ1i = χ1j, and to 1 otherwise. A summary of all ANNs used in this work is listed in SI Table S1.
Neural network training
The weight and bias terms of each ANN were determined by training of the network using a large dataset. Specifically, the chemical shift and sequence information of the 580-protein chemical shift database are used to train the (φ,ψ)-ANN and SS-ANN; the sequence profile of the 9523-protein structure database is used to train the SSseq-ANN; and the chemical shifts of both databases together with the torsion angles of the protein structure database are used to train the χ1-ANNs. To prevent over-training, a three-fold training and validation procedure was performed for each ANN by dividing the input training dataset into three subsets, followed by separate training of the corresponding neural networks. For each of these three network optimizations, one input subset was excluded from the training dataset but then used to evaluate the performance of the neural network during the training. This subset, referred as the validation dataset, was not used to calculate the weight changes in this network. This procedure is referred as a 3-2-1 training and validation procedure, for which 3-2-1 refer to the number of the total subsets, the number of training subsets, and of validation subsets, respectively. For training of the SSseq-ANN, a 3-1-2 training and validation procedure was used to prevent over training of the ANN. Training of the network was terminated when its performance on the validation dataset, represented by the mean squared errors between predicted values and targets, began to degrade.
Neural network testing and validation
In addition to the above three-fold training and validation, a second validation procedure was performed for a set of 34 additional proteins, which represent a wide range of folds and have (1) complete or nearly complete chemical shifts, (2) a good quality X-ray reference structure, and (3) no homologous protein (≤30% sequence identity) in the 580-protein database. The neural network prediction used for these 34 proteins was obtained by averaging over the outputs from the three networks, separately trained above.
To evaluate the ANN prediction performance for the 324-state D(φi,ψi)k distribution (k = 1,..,324) or for a given type of secondary structure (k = H, E, L), a sensitivity score Qobs is used which reports the percentage of the total number of observed states present in the database (NT) that are correctly predicted (true-positive: NTP):
| (6) |
Moreover, the overall network performance for all states in a protein or dataset is measured by a score:
| (7) |
Note that for the three-state secondary structure prediction, the definition of this score is the same as the Q3 score, commonly used in bioinformatics (Jones 1999). For the SS-ANN and SSseq-ANN three-state secondary structure prediction, a positively predicted state of a given residue is assigned to the state (H, E or L) with the highest prediction score. For the (φ,ψ)-ANN and (φ,ψ)ssNMR-ANN, the positively predicted φ/ψ voxels are those with a significantly elevated predicted score, i.e., those with predicted values that fall at least one standard deviation [ ] above the average of the predicted scores over all 324 voxels, < >. A true-positive (TP) prediction is assigned if the true φ/ψ-box, k(φi,ψi), in which the query residue with observed φi/ψi angles actually resides, is predicted as positive.
Cluster analysis
As exemplified for residue G9 in Fig. 2, the positive φ/ψ voxels for any given residue can form multiple clusters in the Ramachandran map, indicating that more than one backbone conformation is potentially compatible with the chemical shifts. Identification of such clusters is an important component of TALOS-N (see Eqs. 8 and 9) and clustering algorithms are used to identify these regions. Cluster analysis was carried out using the DBSCAN algorithm (Ester et al. 1996), and clustering parameters used by TALOS-N are 5 for the minimum number of voxels of a cluster and 120° degrees for the minimum distance between the centers of any two clusters. The parameters of an identified cluster include (1) the cluster center, which is the center of the φ/ψ voxel with the highest predicted DANN value in this cluster, (2) the cluster size, or the number of φ/ψ voxels in this cluster, and (3) the cluster density, or the sum of the in this cluster.
Fig. 2.
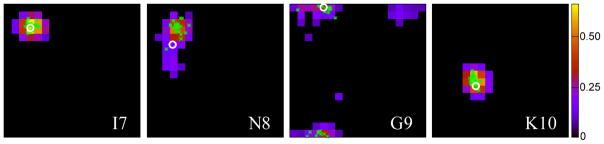
(φ,ψ)-ANN predicted (φ,ψ) likelihood distributions presented as Ramachandran maps for residues 7 to 10 of protein GB3. Only 20°×20° voxels with predicted likelihoods that fall at least one standard deviation above the average population (1/324) are color coded. The φ/ψ angles observed in the reference structure (first conformer of PDB entry 2OED) is marked with a white circle; the φ/ψ angles of the center residue of the 25 best matched database fragments are displayed as green dots. The horizontal axis of each plot corresponds to φ (ranging from −180° to 180°) with the vertical axis being ψ (ranging from −180° to 180°, bottom to top). Residue G9 shows two clusters; one centered near (φ,ψ) = (−100°, 180°) and one at (120°, 160°).
TALOS-N database search for predicting φ/ψ angles
Searching a large protein database for closely matching fragments was at the heart of the earlier TALOS and TALOS+ programs for predicting backbone φ/ψ angles, and provides a robust quality control step by eliminating local geometries that are sterically not feasible (Cornilescu et al. 1999; Shen et al. 2009a). TALOS-N relies on the same type of database search procedure, but with two key differences. First, TALOS-N searches the protein structure database, to which predicted chemical shifts have been added by SPARTA+ (Shen and Bax 2010), rather than the much smaller database of structures with experimentally determined chemical shifts (Fig. 3). Second, use of the much larger protein structural database permits the search for longer, heptapeptide fragments, instead of the short tripeptides used by the TALOS and TALOS+ programs.
Fig. 3.

Flow diagram for the TALOS-N program, with the left branch corresponding to prediction of backbone torsion angles, and the right branch dedicated to χ1.
For a given query heptapeptide [i−3,..,i,..,i+3] (referred as heptapeptide i), TALOS-N first searches the protein structure database for a pool of 1,000 heptapeptides [j−3,..,j,..,j+3]m (m = 1 to 1000) (referred as heptapeptide jm) with backbone φ/ψ torsion angles (φj/ψj) that are best-matched to the ANN-predicted φ/ψ torsion angle distributions ( ) of the query heptapeptide. This matching is based on comparing the 324-state vectors predicted for residues i+n (n=−3 to 3) in query heptapeptide i with the corresponding φ/ψ torsion angles of residue jm+n in database heptapeptide jm. For this purpose, the ANN-predicted 324-state φ/ψ torsion angle distribution vectors are converted to 324 penalty scores Pi+n,k (k=1,..,324). These penalty scores are defined while taking into account the clustering status of the positively predicted φ/ψ regions. When a single cluster is formed in the Ramachandran map, or when multiple clusters are observed and the cluster density of the largest cluster is at least 70% of the total density from all clusters, the penalty score is defined as:
| (8) |
where < > and are the average value and the standard deviation of the 324 predicted scores, i.e., , and f is a standard sigmoid function f(x) = 1/(1+ex). However, when multiple clusters are observed for the positively predicted φ/ψ voxels and the largest cluster has no dominantly high density (i.e., <70%), the penalty score is assigned a uniform value for all φ/ψ voxels observed in all clusters:
| (9) |
and set to 1 for all other φ/ψ voxels, where < > is the average predicted residue density for all clustered φ/ψ voxels.
A similarity score is then used to match the query heptapeptide i and database heptapeptide j:
| (10) |
where k(x) is the index number of the φ/ψ voxel in which database residue x resides, or k(φx, ψx) (see Eq. 2), is the residue type matching constraint between query residue p and database residue q, and cn are the position-specific weights, equal to 1.0, 0.81, 0.64 and 0.49 for residues at position n = 0, ±1, ±2 and ±3, respectively. is defined in a binary manner so that only the database residues with similar characteristics (as defined by the BLOSUM62 matrix (Koonin and Galperin 2003); see http://www.ncbi.nlm.nih.gov/books/bv.fcgi?rid=sef.figgrp.194) to the query residue are used when searching for matched fragments: (1) for the center residue (n = 0), the database residue j must have identical residue type (Aj) to that of the query residue i (Ai), if Ai is Gly or Pro, and the database residue j+1 must be a Pro (Aj+1 = Pro) if residue i precedes Pro (i.e., Ai+1 = Pro); (2) a second requirement is that for all positions in the heptapeptide, the BLOSUM62 matrix value [B(Ai+n, Aj+n)], which relates similarities of query residue Ai+n and database residue Aj+n, must be non-negative:
| (11) |
The 1,000 database heptapeptides [j−3,..,j,..,j+3]m (m = 1, …, 1000) with the lowest S(i,j) scores selected in this first round of the TALOS-N program subsequently are evaluated further in terms of the fitness of their secondary chemical shifts (ΔδXdb), calculated by SPARTA+, with respect to the experimental chemical shifts (ΔδXobs) of the corresponding query residues:
| (12) |
where X = [13Cα, 13Cβ, 13C′, 15N, 1Hα, 1HN], σXdb is the uncertainty of the SPARTA+ predicted chemical shift ΔδXdb, and cn is the position-specific weight which equals 1.0, 0.64, 0.36 and 0.25 for residues at position n = 0, ±1, ±2 and ±3, respectively. The 25 heptapeptides with best-matched score are kept as the final matched fragments. When all 25 [φj/ψj]n cluster in the same region of the Ramachandran map, the TALOS-N program makes a φ/ψ prediction for residue i from the average values of the φ and ψ angles observed for the center residues of these 25 heptapeptides, which is then classified as a “Strong” prediction. If only the top 10 [φj/ψj]k values cluster in the same region of the Ramachandran map, the TALOS-N program still makes a φ/ψ prediction, but with the classification “Generous”. This latter group is of considerably lower accuracy (see Results and discussion) but offers likely backbone torsion angles in loop and turn regions that often are most difficult to analyze by conventional methods.
TALOS-N χ1 rotamer prediction
For χ1 rotamer prediction, TALOS-N relies on the output of the above described (χ1)a-ANN. As was done for the training of this network, TALOS-N searches the structural database for the 1000 database heptapeptides that best match the φ and ψ angles and residue types of the query peptide, while insisting that the center residue of the query and database peptide are of the same type (Fig. 3). For each database heptapeptide, the trained (χ1)a-ANN then returns a χ1 matching score, , reflecting the likelihood of the center residue of query peptide i having the same rotameric state as the center residue of the database peptide j. At the next step, TALOS-N divides the set of 1000 database peptides into three groups, corresponding to their rotamer type c (c=g+, g and t), and the 10 database peptides with the lowest score are retained from each group, and denoted as . For each rotamer type, c, the average value of the 10 lowest scores, < >, is then converted to a likelihood P(<S(i)χ1,c>) that the center residue of the query fragment has a χ1 rotamer state c. This conversion relies on the empirically derived relation between the score and P(Sχ1) (see SI Fig. S6). The P(<S(i)χ1,c>) score, after normalization such that the sum of the likelihoods over all three χ1 rotameric states equals one is denoted p(<S(i)χ1,c>). It corresponds to the predicted probability for center residue i to adopt χ1 rotameric state c. The final χ1 rotamer prediction to rotamer state c is accepted if p(<S(i)χ1,c>) ≥0.6.
Results and discussion
The φ/ψ-ANN network used by TALOS-N has been trained to predict the 324-state φ/ψ angle distribution, i.e., where the φ/ψ angle of a given residue falls in the Ramachandran map, on the basis of the backbone NMR chemical shifts and residue type of the residue itself and its neighbors in the sequence. The 580-protein database used for training the neural network comprised a total of 63,266 residues with three or more experimentally assigned chemical shifts. The ability of the trained φ/ψ-ANN to reproduce the correct φ/ψ angle distribution is then evaluated by using a validation dataset. This validation procedure shows that the φ/ψ angles in the validation dataset are generally identified with high probability by the φ/ψ-ANN and (φ/ψ)ssNMR-ANN models, as reflected in high sensitivity scores Qobs of 96.5% and 95.8% found for the φ/ψ-ANN and (φ/ψ)ssNMR-ANN, respectively (SI Table S1). It is also important to inspect the prediction score Qpred, which reports the percentage of the total number of predictions (NP) that are correct (NTP), i.e., Qpred = NTP/NP. Evaluation of the Qpred score for a 324-state φ/ψ-ANN prediction is more complicated, however, as multiple positively predicted states (k) exist, which occasionally are not even clustered when represented on a Ramachandran map. Moreover, considering that the predicted 324-state φ/ψ-distribution is only used as the input for a subsequent database search in the TALOS-N protocol, a complete, quantitative evaluation of the φ/ψ-ANN and (φ/ψ)ssNMR-ANN models is not included here. However, a good qualitative impression of the reliability of the ANN can be obtained by inspection of Fig. 2 and SI Fig. S3, which compare the φ/ψ-ANN predictions with the crystallographically observed φ/ψ angles for GB3, a protein excluded from both the training and validation sets used by the ANN.
TALOS-N backbone φ/ψ torsion angle prediction
The TALOS-N user interface is very similar to that of the TALOS+ program (Fig. 4). New features include filled semi-transparent 20°×20° voxels on the Ramachandran map, depicting the ANN-predicted probability to find any given residue in the φ/ψ regions defined by those voxels, and a panel displaying the ANN-predicted sidechain χ1 rotamers. For the Ramachandran map, the color of a voxel corresponds to the ANN-predicted relative probability ( ) that a residue (i) resides in that voxel. For the χ1 rotamer panel, the length of the ovals marks the probability of a residue to adopt the indicated χ1 rotameric state. In the sequence display panel, unambiguous predictions are marked in green (light and dark green for the “Strong” and “Generous” predictions, respectively), ambiguous results in yellow, and residues predicted to be dynamically disordered, as judged by their chemical shift derived order parameter (Berjanskii and Wishart 2008), are shown in blue. As with the original TALOS and TALOS+ programs, separate output files containing the details of each prediction are also generated.
Fig. 4.

TALOS-N graphic user interface, displaying results for residue L8 of query protein ubiquitin. The left panel shows a plot of the φ/ψ angles of the 25 closest database matches (green symbols), superimposed on a Ramachandran map depicting in gray the standard most favorable backbone torsion angles for Leu. The 324 (φ,ψ)-ANN predicted scores for L8 are shown as colored voxels, but only for those that are at least one standard deviation above the average predicted voxel density. The top right panel is identical to that of the TALOS+ graphic user interface, and displays the sequence of the protein with residues marked according to their (φ,ψ) prediction classification, i.e, no prediction in light grey, consistent predictions in light or dark green (for “Strong” and “Generous” predictions, respectively), ambiguous predictions in yellow, and dynamic residues in blue. Three other panels correspond to the RCI-S2 value (Berjanskii and Wishart 2008), the predicted secondary structure (red, helix; aqua, β-sheet), with the height of the bars reflecting the probability assigned by the SS-ANN secondary structure prediction. The bottom right panel depicts the χ1 rotamer prediction (red oval: g−; green: g+; yellow: t), with the height of the ovals corresponding to the probability assigned by the χ1 rotamer prediction. Note that in the top right panel, only two predictions (D52, G53) are deemed ambiguous. Both of these exhibit chemical exchange broadening in the NMR spectra, and adopt different type turns in different X-ray structures (type I in 1UBQ; type II in 3ONS) (Vijay-Kumar et al. 1987; Huang et al. 2012).
Backbone torsion angles were predicted by both the TALOS+ and the new TALOS-N programs for all 580 database proteins, as well as the separate 34-protein validation set of SI Table S3. With the improved performance of TALOS-N, we have changed the acceptance criteria for “good” predictions to fall within a 60° radius of its target value, [(φpred−φXray)2 + (ψpred−ψXray)2]1/2 < 60°, covering a region of the Ramachandran map that is 49% smaller than in the original evaluation (Shen et al. 2009a). The 60° radius cut-off value was derived by inspecting a search of the structural database for the first fifty 7-residue peptide fragments that match the heavy atom backbone coordinates of each 7-residue fragment extracted from the ubiquitin X-ray structure (1UBQ) to better than 0.8 Å coordinate rmsd. More than 99% of these matching fragments have φ/ψ angles for the center residue that fall within the 60° radius from the corresponding ubiquitin fragment (SI Fig. S9).
Using the tighter 60° limit, the fraction of residues assigned a “bad” prediction by TALOS+ would nearly double compared to the original, more generous criterion, and to counteract this high error rate, for comparison purposes with TALOS-N, the TALOS+ acceptance criterion was tightened to require φ and ψ standard deviations ≤35° for the 10 best matched triplets. This lowers the fraction of “predictable” residues from ~88 to ~85%, but limits the increase in bad predictions to ca 60% instead of doubling it.
Predictions were made using the cross-validation “leave-one-out” manner, i.e., for predicting the backbone angles of any given protein, it was removed from the database prior to the search. As summarized in Table 1, the TALOS+ method, on average, makes “unambiguous” predictions for about 84.5% of the residues when applied to our larger 580-residue database, with 4.1% of the predicted φ/ψ torsion angles failing the criterion relative to the reference X-ray structure values (Table 1). With TALOS-N, the number of “unambiguous” predictions (“Strong” + “Generous”) increases to 90.7% (86.6% and 4.1% for “Strong” and “Generous” predictions, respectively), with a total error rate of 3.5% (2.9% and 21%, respectively for “Strong” and “Generous” predictions, see Table 1).
Table 1.
Comparison of TALOS+ and TALOS-N predictions.a
| Consistent | Ambiguous | <sd> b (φ/ψ) | Rmsd c (φ/ψ) | ||
|---|---|---|---|---|---|
|
| |||||
| Total | Bad | Warning | |||
| For chemical shift database | |||||
|
| |||||
| TALOS+ | 84.5% d | 4.1% e | 15.5% d | 12.4/11.9 | 13.6/12.5 |
| TALOS-N | 90.7% d [86.6%/4.1%] | 3.5% e [2.9%/21%] | 9.3% d | 8.7/8.5 | 12.3/12.1 (11.7/11.4) |
|
| |||||
| For 34-protein validation dataset | |||||
|
| |||||
| TALOS+ | 84.7% d | 4.2% e | 15.3% d | 12.5/12.0 | 13.7/12.7 |
| TALOS-N | 91.4% d [87.5%/3.9%] | 3.5% e [2.8%/23%] | 8.6% d | 8.5/8.3 | 12.2/12.1 (11.7/11.5) |
TALOS+ and TALOS-N predictions were performed for the 580-protein chemical shift database and for a separate 34-protein validation dataset.
Average standard deviation of φ/ψ torsion angles among the 10 or 25 best matched tripeptides/heptapeptides for “Good” TALOS+/TALOS-N predictions, representing the average precision of the predictions. See footnote e for the definition of a good/bad prediction.
Rmsd values between TALOS+/TALOS-N predicted φ/ψ angles (“Good” predictions only) and φ/ψ angles observed in the reference structures, representing the average accuracy of the predictions; values in parenthesis correspond to residues for which both both TALOS+ and TALOS-N reported “Good” predictions.
Fraction of “consistently” predicted residues relative to the total number of residues for which predictions are calculated. Percentages for the “Strong” and “Generous” TALOS-N predictions are given in square brackets.
Percentage relative to the total number of “consistently” predicted residues (“Good”+”Bad”). A “bad” prediction is defined based on the criterion sqrt[(φobs − φpred)2 + (ψobs − ψpred) 2] > 60°; otherwise the prediction is defined as “good”. Percentages for the “Strong” and “Generous” TALOS-N predictions are given in square brackets.
The root-mean-square differences (rmsd) between the TALOS-N predicted and crystallographically observed φ/ψ angles are ~5–10% lower compared to TALOS+ (Table 1). TALOS-N includes considerably more predictions outside regions of regular secondary structure than TALOS+, and when restricting the rmsd between predicted and crystallographically observed φ/ψ angles to residues that could also be predicted by TALOS+, the decrease in rmsd obtained with TALOS-N is larger, 10–15% (Table 1). When inspecting the “Generous” TALOS-N predictions, which are mostly for residues in loops and turns, the observed φ/ψ angles are still quite accurate, with rmsds of ca 14° between predicted and crystallographically observed φ/ψ angles (Table 1). However, this rmsd excludes the relatively high fraction (21%) in this category that fall outside the 60° cutoff radius.
The performance of TALOS-N was also validated for a set of 34 proteins with various folds (SI Table S3), which lack significant homology to any of the proteins in the chemical shift database used for training the ANN. The statistics for the TALOS-N predictions on this independent set of proteins are essentially the same as those observed for the 580-protein database (Table 1), indicating that the fact that the ANN component was trained on the 580 protein database does not skew the leave-one-out validation procedure described above. It is also interesting to note that the TALOS-N performance remains good when backbone chemical shifts are incomplete, as exemplified by predictions for proteins that lack 1H chemical shifts (emulating typical input from solid-state NMR). The φ/ψ prediction performance is then only ~1% lower in terms of the fraction of residues that is identified with “unambiguous” φ/ψ angles, while the increase in error rate is only ca 0.1% (SI Table S2). Moreover, when TALOS-N is operated in the “solids-mode”, using the (φ,ψ)ssNMR-ANN, the prediction performance for proteins lacking 1H chemical shifts can be slightly improved (SI Table S2).
As was noted for TALOS+ (Shen et al. 2009a), our reported error rate in all likelihood significantly overestimates the true error rate, as many of the predictions marked as “erroneous” occur in loop regions, where the X-ray and solution structures may actually differ from one another. Taking the protein FluA as an example, for which three different X-ray structures of closely homologous sequences are available, not a single one of the “erroneous” TALOS-N predictions consistently disagrees with all three reference X-ray structures (SI Fig. S8).
χ1 rotamer prediction
The sidechains of many protein residues are known to rapidly average between multiple rotameric states, in particular for residues residing on the protein surface but also for interior non-β-branched hydrophobic residues such as Met and Leu. The presence of such rotamer averaging significantly complicates accurate prediction of χ1 angles, in particular since the presence of conformational averaging is often not evident in the X-ray crystal structures used as input for our empirically derived relation between structure and chemical shift. A positive indication of sidechain rotameric averaging in such structures is only available when multiple independently derived X-ray structures are present in the database, or for proteins solved at exceptionally high resolution where multiple sidechain conformers have been identified (Butterfoss et al. 2005). Taking ubiquitin as an example, where four high-resolution X-ray structures are available, only 42 residues (67% of 63 non-Gly/Ala/Pro residues with ordered backbone torsion angles) exhibit the same χ1 rotamer in all four structures (Fig. 5). For the vast majority of proteins in our structural database, no positive evidence on sidechain rotameric averaging is available, however. By solution NMR, χ1 torsion angles in principle can be determined from NOE, RDC, and a variety of J coupling experiments, but such experiments tend to be quite laborious (Dzakula et al. 1992a; Dzakula et al. 1992b; Chou and Bax 2001; Miclet et al. 2005; Schmidt 2012). Earlier studies also indicate that typically the χ1 rotameric state can be identified for less than 70% of the residues, and among those only 70–80% agree with crystal structure data (Mittermaier and Kay 2001). It is clear, therefore, that the absence of quantitative knowledge regarding the degree of sidechain rotameric averaging in the protein structural database poses a serious challenge when linking the backbone chemical shifts to sidechain χ1 rotameric states by empirical methods.
Fig. 5.
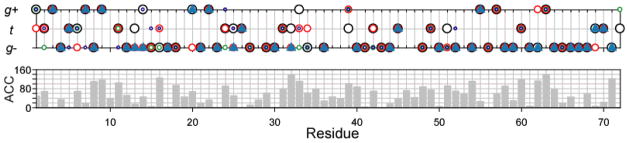
TALOS-N χ1 rotamer prediction for ubiquitin. The TALOS-N predicted χ1 rotamer is displayed as a solid blue triangle. The χ1 rotamers observed in four high resolution X-ray structure of ubiquitin, 1UBQ (1.8 Å, black circle), 1YJ1 (1.3 Å, red circle), 3A9J (1.18 Å, green circle) and 4HK2 (1.18Å, blue circle) are also shown in the top panel. The lower panel shows solvent accessibility, reported as the ACC parameter by the DSSP program (Kabsch and Sander 1983) (for ACC definition see http://swift.cmbi.ru.nl/gv/dssp/), as a function of residue number and averaged over the four X-ray structures.
The chemical shift patterns of the 17 residue types (excl. Gly, Ala, and Pro) exhibit differential dependence on the χ1 rotameric state. In particular, the β-branched residues (Ile, Val, and Thr) and the aromatic residues (Phe, Trp, and Tyr), show the most pronounced χ1 dependence of chemical shifts (SI Fig. S4). For example, the average ΔδCα for Thr in the α region are 0.6±2.0, 3.9±1.7 and 2.0±−2.4 ppm, for χ1 rotamers of g+, g− and t, respectively, and −2.2±1.2, −0.2±1.4, and −2.2±1.5 ppm, respectively, for the β region (Fig. 1). By contrast, for most of the linear-chain, hydrophilic amino acids (e.g. Glu, Lys, Gln, Arg, and Ser), the χ1 dependence of the chemical shifts is relative weak (SI Fig. S4), and the performance of chemical shift based χ1 prediction is therefore expected to be lower.
When inspecting the performance of the trained χ1-ANNs to predict a match between the χ1 rotamer of database fragments and χ1 of the query fragment, best results are obtained for the above mentioned residue types with the most pronounced χ1-rotamer dependence of their chemical shifts. However, when comparing the quality of predictions made by the χ1-ANN at a given cut-off score, S(i,j)χ1, the reliability of the prediction becomes comparable for the different residue types (SI Fig. S6a–e). For example, when using , the fraction of correctly identified χ1 rotamers falls between 80 and 96%. By contrast, when evaluating the population of the predictions with low scores for matching χ1 rotamers, or the populations with large scores for the “mismatched” rotamers (for which the observed S(i,j)χ1 = 1), considerable variation with residue type is observed (SI Fig. S6a′–e′): While a large fraction of Ile, Val, Phe, Trp, Tyr, and Thr residues yields low values when χ1 matches, and high values for mismatched rotamers (SI Fig. S6a′–b′), for other residue types the predicted values are more clustered around 0.5 (SI Fig. S6b′–e′). Interestingly, when comparing predictions for Asn and Asp, a considerably larger fraction of Asp residues has a predictable χ1 rotamer, while the intrinsic sensitivity of their chemical shifts on χ1 appears comparable (SI Fig. S4).
The separate database searching step for χ1 rotamer prediction in TALOS-N (Fig. 3) provides a robust procedure to find a pool of 1,000 database fragments for which the backbone conformation and residue types are similar to those of the query fragment. This step proved important for identifying database fragments with similar backbone conformations without an explicit restriction on the χ1 rotameric states. Such sets of 1000 fragments therefore present good training sets for the χ1-ANN, allowing it to learn the relation between χ1 and deviations from average chemical shifts. It is worth mentioning again that in this step the protein structure database with SPARTA+ predicted chemical shifts, rather than the experimentally determined chemical shift database, is used to search for fragments. The reason that this works well lies in the observation that the chemical shifts predicted by SPARTA+ have the χ1 rotamer information already well encoded (SI Fig. S5).
TALOS-N uses the output of the (χ1)a-ANN to derive a probability score, p(<S(i)χ1,c>), that a given residue has a χ1 rotamer prediction of type c (see Methods). Although for each residue, the p(<S(i)χ1,c>) values are reported separately, for comparison with other programs it is useful to define a cut-off score, above which the prediction is accepted. This then permits quantitative evaluation of the fraction of residues for which χ1 rotamers can be predicted, as well as the fraction for which the prediction is correct. Below, we use a cut-off value of pcutoff = 0.6. Using this cut-off, ca 50% of the residues in the 34-protein validation set yield a χ1 rotamer assignment, with 89% of these being consistent with the X-ray reference structure. Use of a pcutoff = 0.7 increases the agreement with reference structures to 91.5%, but lowers the fraction of predictable χ1 rotamers to ~30%. Conversely, pcutoff = 0.5 decreases the agreement with the X-ray structures to 81.6%, while increasing the fraction of predictable χ1 rotamers to ~73%. The fraction of residues that have predictable χ1 rotamers at pcutoff = 0.6 varies considerably with residue type, while the agreement with reference structure χ1 values is relatively independent of residue type (Fig. 6).
Fig. 6.

Summary of TALOS-N χ1 rotamer prediction results for different residue types over the 34-protein validation set. The fraction of “Predictable” χ1 rotamers (using a pcutoff = 0.6 threshold) are marked as gray bars. Green bars depict the fraction of these rotamers whose prediction is consistent with the X-ray reference structure.
Effectively, the (χ1)a-ANN assigns the rotamer for a fragment of known backbone torsion angles. Considering that the χ1 rotameric state is closely coupled with the backbone torsion angles φ and ψ (Dunbrack and Karplus 1994)(Bower et al. 1997), it is therefore important to evaluate how much chemical shifts improve the χ1 prediction over the use of only backbone angles as input for the prediction. The latter prediction can be made using the 2010 backbone-dependent rotamer library of Shapovalov and Dunbrack (Shapovalov and Dunbrack 2011), using as input the φ and ψ values of any given residue obtained from TALOS-N. For each residue i (non-Gly/Ala/Pro) in the 34-protein validation dataset, the backbone-dependent rotamer library based method then reports a probability score pi(c) for the query residue i to adopt χ1 rotamer c. Again, for quantitative evaluation we have to define a threshold value for pi(c) above which the prediction is accepted. At a given pi(c), the rotamer library based protocol yields χ1 predictions for considerably more residues than the (χ1)a-ANN protocol (SI Fig. S7). For example, when using pi(c) = 0.6 as a threshold, ~65% of the residues have predictable χ1 angles, but the correctness ratio is only 73.3%. If the pi(c) threshold is raised to 0.66, yielding the same ~50% fraction of χ1-predictable residues as the (χ1)a-ANN, the correctness ratio increases to 76%, but remains much lower than the 89% obtained with TALOS-N. If the pi(c) threshold is raised to 0.85, where the correctness increases to 89%, only ~20% of the residues have predictable χ1 rotamers. This comparison therefore indicates that chemical shift information adds a very substantial improvement over the use of the backbone-dependent rotamer library.
TALOS-N secondary structure prediction
TALOS-N also includes a neural network, SS-ANN, specifically trained to predict secondary structure. Training of the SS-ANN relies on the same input data from pentapeptides as was used above for predicting the 324-state (φ,ψ)-distribution. With a Q3 score (Jones 1999) of 88.6% when evaluated over the 34-protein validation set, the performance of TALOS-N is virtually identical to that of TALOS+ (Shen et al. 2009a), and approaches the limit of what is achievable when considering that even for proteins of known structure different programs typically show agreement no better than 90% (Wishart 2011).
TALOS-N also includes a network, SSseq-ANN, that is trained to predict secondary structure from the amino acid sequence alone. It yields a Q3 score of 81.2% for the 91 target proteins used for CASP9 (SI Table S1) (Kryshtafovych et al. 2011), and is comparable in performance with the upper limit of 80–82% Q3 scores reported by other popular bioinformatics programs such as PsiPred and PHD (Rost and Sander 1993; Jones 1999). Importantly, this SSseq-ANN is seamlessly implemented in TALOS-N as a complement to the chemical shift based SS-ANN module and can bridge stretches in proteins that lack chemical shifts. It operates in a “hybrid” mode, where the second level of the SSseq-ANN uses as input the output of the second level of the SS-ANN, supplemented by SSseq-ANN first level outputs for residues where chemical shifts were unavailable. Thus, the 15 three-state probability inputs (for residues i−7 to i+7) to the second level SSseq-ANN network are taken from (1) the output of the SS-ANN network if it is “SS-ANN predictable” or (2) the output of the first level SSseq-ANN network if it cannot be predicted by the first level of the SS-ANN. In the case of incomplete chemical shifts, the performance of this hybrid SS-ANN falls in between that obtained by SSseq-ANN and the 88.6% obtained when full chemical shift assignments are available.
Concluding Remarks
TALOS-N offers a powerful new method for predicting protein backbone torsion angles from chemical shifts, as well as a new extension for predicting protein sidechain χ1 angles from chemical shifts. Compared to the popular TALOS+ program, the fraction of residues whose backbone angles cannot be predicted unambiguously is reduced by about one third. The additional residues whose torsion angles now can be predicted by TALOS-N are all located outside regions of regular secondary structure, where typically such restraints are most needed. The improved performance of TALOS-N over TALOS+ in predicting protein backbone torsion angles is primarily the result of its far greater reliance on neural network algorithms. By defining the Ramachandran map in terms of 324 voxels, rather than the three groupings used by TALOS+, and the use of 5-residue rather than 3-residue fragments for its input, more optimal use is made of the input information by TALOS-N. In contrast to the TALOS+ program, TALOS-N relies on the large database of high quality X-ray structures to which chemical shift assignments were added by SPARTA+ (Shen and Bax 2010). In this respect, it is important to note that the ANN-based SPARTA+ program correctly accounts for both backbone and χ1 torsion angles, while not including the effects of local steric clashes, bond angle and bond length distortions. DFT calculations indicate that such deviations from ideality, which occur in nature but are not easily captured by standard X-ray or NMR structure determination procedures, can significantly impact chemical shifts (Vila et al. 2008). Considering that these subtle local distortions are not adequately reflected in the reference structures, their impact on chemical shifts appears as “noise” when using experimentally assigned proteins as input for a program such as TALOS. As a result, the computationally “assigned” chemical shift values are therefore more closely correlated to backbone and χ1 sidechain torsion angles than are experimental chemical shifts.
For the ca 10% fraction of residues whose backbone torsion angles cannot be predicted uniquely by TALOS-N, but whose backbone is not dynamically disordered as judged by RCI-derived order parameters (Berjanskii and Wishart 2008), the (φ,ψ)-ANN predicted 324-state (φ,ψ) distribution frequently strongly limits the chemical shift compatible φ/ψ values to two small, discrete regions of the Ramachandran map, which may prove useful in structure determination efforts. Many of these “unpredictable” but ordered residues are located in turns, where the chemical shift signature of structure can be ambiguous. For these residues, training of an ANN to recognize specific turns as well as helical capping motifs forms the basis of the MICS program, which assigns probabilities that they are part of a specific turn or capping motif (Shen and Bax 2012). The MICS program therefore provides an important complement to TALOS-N, and when used jointly there remain very few ordered residues in a protein structure for which no specific structural information is available from the analysis of chemical shifts.
Supplementary Material
Acknowledgments
We thank Frank Delaglio for assistance and useful discussions. This work was funded by the Intramural Research Program of the NIDDK, NIH.
Footnotes
Software availability
The TALOS-N software package can be downloaded from http://spin.niddk.nih.gov/bax/software/TALOS-N and can be accessed in webserver mode from the same site.
References
- Berjanskii MV, Neal S, Wishart DS. PREDITOR: a web server for predicting protein torsion angle restraints. Nucleic Acids Res. 2006;34:W63–W69. doi: 10.1093/nar/gkl341. [DOI] [PMC free article] [PubMed] [Google Scholar]
- Berjanskii MV, Wishart DS. Application of the random coil index to studying protein flexibility. J Biomol NMR. 2008;40:31–48. doi: 10.1007/s10858-007-9208-0. [DOI] [PubMed] [Google Scholar]
- Berman HM, Kleywegt GJ, Nakamura H, Markley JL. The Protein Data Bank at 40: Reflecting on the past to prepare for the future. Structure. 2012;20:391–396. doi: 10.1016/j.str.2012.01.010. [DOI] [PMC free article] [PubMed] [Google Scholar]
- Bower MJ, Cohen FE, Dunbrack RL. Prediction of protein side-chain rotamers from a backbone-dependent rotamer library: A new homology modeling tool. J Mol Biol. 1997;267:1268–1282. doi: 10.1006/jmbi.1997.0926. [DOI] [PubMed] [Google Scholar]
- Butterfoss GL, Richardson JS, Hermans J. Protein imperfections: separating intrinsic from extrinsic variation of torsion angles. Acta Crystallogr Sect D-Biol Crystallogr. 2005;61:88–98. doi: 10.1107/S0907444904027325. [DOI] [PubMed] [Google Scholar]
- Case DA. Calibration of ring-current effects in proteins and nucleic acids. J Biomol NMR. 1995;6:341–346. doi: 10.1007/BF00197633. [DOI] [PubMed] [Google Scholar]
- Cheung M-S, Maguire ML, Stevens TJ, Broadhurst RW. DANGLE: A Bayesian inferential method for predicting protein backbone dihedral angles and secondary structure. J Magn Reson. 2010;202:223–233. doi: 10.1016/j.jmr.2009.11.008. [DOI] [PubMed] [Google Scholar]
- Chou JJ, Bax A. Protein side-chain rotamers from dipolar couplings in a liquid crystalline phase. J Am Chem Soc. 2001;123:3844–3845. doi: 10.1021/ja015660y. [DOI] [PubMed] [Google Scholar]
- Cornilescu G, Delaglio F, Bax A. Protein backbone angle restraints from searching a database for chemical shift and sequence homology. J Biomol NMR. 1999;13:289–302. doi: 10.1023/a:1008392405740. [DOI] [PubMed] [Google Scholar]
- Czinki E, Csaszar AG. Empirical isotropic chemical shift surfaces. J Biomol NMR. 2007;38:269–287. doi: 10.1007/s10858-007-9161-y. [DOI] [PubMed] [Google Scholar]
- de Dios AC, Pearson JG, Oldfield E. Secondary and tertiary structural effects on protein NMR chemical shifts - an ab initio approach. Science. 1993;260:1491–1496. doi: 10.1126/science.8502992. [DOI] [PubMed] [Google Scholar]
- Dunbrack RL, Karplus M. Conformational analysis of the backbone-dependent rotamer preferences of protein side-chains. Nature Structural Biology. 1994;1:334–340. doi: 10.1038/nsb0594-334. [DOI] [PubMed] [Google Scholar]
- Dzakula Z, Edison AS, Westler WM, Markley JL. Analysis of χ1 Rotamer populations From NMR data by the Cupid method. J Am Chem Soc. 1992a;114:6200–6207. [Google Scholar]
- Dzakula Z, Westler WM, Edison AS, Markley JL. The Cupid method for calculating the continuous probability- distribution of rotamers from NMR data. J Am Chem Soc. 1992b;114:6195–6199. [Google Scholar]
- Ester M, Kriegel HP, Sander J, Xu XW. In: Simoudis E, Han J, Fayyad UM, editors. A density-based algorithm for discovering clusters in large spatial databases with noise; Proceedings of the Second International Conference on Knowledge Discovery and Data Mining (KDD-96); AAAI Press; 1996. pp. 226–231. [Google Scholar]
- Ginzinger SW, Coles M. SimShiftDB; local conformational restraints derived from chemical shift similarity searches on a large synthetic database. J Biomol NMR. 2009;43:179–185. doi: 10.1007/s10858-009-9301-7. [DOI] [PMC free article] [PubMed] [Google Scholar]
- Haigh CW, Mallion RB. Ring current theories in nuclear magnetic resonance. Prog Nucl Magn Reson Spectrosc. 1979;13:303–344. [Google Scholar]
- Han B, Liu YF, Ginzinger SW, Wishart DS. SHIFTX2: significantly improved protein chemical shift prediction. J Biomol NMR. 2011;50:43–57. doi: 10.1007/s10858-011-9478-4. [DOI] [PMC free article] [PubMed] [Google Scholar]
- Huang KY, Amodeo GA, Tong LA, McDermott A. The structure of human ubiquitin in 2-methyl-2,4-pentanediol: A new conformational switch. Protein Sci. 2012;20:630–639. doi: 10.1002/pro.584. [DOI] [PMC free article] [PubMed] [Google Scholar]
- Jones DT. Protein secondary structure prediction based on position-specific scoring matrices. J Mol Biol. 1999;292:195–202. doi: 10.1006/jmbi.1999.3091. [DOI] [PubMed] [Google Scholar]
- Kabsch W, Sander C. Dictionary of protein secondary structure: pattern recognition of hydrogen-bonded and geometrical features. Biopolymers. 1983;22:2577–2637. doi: 10.1002/bip.360221211. [DOI] [PubMed] [Google Scholar]
- Kohlhoff KJ, Robustelli P, Cavalli A, Salvatella X, Vendruscolo M. Fast and accurate predictions of protein NMR chemical shifts from interatomic distances. J Am Chem Soc. 2009;131:13894–13895. doi: 10.1021/ja903772t. [DOI] [PubMed] [Google Scholar]
- Koonin EV, Galperin MY, editors. Sequence - Evolution - Function: Computational Approaches in Comparative Genomics. Boston: Kluwer Academic; 2003. [PubMed] [Google Scholar]
- Kryshtafovych A, Fidelis K, Moult J. CASP9 results compared to those of previous CASP experiments. Proteins-Structure Function and Bioinformatics. 2011;79:196–207. doi: 10.1002/prot.23182. [DOI] [PMC free article] [PubMed] [Google Scholar]
- Kuszewski J, Qin J, Gronenborn AM, Clore GM. The impact of direct refinement Against 13Cα and 13Cβ chemical-shifts on protein-structure determination by NMR. J Magn Reson Ser B. 1995;106:92–96. doi: 10.1006/jmrb.1995.1017. [DOI] [PubMed] [Google Scholar]
- Li DW, Bruschweiler R. PPM: a side-chain and backbone chemical shift predictor for the assessment of protein conformational ensembles. J Biomol NMR. 2012;54:257–265. doi: 10.1007/s10858-012-9668-8. [DOI] [PubMed] [Google Scholar]
- Li DW, Brüschweiler R. Certification of molecular dynamics trajectories with NMR chemical shifts. Journal of Physical Chemistry Letters. 2010;1:246–248. [Google Scholar]
- Markley JL, Ulrich EL, Berman HM, Henrick K, Nakamura H, Akutsu H. BioMagResBank (BMRB) as a partner in the Worldwide Protein Data Bank (wwPDB): new policies affecting biomolecular NMR depositions. J Biomol NMR. 2008;40:153–155. doi: 10.1007/s10858-008-9221-y. [DOI] [PMC free article] [PubMed] [Google Scholar]
- Miclet E, Boisbouvier J, Bax A. Measurement of eight scalar and dipolar couplings for methine-methylene pairs in proteins and nucleic acids. J Biomol NMR. 2005;31:201–216. doi: 10.1007/s10858-005-0175-z. [DOI] [PubMed] [Google Scholar]
- Mittermaier A, Kay LE. χ1 torsion angle dynamics in proteins from dipolar couplings. J Am Chem Soc. 2001;123:6892–6903. doi: 10.1021/ja010595d. [DOI] [PubMed] [Google Scholar]
- Moon S, Case DA. A new model for chemical shifts of amide hydrogens in proteins. J Biomol NMR. 2007;38:139–150. doi: 10.1007/s10858-007-9156-8. [DOI] [PubMed] [Google Scholar]
- Neal S, Nip AM, Zhang HY, Wishart DS. Rapid and accurate calculation of protein 1H, 13C and 15N chemical shifts. J Biomol NMR. 2003;26:215–240. doi: 10.1023/a:1023812930288. [DOI] [PubMed] [Google Scholar]
- Nielsen JT, Eghbalnia HR, Nielsen NC. Chemical shift prediction for protein structure calculation and quality assessment using an optimally parameterized force field. Prog Nucl Magn Reson Spectrosc. 2012;60:1–28. doi: 10.1016/j.pnmrs.2011.05.002. [DOI] [PMC free article] [PubMed] [Google Scholar]
- Robustelli P, Kohlhoff K, Cavalli A, Vendruscolo M. Using NMR chemical shifts as structural restraints in molecular dynamics simulations of proteins. Structure. 2010;18:923–933. doi: 10.1016/j.str.2010.04.016. [DOI] [PubMed] [Google Scholar]
- Rost B, Sander C. Prediction of protein secondary structure at better than 70 percent accuracy. J Mol Biol. 1993;232:584–599. doi: 10.1006/jmbi.1993.1413. [DOI] [PubMed] [Google Scholar]
- Sahakyan AB, Vranken WF, Cavalli A, Vendruscolo M. Structure-based prediction of methyl chemical shifts in proteins. J Biomol NMR. 2011;50:331–346. doi: 10.1007/s10858-011-9524-2. [DOI] [PubMed] [Google Scholar]
- Saito H. Conformation-dependent 13C chemical shifts - A new means of conformational characterization as obtained by high resolution solid state 13C NMR. Magn Reson Chem. 1986;24:835–852. [Google Scholar]
- Schmidt JM. Transforming between discrete and continuous angle distribution models: application to protein χ1 torsions. J Biomol NMR. 2012;54:97–114. doi: 10.1007/s10858-012-9653-2. [DOI] [PubMed] [Google Scholar]
- Shapovalov MV, Dunbrack RL. A smoothed backbone-dependent rotamer library for proteins derived from adaptive kernel density estimates and regressions. Structure. 2011;19:844–858. doi: 10.1016/j.str.2011.03.019. [DOI] [PMC free article] [PubMed] [Google Scholar]
- Shen Y, Bax A. Protein backbone chemical shifts predicted from searching a database for torsion angle and sequence homology. J Biomol NMR. 2007;38:289–302. doi: 10.1007/s10858-007-9166-6. [DOI] [PubMed] [Google Scholar]
- Shen Y, Bax A. SPARTA-plus: a modest improvement in empirical NMR chemical shift prediction by means of an artificial neural network. J Biomol NMR. 2010;48:13–22. doi: 10.1007/s10858-010-9433-9. [DOI] [PMC free article] [PubMed] [Google Scholar]
- Shen Y, Bax A. Identification of helix capping and beta-turn motifs from NMR chemical shifts. J Biomol NMR. 2012;52:211–232. doi: 10.1007/s10858-012-9602-0. [DOI] [PMC free article] [PubMed] [Google Scholar]
- Shen Y, Delaglio F, Cornilescu G, Bax A. TALOS+: a hybrid method for predicting protein backbone torsion angles from NMR chemical shifts. J Biomol NMR. 2009a;44:213–223. doi: 10.1007/s10858-009-9333-z. [DOI] [PMC free article] [PubMed] [Google Scholar]
- Shen Y, Vernon R, Baker D, Bax A. De novo protein structure generation from incomplete chemical shift assignments. J Biomol NMR. 2009b;43:63–78. doi: 10.1007/s10858-008-9288-5. [DOI] [PMC free article] [PubMed] [Google Scholar]
- Spera S, Bax A. Empirical correlation between protein backbone conformation and Cα and Cβ 13C nuclear magnetic resonance chemical shifts. J Am Chem Soc. 1991;113:5490–5492. [Google Scholar]
- Vijay-Kumar S, Bugg CE, Cook WJ. Structure of ubiquitin refined at 1.8 A resolution. J Mol Biol. 1987;194:531–544. doi: 10.1016/0022-2836(87)90679-6. [DOI] [PubMed] [Google Scholar]
- Vila JA, Aramini JM, Rossi P, Kuzin A, Su M, Seetharaman J, Xiao R, Tong L, Montelione GT, Scheraga HA. Quantum chemical 13Cα chemical shift calculations for protein NMR structure determination, refinement, and validation. Proc Natl Acad Sci U S A. 2008;105:14389–14394. doi: 10.1073/pnas.0807105105. [DOI] [PMC free article] [PubMed] [Google Scholar]
- Vila JA, Arnautova YA, Martin OA, Scheraga HA. Quantum-mechanics-derived 13Cα chemical shift server (CheShift) for protein structure validation. Proc Natl Acad Sci U S A. 2009;106:16972–16977. doi: 10.1073/pnas.0908833106. [DOI] [PMC free article] [PubMed] [Google Scholar]
- Vila JA, Serrano P, Wuethrich K, Scheraga HA. Sequential nearest-neighbor effects on computed 13Cα chemical shifts. J Biomol NMR. 2010;48:23–30. doi: 10.1007/s10858-010-9435-7. [DOI] [PMC free article] [PubMed] [Google Scholar]
- Villegas ME, Vila JA, Scheraga HA. Effects of side-chain orientation on the 13C chemical shifts of antiparallel beta-sheet model peptides. J Biomol NMR. 2007;37:137–146. doi: 10.1007/s10858-006-9118-6. [DOI] [PubMed] [Google Scholar]
- Williamson MP, Asakura T. Empirical comparisons of models for chemical-shift calculation in proteins. J Magn Reson B. 1993;101:63–71. [Google Scholar]
- Wishart DS. Interpreting protein chemical shift data. Prog Nucl Magn Reson Spectrosc. 2011;58:62–87. doi: 10.1016/j.pnmrs.2010.07.004. [DOI] [PubMed] [Google Scholar]
- Wishart DS, Sykes BD, Richards FM. Relationship between nuclear magnetic resonance chemical shift and protein secondary structure. J Mol Biol. 1991;222:311–333. doi: 10.1016/0022-2836(91)90214-q. [DOI] [PubMed] [Google Scholar]
- Xu XP, Case DA. Automated prediction of 15N, 13Cα, 13Cβ and 13C′ chemical shifts in proteins using a density functional database. J Biomol NMR. 2001;21:321–333. doi: 10.1023/a:1013324104681. [DOI] [PubMed] [Google Scholar]
Associated Data
This section collects any data citations, data availability statements, or supplementary materials included in this article.