

Abstract
Electrocorticography (ECoG) has emerged as a new signal platform for brain-computer interface (BCI) systems. Classically, the cortical physiology that has been commonly investigated and utilized for device control in humans has been brain signals from sensorimotor cortex. Hence, it was unknown whether other neurophysiological substrates, such as the speech network, could be used to further improve on or complement existing motor-based control paradigms. We demonstrate here for the first time that ECoG signals associated with different overt and imagined phoneme articulation can enable invasively monitored human patients to control a one-dimensional computer cursor rapidly and accurately. This phonetic content was distinguishable within higher gamma frequency oscillations and enabled users to achieve final target accuracies between 68 and 91% within 15 minutes. Additionally, one of the patients achieved robust control using recordings from a microarray consisting of 1 mm spaced microwires. These findings suggest that the cortical network associated with speech could provide an additional cognitive and physiologic substrate for BCI operation and that these signals can be acquired from a cortical array that is small and minimally invasive.
Keywords: cortex, electrocorticography, gamma rhythms, human, speech, phoneme
1. Introduction
The use of electrocorticographic (ECoG) signals has recently gained substantial interest as a practical and robust platform for basic and translational neuroscience research. This interest is based in part on ECoG’s robustness, but also on its tradeoff of signal fidelity and invasiveness. Compared with scalp-recorded electroencephalographic (EEG) signals, ECoG has much larger signal magnitude, increased spatial resolution (0.1 cm vs 5.0 cm for EEG), and higher frequency bandwidth (0–500 vs. 0–40 Hz for EEG) (Ball et al., 2009; Freeman et al., 2003; Boulton et al., 1990; Slutz ky et al., 2010). Of particular note, amplitudes in frequencies higher than 40 Hz carry information that appears to be particularly amenable to BCI operation. These signals, which are challenging to detect with EEG, are thought to be produced by smaller cortical assemblies and show stronger correlations with neuronal action potential firings than classic lower frequency rhythms (Ray et al., 2008; Heldman et al., 2006). Furthermore, these high-frequency changes have also been associated with numerous aspects of speech and motor function in humans (Crone et al., 2001a; Crone et al., 2001b; Crone et al., 1998; Leuthardt et al., 2004; Schalk et al., 2007b; Wisneski et al., 2008){Pei, 2010 #1175}. Because ECoG electrodes do not penetrate the brain, they have been shown to have superior long-term stability in different animal models (Bullara et al., 1979; Loeb et al., 1977; Yuen et al., 1987; Margalit et al., 2003; Chao et al., 2010). In addition to its superior long-term stability, a study recently showed that the neural substrate that encodes movements is also stable over many months (Chao et al., 2010). In summary, there is substantial evidence that ECoG should have critical advantages for brain-computer interface (BCI) operation.
Up to now, ECoG signals have been used to achieve rapid acquisition of control in one- and two- dimensional cursor tasks in humans using actual and imagined motor movements (Leuthardt et al., 2004; Schalk et al., 2008a). It was unknown whether other neurophysiological substrates, such as the speech network, could be used to further improve on or complement existing motor-based control paradigms. Human speech has been extensively studied using different types of neuroimaging (i.e., positron emission spectroscopy (PET) or functional magnetic resonance imaging (fMRI)), neurophysiological functional mapping (i.e., magnetic resonance imaging (MEG) or ECoG), lesional models, or behavioral studies (Price et al., 1996; Fiez and Petersen, 1998; Towle et al., 2008; Sinai et al., 2005; Crone et al., 2001a; Pulvermuller et al., 2006; Dronkers et al., 2004). These and other studies have shown that speech processing involves a widely distributed network of cortical areas that are located predominantly in the temporal perisylvian regions (Specht and Reul, 2003; Scott and Johnsrude, 2003). In particular, these regions include Wernicke’s area, which is located in the posterior-superior temporal lobe, and Broca’s area, located in the posterior-inferior frontal gyrus (Fiez and Petersen, 1998; Towle et al., 2008; Billingsley-Marshall et al., 2007). Other findings have suggested that left premotor cortex also plays a major role in language tasks, in particular for the planning of articulation and speech production (Duffau et al., 2003; Heim et al., 2002). Given the numerous cortical networks associated with speech and the intuitive nature by which people regularly imagine speech, the separable physiology and the different cognitive task of utilizing speech may provide the basis for BCI control that can be used independently or as an adjunct to motor-derived control. Some recent studies have begun to explore the value of these language networks for the purpose of neuroprosthetic applications. Wilson et al. demonstrated that auditory cortex can be used for real-time control of a cursor (Wilson et al., 2006). More recent studies have shown initial evidence that some phonemes and words are separable during actual speech with ECoG (Blakely et al., 2008b; Kellis et al.; Schalk et al., 2007a), but concrete evidence that BCI control can be achieved using the speech network has been absent.
In this study, we examined the possibility that different elements of speech, in particular real and imagined articulation of phonemic sounds, can be used to achieve ECoG-based device control. We demonstrate for the first time that the electrocorticographic signals associated with speech can be effectively used to select from one of two choices with minimal training. These findings further extend the cognitive and cortical signal repertoire that may be used to functionally augment patients with severe disabilities.
2. Patients and Methods
2.1 Patients
This study included four patients (ages 36–48) with intractable epilepsy undergoing temporary placement of a subdural electrode array (4 left hemispheric 8×8 grids) for clinical monitoring to identify and resect their epileptic foci. The study was approved by the Human Research Protection Organization of the Washington University Medical Center. Prior to inclusion in the study, patients gave their written informed consent. A craniotomy was performed to place the electrode array according to clinical criteria (Figure 1). Patients were then moved to a 24-hour video monitoring unit for a period of approximately one week, during which time the data for this study were collected. Patients had no prior training on a BCI system. Demographic and clinical information for each of the four study participants is shown in Table 1.
Fig. 1. Micro and Macro Grid arrays.

(A & B) Micro array size and configuration. C) Intraoperative view of macro grid array. D) Lateral Radiograph of the skull with macro array.
Table 1.
Demographic and clinical information for the four patients.
| Patient | Age | Sex | Cognitive capacity | Speech capacity | Age at seizure onset | Seizure type | Seizure focus |
|---|---|---|---|---|---|---|---|
| 1 | 48 | F | Normal | Normal | 1.5 | CP | L Temporal |
| 2 | 45 | F | Normal | Normal | 14 | CP | L Temporal Parietal Region |
| 3 | 49 | M | Normal | Normal | 45 | CP | L Temporal |
| 4 | 36 | F | Normal | Normal | .5 | CP | L Frontal Lobe |
CP- Complex Partial, M – Male, F – Female, L - Left
2.2 Signal Acquisition
Electrode arrays (AdTech, Racine, WI) consisted of 64 electrodes (8×8) spaced 10 mm apart, with a 2.3 mm diameter exposed surface. Additionally, Subject 2 had an experimental microarray placed. This array consisted of 16 microwires, 75 microns in diameter, that were spaced 1 mm apart (Figure 1). Electrocortical signals were acquired using g.tecbiosignal amplifiers (Graz, Austria). All signals were internally sampled at 38.4kHz with a 6.6kHz low pass filter. For Patients 1–3, the signals were then digitally bandpass filtered within the amplifiers between 0.1Hz and 500Hz, and subsequently downsampled to a 1200Hz output sampling rate. The data for Patient 4 was digitally lowpass filtered at 4800 Hz and downsampled to 9600Hz. A Dell computer running the BCI2000 software, a platform for real-time stimulus presentation and time-locked acquisition and analysis of brain signals, was used to acquire, process and store the data (Schalk et al., 2004; Schalk and Mellinger, 2010). The amount of data collected from each subject varied depending on the subject’s physical health and willingness to continue.
2.3 Screening for Control Features
Patients underwent initial screening to identify control features for use in subsequent closed-loop control experiments. This screening procedure began with an experiment in which ECoG signals were recorded while the subject either overtly (patient 1, 2, and 3) or covertly (patient 3 and 4) expressed a series of four phonemes (‘oo’, ‘ah’, ‘eh’, and ‘ee’) or rested. Cues for the rest and phoneme tasks were presented as words on a video screen that was positioned about 75 cm in front of the subject. Cues were presented in random order for a period of 2–3 seconds, during which the subject repeatedly performed the specified action (e.g., to repeatedly say ‘oo’). During intervals between cued activity, patients were instructed to remain inactive.
The data collected during this screening experiment were converted to the frequency domain by autoregressive spectral estimation in 2 Hz bins ranging from 0 to 550 Hz. For each electrode and frequency bi n, candidate features were identified by calculating the coefficient of determination (r2) between the “rest” spectral power levels and the activity spectral power levels for each phoneme, and also between spectral power levels for all possible phoneme combinations. Those ECoG features (particular electrodes and frequency bins) with the highest r2 values, i.e., the features that had most of their variance explained by the task, were chosen as control features for subsequent closed-loop control experiments. Electrode selection was further constrained to anatomic areas associated with speech processing (i.e., motor cortex, Wernicke’s, and Broca’s area) (see Figure 2). Because the microgrid had to positioned outside the clinical grid, this was placed more peripherally on dorsal premotor cortex. These areas were determined by the electrode’s Talairach coordinate, which was derived using lateral radiographs and the getLOC MATLAB package (Miller et al., 2007). (See Figure 3 for electrode locations)
Fig. 2. Screening for Control Features.

Patients underwent initial screening to identify control features for use in subsequent closed-loop control experiments. Exemplar data from Patient 1 illustrates the screening process. The screening data was converted to the frequency domain by autoregressive spectral estimation. This exemplar feature plot (A) shows the r2 values between trials when the patient spoke the phonemes “oo” and “ee” for 25 trials of each. For each electrode and frequency bin,the significant task related spectral power increases or decreases were identified by calculating the r2 value between the baseline spectra and the activity spectra for each of phoneme speech tasks and between the phonemes. Note that the greatest contrast occurs on electrode 48 between 75–175Hz. Those ECoG features (i.e., particular electrodes and frequency bins) with the most substantive changes in power (B) that accounted for a significant amount of the variance between the tasks [as indicated by their relatively higher r2 values(C)], were chosen as potential control features for the subsequent closed loop control experiments. (D) The anatomic distribution of r2 values for the control frequencies (75–100Hz). The location of ECoG features used for BCI control was constrained to perisylvian areas involved in the speech network.
Fig. 3. Electrode Localization.

The electrode positions for each patient are shown on the Montreal Neurologic Institute standardized brain. These sites were determined by the electrode’s Talairach coordinate, which was derived using lateral radiographs and the getLOC MATLAB package (Miller et al., 2007). The electrodes used for device control are indicated in red.
2.4. Closed-Loop Control Experiments
Using the ECoG features and their associated tasks that were derived using the screening procedure above, the patients participated in closed-loop control experiments (Figure 4) during which the patients’ objective was to perform the particular phoneme articulation task so as to move a cursor on a screen along one dimension to hit a presented targeted on either side of the screen. Two scenarios were tested, 1) overt phoneme vs. phoneme (patients 1&2); and 2) imagined phoneme vs. rest (patients 3 & 4). Cursor velocity was derived from the ECoG features in real-time by the BCI2000 software package as follows. The power levels of the identified ECoG features (i.e., the power in the particular frequency bin at the particular electrode) were weighted and summed in order to provide the patient an intuitive means of cursor control. Features with task-related power decreases were first assigned negative weights so that all features had task-related score increases. For patients that achieved control using two different phonemes, one phoneme-related feature was weighted to give the cursor a positive score and the other a negative score to create a push-pull control mechanism. For patients that achieved control using a single phoneme and rest, the phoneme feature was weighted to give the cursor a positive score. To translate the summated feature power levels into a cursor score, the scores were normalized. Using the weighted and summed features, the normalizer was trained on several trials for each direction in which the patient attempted to use the control tasks (i.e. speaking phonemes, imaging phonemes or resting) to control the cursor. After the training period (approximately 1 minute), the mean and variance of the weighted and summed features from the training trials were calculated. The mean and variance were then used to normalize the scores to have zero mean and unit variance. The normalized score then set the cursor velocity. Cursor velocity was updated every 40 ms and based on spectral estimates acquired over the previous 280 ms. Patients performed consecutive trials attempting to move the cursor to targets. Each trial began with the appearance of a target that was placed randomly at the left or right side of the screen. After a 1 s delay, a cursor appeared in the middle of the screen with its one-dimensional left or right movement driven by the subject’s ECoG signals as described above. The subject would perform the particular task or rest in order to move the cursor toward the target on the left or right of the screen, respectively. Each trial ended with either success (cursor hit the target), failure (cursor hit side of the screen opposite the target), or a time-out (time ran out before success or failure occured, 8–15 secs). Trials were grouped into blocks of up to 3 minutes, separated by rest periods of approximately 1 minute. Accuracy, calculated as number of successes divided by the total number of trials, was assessed after each block. Performance curves were assessed over the entire duration of the closed-loop experiments (multiple blocks) after training with a particular task and associated set of control features. Chance performance levels were determined by running 32 blocks of 425 control trials using only white Gaussian noise signals. Mean chance performance was 46.2% (2.7% SD). Patients performed between 61–139 trials for control (Patient 1, 98 trials. Patient 2, 139 trials. Patient 3, 61 trials. Patient 4, 69 trials.)
Fig. 4. Closed Loop Control With Real and Imagined Speech.

Experimental setup for closed-loop control task. On screen cursor moves toward target with performance of appropriate phoneme articulation. Cursor movement is determined by pre-screened control features from the ECoG signals recorded directly from the patient’s cortex.
3. Results
Each subject demonstrated notable widespread cortical activations associated with overt and imagined phoneme articulation. In particular, this is demonstrated in the classic high gamma band (75–100Hz) that has been used for speech mapping in the past (Wu et al.) (See Figure. 5). Additionally, in each subject, particular locations and ECoG frequencies separated phonemes from rest, and also phonemes from each other. These locations were in Wernicke’s area (BA 40), Auditory Cortex (BA 42 and BA 22), Premotor Cortex (BA 6), and Sensorimotor Cortex (BA 3). For each of the patients, one or more sites were utilized to either distinguish the phoneme articulation versus rest (subject 3 & 4), or one phoneme versus another phoneme (subject 1 & 2). (Summarized in Figure. 6). Figure 3 illustrates the cortical location of each patient’s electrodes highlighting the electrodes used for online control. Consistent with findings by Gaona et al., that demonstrated significant nonuniform behavior of gamma activity during speech tasks, we observed that a cortical activation for different phonemes could occur at different gamma frequencies, even within the same location{Gaona, 2011 #1187}. These frequencies varied substantially and occurred as high as 550 Hz. Also of note in the patient who was screened for both real and imagined phonemes, the ECoG differences, with regards to their topographical and frequency distribution, were often distinct between real and imagined phoneme articulation. These differences are shown for Subject 3 in color-coded time-frequency plots with the correlate anatomic location (Figure. 7).
Fig. 5. Cortical Activation During Real and Imagined Phoneme Articulation.
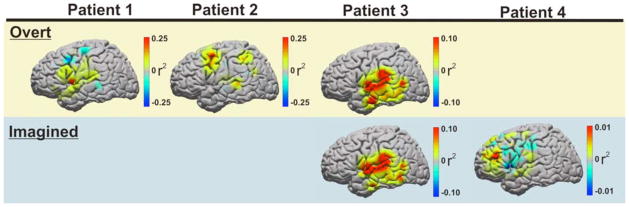
Topographic distribution of cortical activation for each patient as represented by statistically significant (p < 0.001) r2 values increases in classic high gamma frequency amplitudes (75–100Hz) during real and imagined speech articulation. Yellow row represents topographic distribution of cortical activation associated with overt articulation screening (patients 1–3). Blue row represents topographic distribution of cortical activation associated with imagined articulation screening (patients 3 & 4).
Fig. 6. Summary of Screening Data for Control Signals.
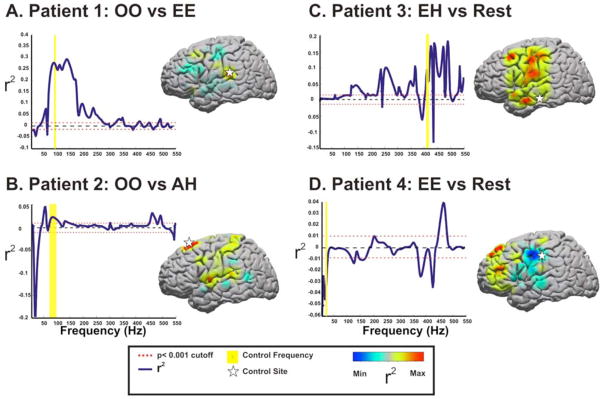
The optimal comparison of various phoneme articulations against each other or against rest are shown for each subject. In the r2 vs. frequency line plots, the dotted red line represents a p-value cutoff of p <0.001 for the r2values displayed. The data from these line plots are anatomically derived from the site identified by the star. These sites were also chosen as subsequent control features. The yellow bar represents the frequency that was chosen for control. The color distribution on the adjacent standardized brains represents the topographic distribution of the maxima and minima of r2values acquired for the conditional comparisons of the selected frequency band.
Fig. 7. Difference between real and imagined speech.

Time frequency plots from three exemplar electrodes (Patient 3, sensorimotor cortex, angular gyrus, and the temporal lobe) that demonstrate substantial differences in power modulation depending on whether overt or imagined speech screening was performed. Time zero indicates the time when the visual cue for a phoneme was presented. Significant power modulation was thresholded to a p-value < 0.05. Only power modulations surpassing that threshold are shown. Statistics were calculated over 160 trials for overt speech and 99 trials for imagined speech.
The time course of the subject’s performance during online control is shown in Figure 8. Final target accuracies for all patients were between 68 and 91% (chance performance = 46.2%). Closed-loop control experiment durations ranged from 4 to 15 minutes. Table 2 summarizes the tasks performed, ECoG features used, and final accuracies achieved by the patients during each of the control experiments. Data is shown in Figure 9 to demonstrate the different topographic and spectral activations associated with distinct phoneme articulations.
Fig 8. Learning curves for BCI control tasks.

All patients finished with greater than 69% accuracy after 4 to 15 minutes of closed-loop control experiments.
Table 2.
Closed Loop Speech BCI Performance Data.
| Patient | Task (Direction) | Brodmann Area | Frequency Used | Final Accuracy |
|---|---|---|---|---|
| 1 | EE—Right OO – Left |
42 | 92.5 – 97.5 Hz | 91% |
| 2 | OO—Right AH—Left |
6 | 410–420 Hz | 76% |
| 3 | AH—Right Rest—Left |
40 | 75–100 Hz | 73% |
| 4 | EE—Right Rest—Left |
3 22 43 |
40 Hz 560 Hz 550 Hz |
69% |
Fig. 9. Separable features between phoneme articulation.
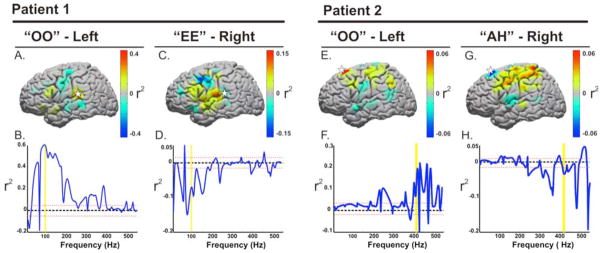
Data taken from Subjects 1 and 2 who demonstrated significant spectral and anatomic differences in phoneme articulation. For Patient 1, A & C, demonstrate the variable cortical topographies of activation that are different between imagined “oo” and “ee.” (B and D) represent the associated variance of the power change (r2) associated with the two conditions compared to rest across spectral estimates from 25 trials of each phoneme (positively or negatively weighted depending on the increase or decrease of power, respectively). The power increase at 95 Hz was used to drive the cursor to the left, while the power decrease associated with “ee” drove the cursor to the right. Similarly, the large scale spectral topographies were separable for Patient 2 (E and G). The control features shown in F and H, however, were taken from dorsal premotor cortex recorded with a microgrid array (shown in Figure 10). Statistics were calculated using spectral estimates from 24 trials of each phoneme. The dotted red line represents a p-value cutoff of p <0.001 for the r2 values displayed.
Our findings demonstrate that there are widespread variations in topographic activations between different phoneme articulations that provide signals that could be used for device control. Such differences between phonemes were also present on the microscale. Subject 2 had a microgrid that was placed over dorsal premotor cortex. The feature plot in Figure 10 demonstrates anatomically and spectrally diverse changes that occurred at very high frequencies that enabled effective control of a cursor. (See movie in Supplemental Data.)
Fig. 10. Separable features between phoneme articulation on the microscale.
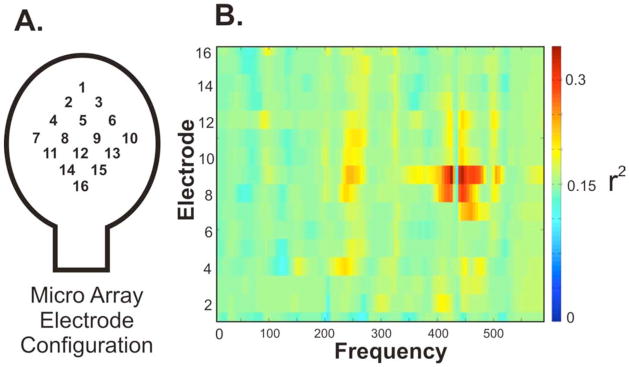
Data taken from Subject 2. (A) Electrode configuration of micro electrode array. (B) Feature plot demonstrating the very local high frequency change that was distinct between overt articulation of “oo” and “ah.” Statistics were calculated using spectral estimates from 24 trials of each phoneme.
4. Discussion
This study reports the first demonstration that neural correlates of different actual and imagined phoneme articulations can be used for rapid and effective control of a cursor on a screen. This is also the first demonstration that microscale ECoG recordings can be utilized for device control in humans. These findings further expand the range of ECoG signals that could be used for neuroprosthetic operation, and also demonstrate that the implant array may be quite small and minimally invasive.
The results of this work build on previous ECoG-related and other BCI studies. Previous ECoG-BCI experiments for device operation have thus far primarily used cortical physiology associated with motor movements or imagery (Schalk et al., 2008a; Leuthardt et al., 2004; Leuthardt, 2005; Hinterberger et al., 2008). Generally, these have included hand movements, tongue movements, and articulation of single words. More recently there has been work to extend the control repertoire available to ECoG-BCI systems. Wilson et al showed that non-motor regions (e.g., auditory cortex) can also be engaged by an individual to achieve brain derived control (Wilson et al., 2006). Wisneski et al. demonstrated that signals associated with ipsilateral motor intentions could also be used (Wisneski et al., 2008). Beyond using alternate motor signals and plasticity, recent work by Vansteensel et al. has shown that a wholly non-motor system, namely the left dorsolateral prefrontal cortex, can also be utilized for device operation (Vansteensel et al., 2010). The findings in our present work extend this exploration into the cortical networks associated with speech. This system may provide distinct advantages for neuroprosthetic operation. Both real and imagined speech are commonly utilized by an individual in day-to-day life (we are often talking to others overtly and ourselves covertly). Thus, using this cognitive operation may offer the opportunity for a more intuitive and easy to operate system. In contrast, this is distinct from the non-motor operations presented by Vansteensel et al. where to achieve control required the performance of serial subtractions. That said, while achievement of control required serial subtractions would likely be too distracting and less practical in a real world setting, with training patients may be able to produce the necessary control. On this topic, it is encouraging that two of our four patients immediately had greater that 90% accuracy without any prior training. Moreover, all patients achieved high levels of control in minutes, similar to results achieved previously only for ECoG-based BCIs based on actual/imagined motor tasks (Leuthardt et al., 2004; Leuthardt, 2005; Schalk et al., 2008a).
Though performance of control with speech related physiology was comparable to motor physiology derived BCI operation, there are some notable distinctions that should be highlighted between these two systems. Motor signals used for BCI operation tend to be much more focal within primary motor cortex. Speech signals, however, engage broad regions of the brain, focused primarily around perisylvian cortex (Specht and Reul, 2003; Scott and Johnsrude, 2003). Consistent with this broad network, we found that there were numerous motor and non-motor areas that could be used for control. Given that there are multiple levels by which speech is processed (i.e., auditory, phonological, semantic, motor preparation/execution), this would explain why different areas are able to enable one to distinguish phonemes at numerous different sites. Namely, that they may represent different elements of processing along the language hierarchy (Binder, 2000; Binder et al., 2000; Binder et al., 1997; Binder et al., 2003; Binder et al., 1994). This broad network is attractive from an implant standpoint. The notion that the entire perisylvian region could be used would make a speech derived BCI potentially more flexible in where it would need to placed. Another key difference from the motor BCI experience is the differences between actual and imagined performance of the task. These findings are consistent with other fMRI and ECoG studies that have also noted differences in overt and covert speech (Palmer et al., 2001; Pei et al., 2010). The substantial difference between actual and imagined speech is in marked contrast to results from EEG and ECoG-based studies that demonstrated that motor movements and motor imagery have similar neural signatures (McFarland et al., 2000; Miller et al., 2010). This is an important consideration for optimally screening signals that will be subsequently used for BCI control.
There has been growing interest in microscale ECoG recordings. Recent studies have shown that a substantial amount of motor and speech information can be derived from closely spaced and small electrodes on the order of millimeters(Leuthardt et al., 2009a; Kellis et al.; Blakely et al., 2008a; Wang et al., 2009). In this study, the microgrid was located over dorsal premotor cortex. Though ventral premotor cortex is putatively thought be associated with Broca’s region and language expression, recent studies have demonstrated that dorsal premotor cortex plays a role in the dorsal stream of language processing in which sublexical acoustic information is transformed into motoric articulation (Hickok and Poeppel, 2007; Saur et al., 2008). This study is the first to use this differential information for BCI device control. Additionally, the small scale with which speech information was acquired and used in this study has important surgical implications for future brain-computer interface applications. To date, ECoG recordings have primarily been conducted using electrode arrays that were made specifically for epilepsy monitoring. The role of these grid electrodes is to achieve broad cortical coverage for the localization of a seizure focus. As a result, they require a fairly large craniotomy for their placement. The demonstration that separable speech intentions can be acquired from a site in premotor cortex that is less than a centimeter indicates that the practical array for neuroprosthetic applications may only require a relatively small burr hole. This would significantly reduce the risk of the surgical procedure for placement of the BCI construct. Furthermore, previous studies have shown that epidurally acquired ECoG signal can be utilized for brain derived device control (Leuthardt et al., 2006) and that when compared to subdural signals in rats and humans appear to be similar(Slutzky et al., 2010). If the quality of these microscale signals is preserved above and below the dura, a construct that requires a burr hole and an epidural array could be even less risky. At the same time, it is important to note that signal characteristics in open-loop situations may not generalize to closed-loop situations. Thus, the practical influence on BCI performance of different recording techniques (e.g., epidural vs. subdural) needs to be empirically tested in online experiments. The significant risk reduction could improve the risk-benefit consideration for implantation in either medically fragile patients (e.g., amyotrophic lateral sclerosis) or in patients for whom the construct would be placed over normal brain (e.g., spinal cord injury and unaffected hemisphere in unilateral stroke). This ultimately could hasten the adoption of the BCI technology across a wider patient population.
Though we report an exciting initial demonstration of what may be possible using speech networks in humans and microscale signals, there are some important limitations and future considerations that merit attention. This study utilized different phonemes as the cognitive task for device operation. This was done intentionally to cover the vowel articulation space. These phonemes, however, likely do not access higher order lexical processing. Thus, in this work, lower order phonetic processing can indeed be used for BCI operation, but whether higher order semantic encoding can be used remains unknown. Fortunately, there is preliminary evidence from several groups that consonants, vowels, and whole words are distinguishable use macro and microscale ECoG (Kellis et al.; Schalk et al., 2007a; Schalk et al., 2008b). Their utility for BCI operation will need to be studied further. Ideally, these speech related signals would provide additive control features to those provided by more established motor paradigms. The question of whether a multimodal BCI incorporating different cognitive operations will provide added operational benefit will also require explicit validation(Leuthardt et al., 2009b).
In summary, these results push forward the broad potential of the ECoG signal platform for neuroprosthetic application. The study shows that speech operations can be exploited for control signals from small regions of cortex within a broad perisylvian network. Additionally, that separable control signals are accessible on the microscale (1mm) further supports the notion that ECoG neuroprosthetics could be minimally invasive.
Footnotes
Disclosures: ECL & GS have stock ownership in the company Neurolutions
References
- Ball T, Kern M, Mutschler I, Aertsen A, Schulze-Bonhage A. Signal quality of simultaneously recorded invasive and non-invasive EEG. Neuroimage. 2009;46:708–16. doi: 10.1016/j.neuroimage.2009.02.028. [DOI] [PubMed] [Google Scholar]
- Billingsley-Marshall RL, Clear T, Mencl WE, Simos PG, Swank PR, Men D, Sarkari S, Castillo EM, Papanicolaou AC. A comparison of functional MRI and magnetoencephalography for receptive language mapping. J Neurosci Methods. 2007;161:306–13. doi: 10.1016/j.jneumeth.2006.10.020. [DOI] [PubMed] [Google Scholar]
- Binder J. The new neuroanatomy of speech perception. Brain. 2000;123(Pt 12):2371–2. doi: 10.1093/brain/123.12.2371. [DOI] [PubMed] [Google Scholar]
- Binder JR, Frost JA, Hammeke TA, Bellgowan PS, Springer JA, Kaufman JN, Possing ET. Human temporal lobe activation by speech and nonspeech sounds. Cereb Cortex. 2000;10:512–28. doi: 10.1093/cercor/10.5.512. [DOI] [PubMed] [Google Scholar]
- Binder JR, Frost JA, Hammeke TA, Cox RW, Rao SM, Prieto T. Human brain language areas identified by functional magnetic resonance imaging. J Neurosci. 1997;17:353–62. doi: 10.1523/JNEUROSCI.17-01-00353.1997. [DOI] [PMC free article] [PubMed] [Google Scholar]
- Binder JR, McKiernan KA, Parsons ME, Westbury CF, Possing ET, Kaufman JN, Buchanan L. Neural correlates of lexical access during visual word recognition. Journal of cognitive neuroscience. 2003;15:372–93. doi: 10.1162/089892903321593108. [DOI] [PubMed] [Google Scholar]
- Binder JR, Rao SM, Hammeke TA, Yetkin FZ, Jesmanowicz A, Bandettini PA, Wong EC, Estkowski LD, Goldstein MD, Haughton VM, et al. Functional magnetic resonance imaging of human auditory cortex. Annals of neurology. 1994;35:662–72. doi: 10.1002/ana.410350606. [DOI] [PubMed] [Google Scholar]
- Blakely T, Miller KJ, Rao RP, Holmes MD, Ojemann JG. Localization and classification of phonemes using high spatial resolution electrocorticography (ECoG) grids. Conf Proc IEEE Eng Med Biol Soc. 2008a:4964–7. doi: 10.1109/IEMBS.2008.4650328. [DOI] [PubMed] [Google Scholar]
- Blakely T, Miller KJ, Rao RPN, Holmes MD, Ojemann JG. Localization and classification of phonemes using high spatial resolution electrocorticography (ECoG) grids. 30th Annual International IEEE EMBS Conference; Vancouver, British Columbia. 2008b. [DOI] [PubMed] [Google Scholar]
- Boulton AA, Baker GB, Vanderwolf CH. Neurophysiological Techniques, II: Applications to Neural Systems. Humana Press; 1990. [Google Scholar]
- Bullara LA, Agnew WF, Yuen TG, Jacques S, Pudenz RH. Evaluation of electrode array material for neural prostheses. Neurosurgery. 1979;5:681–6. doi: 10.1227/00006123-197912000-00006. [DOI] [PubMed] [Google Scholar]
- Chao ZC, Nagasaka Y, Fujii N. Long-term asynchronous decoding of arm motion using electrocorticographic signals in monkeys. Front Neuroengineering. 2010;3:3. doi: 10.3389/fneng.2010.00003. [DOI] [PMC free article] [PubMed] [Google Scholar]
- Crone NE, Boatman D, Gordon B, Hao L. Induced electrocorticographic gamma activity during auditory perception. Brazier Award-winning article, 2001. Clin Neurophysiol. 2001a;112:565–82. doi: 10.1016/s1388-2457(00)00545-9. [DOI] [PubMed] [Google Scholar]
- Crone NE, Hao L, Hart J, Jr, Boatman D, Lesser RP, Irizarry R, Gordon B. Electrocorticographic gamma activity during word production in spoken and sign language. Neurology. 2001b;57:2045–53. doi: 10.1212/wnl.57.11.2045. [DOI] [PubMed] [Google Scholar]
- Crone NE, Miglioretti DL, Gordon B, Lesser RP. Functional mapping of human sensorimotor cortex with electrocorticographic spectral analysis. II. Event-related synchronization in the gamma band. Brain. 1998;121 (Pt 12):2301–15. doi: 10.1093/brain/121.12.2301. [DOI] [PubMed] [Google Scholar]
- Dronkers NF, Wilkins DP, Van Valin RD, Jr, Redfern BB, Jaeger JJ. Lesion analysis of the brain areas involved in language comprehension. Cognition. 2004;92:145–77. doi: 10.1016/j.cognition.2003.11.002. [DOI] [PubMed] [Google Scholar]
- Duffau H, Capelle L, Denvil D, Gatignol P, Sichez N, Lopes M, Sichez JP, Van Effenterre R. The role of dominant premotor cortex in language: a study using intraoperative functional mapping in awake patients. Neuroimage. 2003;20:1903–14. doi: 10.1016/s1053-8119(03)00203-9. [DOI] [PubMed] [Google Scholar]
- Fiez JA, Petersen SE. Neuroimaging studies of word reading. Proc Natl Acad Sci U S A. 1998;95:914–21. doi: 10.1073/pnas.95.3.914. [DOI] [PMC free article] [PubMed] [Google Scholar]
- Freeman WJ, Holmes MD, Burke BC, Vanhatalo S. Spatial spectra of scalp EEG and EMG from awake humans. Clin Neurophysiol. 2003;114:1053–68. doi: 10.1016/s1388-2457(03)00045-2. [DOI] [PubMed] [Google Scholar]
- Heim S, Opitz B, Friederici AD. Broca’s area in the human brain is involved in the selection of grammatical gender for language production: evidence from event-related functional magnetic resonance imaging. Neurosci Lett. 2002;328:101–4. doi: 10.1016/s0304-3940(02)00494-9. [DOI] [PubMed] [Google Scholar]
- Heldman DA, Wang W, Chan SS, Moran DW. Local field potential spectral tuning in motor cortex during reaching. IEEE Trans Neural Syst Rehabil Eng. 2006;14:180–3. doi: 10.1109/TNSRE.2006.875549. [DOI] [PubMed] [Google Scholar]
- Hickok G, Poeppel D. The cortical organization of speech processing. Nat Rev Neurosci. 2007;8:393–402. doi: 10.1038/nrn2113. [DOI] [PubMed] [Google Scholar]
- Hinterberger T, Widman G, Lal TN, Hill J, Tangermann M, Rosenstiel W, Scholkopf B, Elger C, Birbaumer N. Voluntary brain regulation and communication with electrocorticogram signals. Epilepsy Behav. 2008;13:300–6. doi: 10.1016/j.yebeh.2008.03.014. [DOI] [PubMed] [Google Scholar]
- Kellis S, Miller K, Thomson K, Brown R, House P, Greger B. Decoding spoken words using local field potentials recorded from the cortical surface. J Neural Eng. 7:056007. doi: 10.1088/1741-2560/7/5/056007. [DOI] [PMC free article] [PubMed] [Google Scholar]
- Leuthardt EC, Freudenberg Z, Bundy D, Roland J. Microscale recording from human motor cortex: implications for minimally invasive electrocorticographic brain-computer interfaces. Neurosurg Focus. 2009a;27:E10. doi: 10.3171/2009.4.FOCUS0980. [DOI] [PMC free article] [PubMed] [Google Scholar]
- Leuthardt EC, Miller KJ, Schalk G, Rao RP, Ojemann JG. Electrocorticography-based brain computer interface--the Seattle experience. IEEE Trans Neural Syst Rehabil Eng. 2006;14:194–8. doi: 10.1109/TNSRE.2006.875536. [DOI] [PubMed] [Google Scholar]
- Leuthardt EC, Miller KJ, Schalk G, Rao RN, Ojemann JG. Electrocorticography-Based Brain Computer Interface - The Seattle Experience. IEEE - Neural Systems and Rehabilitation Engineering. 2005 doi: 10.1109/TNSRE.2006.875536. [DOI] [PubMed] [Google Scholar]
- Leuthardt EC, Schalk G, Roland J, Rouse A, Moran DW. Evolution of brain-computer interfaces: going beyond classic motor physiology. eurosurg Focus. 2009b;27:E4. doi: 10.3171/2009.4.FOCUS0979. [DOI] [PMC free article] [PubMed] [Google Scholar]
- Leuthardt EC, Schalk G, Wolpaw JR, Ojemann JG, Moran DW. A brain-computer interface using electrocorticographic signals in humans. J Neural Eng. 2004;1:63–71. doi: 10.1088/1741-2560/1/2/001. [DOI] [PubMed] [Google Scholar]
- Loeb GE, Walker AE, Uematsu S, Konigsmark BW. Histological reaction to various conductive and dielectric films chronically implanted in the subdural space. J Biomed Mater Res. 1977;11:195–210. doi: 10.1002/jbm.820110206. [DOI] [PubMed] [Google Scholar]
- Margalit E, Weiland JD, Clatterbuck RE, Fujii GY, Maia M, Tameesh M, Torres G, D’Anna SA, Desai S, Piyathaisere DV, Olivi A, de Juan E, JrHumayun MS. Visual and electrical evoked response recorded from subdural electrodes implanted above the visual cortex in normal dogs under two methods of anesthesia. J Neurosci Methods. 2003;123:129–37. doi: 10.1016/s0165-0270(02)00345-x. [DOI] [PubMed] [Google Scholar]
- McFarland DJ, Miner LA, Vaughan TM, Wolpaw JR. Mu and beta rhythm topographies during motor imagery and actual movements. Brain Topogr. 2000;12:177–86. doi: 10.1023/a:1023437823106. [DOI] [PubMed] [Google Scholar]
- Miller KJ, Makeig S, Hebb AO, Rao RP, den Nijs M, Ojemann JG. Cortical electrode localization from X-rays and simple mapping for electrocorticographic research: The “Location on Cortex” (LOC) package for MATLAB. J Neurosci Methods. 2007;162:303–8. doi: 10.1016/j.jneumeth.2007.01.019. [DOI] [PubMed] [Google Scholar]
- Miller KJ, Schalk G, Fetz EE, den Nijs M, Ojemann JG, Rao RPN. Cortical activity during motor execution, motor imagery, and imagery-based online feedback. Proceedings of the National Academy of Sciences of the United States of America. 2010;107:4430–5. doi: 10.1073/pnas.0913697107. [DOI] [PMC free article] [PubMed] [Google Scholar]
- Palmer ED, Rosen HJ, Ojemann JG, Buckner RL, Kelley WM, Petersen SE. An event-related fMRI study of overt and covert word stem completion. Neuroimage. 2001;14:182–93. doi: 10.1006/nimg.2001.0779. [DOI] [PubMed] [Google Scholar]
- Pei X, Leuthardt EC, Gaona CM, Brunner P, Wolpaw JR, Schalk G. Spatiotemporal dynamics of electrocorticographic high gamma activity during overt and covert word repetition. Neuroimage. 2010 doi: 10.1016/j.neuroimage.2010.10.029. [DOI] [PMC free article] [PubMed] [Google Scholar]
- Price CJ, Wise RJ, Warburton EA, Moore CJ, Howard D, Patterson K, Frackowiak RS, Friston KJ. Hearing and saying. The functional neuro-anatomy of auditory word processing. Brain. 1996;119 (Pt 3):919–31. doi: 10.1093/brain/119.3.919. [DOI] [PubMed] [Google Scholar]
- Pulvermuller F, Shtyrov Y, Ilmoniemi RJ, Marslen-Wilson WD. Tracking speech comprehension in space and time. Neuroimage. 2006;31:1297–305. doi: 10.1016/j.neuroimage.2006.01.030. [DOI] [PubMed] [Google Scholar]
- Ray S, Crone NE, Niebur E, Franaszczuk PJ, Hsiao SS. Neural correlates of high-gamma oscillations (60–200 Hz) in macaque local field potentials and their potential implications in electrocorticography. J Neurosci. 2008;28:11526–36. doi: 10.1523/JNEUROSCI.2848-08.2008. [DOI] [PMC free article] [PubMed] [Google Scholar]
- Saur D, Kreher BW, Schnell S, Kummerer D, Kellmeyer P, Vry MS, Umarova R, Musso M, Glauche V, Abel S, Huber W, Rijntjes M, Hennig J, Weiller C. Ventral and dorsal pathways for language. Proc Natl Acad Sci U S A. 2008;105:18035–40. doi: 10.1073/pnas.0805234105. [DOI] [PMC free article] [PubMed] [Google Scholar]
- Schalk G, Anderson N, Wisneski K, Kim W, Smyth MD, Wolpaw JR, Barbour DL, Leuthardt EC. Toward brain-computer interfacing using phonemes decoded from electrocorticography activity (ECoG) in humans. Society for Neuroscience Annual Meeting; Washington, DC. 2007a. [Google Scholar]
- Schalk G, Kubanek J, Miller KJ, Anderson NR, Leuthardt EC, Ojemann JG, Limbrick D, Moran D, Gerhardt LA, Wolpaw JR. Decoding two-dimensional movement trajectories using electrocorticographic signals in humans. J Neural Eng. 2007b;4:264–75. doi: 10.1088/1741-2560/4/3/012. [DOI] [PubMed] [Google Scholar]
- Schalk G, McFarland DJ, Hinterberger T, Birbaumer N, Wolpaw JR. BCI2000: a general-purpose brain-computer interface (BCI) system. IEEE Trans Biomed Eng. 2004;51:1034–43. doi: 10.1109/TBME.2004.827072. [DOI] [PubMed] [Google Scholar]
- Schalk G, Mellinger J. A Practical Guide to BrainComputer Interfacing with BCI2000. New York: Springer; 2010. [Google Scholar]
- Schalk G, Miller KJ, Anderson NR, Wilson JA, Smyth MD, Ojemann JG, Moran DW, Wolpaw JR, Leuthardt EC. Two-dimensional movement control using electrocorticographic signals in humans. J Neural Eng. 2008a;5:75–84. doi: 10.1088/1741-2560/5/1/008. [DOI] [PMC free article] [PubMed] [Google Scholar]
- Schalk G, Pei X, Anderson NR, Wisneski K, Smyth MD, Barbour DL, Wolpaw JR, Leuthardt EC. Decoding Spoken And Imagined Phonemes Using Electrocorticographic Signals In Humans. Society for Neuroscience Annual Meeting.2008b. [Google Scholar]
- Scott SK, Johnsrude IS. The neuroanatomical and functional organization of speech perception. Trends Neurosci. 2003;26:100–7. doi: 10.1016/S0166-2236(02)00037-1. [DOI] [PubMed] [Google Scholar]
- Sinai A, Bowers CW, Crainiceanu CM, Boatman D, Gordon B, Lesser RP, Lenz FA, Crone NE. Electrocorticographic high gamma activity versus electrical cortical stimulation mapping of naming. Brain. 2005;128:1556–70. doi: 10.1093/brain/awh491. [DOI] [PubMed] [Google Scholar]
- Slutzky MW, Jordan LR, Krieg T, Chen M, Mogul DJ, Miller LE. Optimal spacing of surface electrode arrays for brain-machine interface applications. J Neural Eng. 2010;7:26004. doi: 10.1088/1741-2560/7/2/026004. [DOI] [PMC free article] [PubMed] [Google Scholar]
- Specht K, Reul J. Functional segregation of the temporal lobes into highly differentiated subsystems for auditory perception: an auditory rapid event-related fMRI-task. Neuroimage. 2003;20:1944–54. doi: 10.1016/j.neuroimage.2003.07.034. [DOI] [PubMed] [Google Scholar]
- Towle VL, Yoon HA, Castelle M, Edgar JC, Biassou NM, Frim DM, Spire JP, Kohrman MH. ECoG gamma activity during a language task: differentiating expressive and receptive speech areas. Brain. 2008;131:2013–27. doi: 10.1093/brain/awn147. [DOI] [PMC free article] [PubMed] [Google Scholar]
- Vansteensel MJ, Hermes D, Aarnoutse EJ, Bleichner MG, Schalk G, van Rijen PC, Leijten FS, Ramsey NF. Brain-computer interfacing based on cognitive control. Annals of neurology. 2010;67:809–16. doi: 10.1002/ana.21985. [DOI] [PubMed] [Google Scholar]
- Wang W, Degenhart AD, Collinger JL, Vinjamuri R, Sudre GP, Adelson PD, Holder DL, Leuthardt EC, Moran DW, Boninger ML, Schwartz AB, Crammond DJ, Tyler-Kabara EC, Weber DJ. Human motor cortical activity recorded with Micro-ECoG electrodes, during individual finger movements. Conf Proc IEEE Eng Med Biol Soc. 2009:586–9. doi: 10.1109/IEMBS.2009.5333704. [DOI] [PMC free article] [PubMed] [Google Scholar]
- Wilson JA, Felton EA, Garell PC, Schalk G, Williams JC. ECoG factors underlying multimodal control of a brain-computer interface. IEEE Trans Neural Syst Rehabil Eng. 2006;14:246–50. doi: 10.1109/TNSRE.2006.875570. [DOI] [PubMed] [Google Scholar]
- Wisneski KJ, Anderson N, Schalk G, Smyth M, Moran D, Leuthardt EC. Unique cortical physiology associated with ipsilateral hand movements and neuroprosthetic implications. Stroke; a journal of cerebral circulation. 2008;39:3351–9. doi: 10.1161/STROKEAHA.108.518175. [DOI] [PubMed] [Google Scholar]
- Wu M, Wisneski K, Schalk G, Sharma M, Roland J, Breshears J, Gaona C, Leuthardt EC. Electrocorticographic frequency alteration mapping for extraoperative localization of speech cortex. Neurosurgery. 66:E407–9. doi: 10.1227/01.NEU.0000345352.13696.6F. [DOI] [PubMed] [Google Scholar]
- Yuen TG, Agnew WF, Bullara LA. Tissue response to potential neuroprosthetic materials implanted subdurally. Biomaterials. 1987;8:138–41. doi: 10.1016/0142-9612(87)90103-7. [DOI] [PubMed] [Google Scholar]