Abstract
In mammals, oocyte fertilisation by sperm initiates development. This is followed by epigenetic reprogramming of both parental genomes, which involves de-novo establishment of chromatin domains. In the mouse embryo, methylation of histone H31 establishes an epigenetic asymmetry and is predominant in the maternal pronucleus2-5. However, the role of (i) differential incorporation of histone H3 variants in the parental chromatin and of (ii) modified residues within specific histone variants has not been addressed. Here we show that the histone variant H3.3, and in particular lysine 27, is required for the establishment of heterochromatin in the mouse embryo. H3.3 localises to paternal pericentromeric chromatin during S-phase at the time of transcription of pericentromeric repeats. Mutation of H3.3K27, but not H3.1K27, results in aberrant accumulation of pericentromeric transcripts, HP1 mislocalisation, dysfunctional chromosome segregation and developmental arrest. This phenotype is rescued by injection of dsRNA derived from pericentromeric transcripts, indicating a functional link between H3.3K27 and silencing of such regions via an RNAi pathway. Our work demonstrates a role for a modifiable residue within a histone variant-specific context during reprogramming and identifies a novel function for mammalian H3.3 in the initial formation of dsRNA-dependent heterochromatin.
Fertilisation of the oocyte by the sperm constitutes the first event of embryogenesis and results in the formation of the zygote. The creation of such a totipotent cell from two differentiated ones involves epigenetic reprogramming of the parental genomes. Throughout the complete first cell cycle, the male and female pronuclei behave as two distinct sets of chromatin that coexist as separate nuclear entities. Both pronuclei evolve differently, showing different chromatin signatures, histone marks and replication and transcription timing 2-4, 6, 7. How the chromatin is assembled, specified and reprogrammed after fertilisation remains a central question in biology. Before fertilisation, the sperm nucleus is condensed six-fold higher than a somatic cell nucleus, and most of its histones are replaced by protamines8. Immediately following the entry of the sperm nucleus into the oocyte cytoplasm, protamines are removed from the sperm and replaced by maternally provided histones 9. In mice, histones H3 and H4 are translated from maternal mRNAs stored in the oocyte, whereas histones H2A and H2B are already present as proteins in the oocyte 10.
Apart from the canonical histones, which are synthesised exclusively during S-phase, histone variants can be incorporated into chromatin throughout the cell cycle. The replication-independent H3 variant H3.3 is preferentially incorporated into the male pronucleus following fertilisation5, while the replication-dependent H3.1/2 variants are found predominantly in the female pronucleus 11, suggesting a role of differential incorporation of histone variants in the formation of embryonic chromatin. However, the precise time when chromatin is formed or how newly incorporated histone variants and residues within contribute to development is unknown. H3.3 has been associated with active transcription in somatic cells 12, 13 and H3 variants differ in their relative abundance of various modifications 14, 15. For example K27me1 and K4me3 are more abundant in H3.3 than in H3.1. Changes in the methylation of histone H3 occur after fertilisation, as well as a differential distribution of histone modifications between male and female pronuclei 2-5. Of these, methylation of H3K4, H3K9 and H3K27 are less abundant in the male pronucleus, and the paternal chromatin only gradually acquires chromatin signatures during the 1st cell cycle (Supplementary Information, Figs. S1-S4).
RESULTS
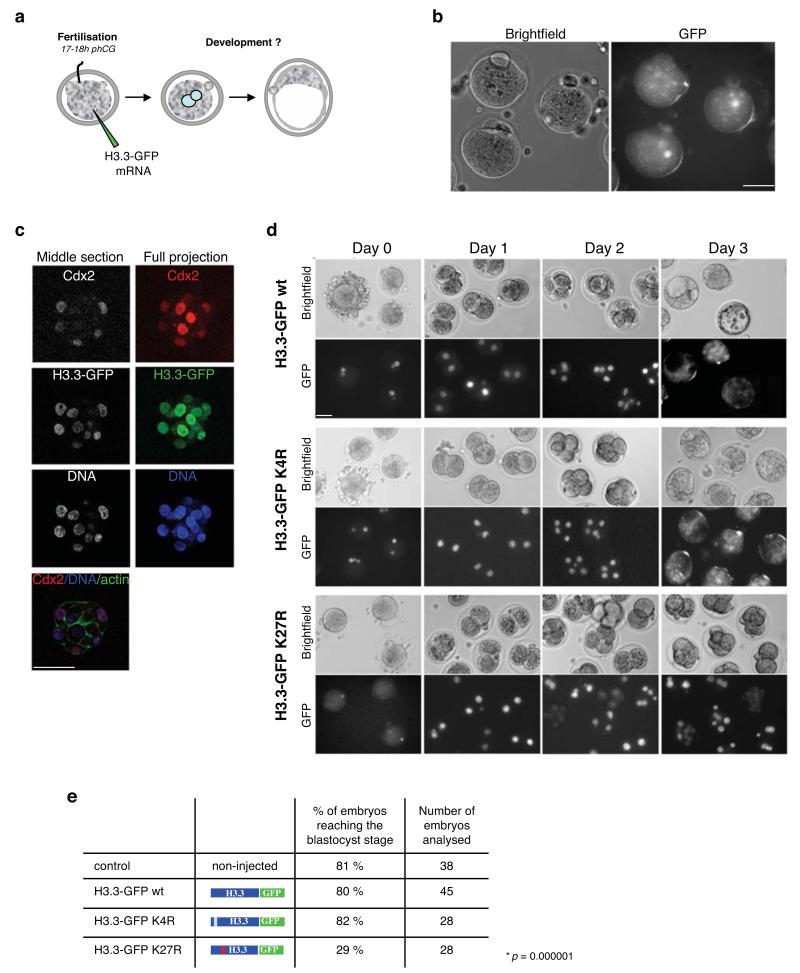
To address the contribution of specific residues within the histone H3 variants H3.1 and H3.3 to the establishment and subsequent reprogramming of chromatin after fertilisation, we expressed these variants harbouring point mutations in zygotes and assessed the development of these embryos. Because high expression of exogenous histones can cause intra S-phase checkpoint activation, potentially eliciting non-specific developmental defects 16, we first established conditions where expression of H3 did not alter normal development by titrating mRNA concentrations of H3.3 wt (Supplementary Information, Fig. S5). We injected mRNA for GFP-tagged H3.3 wt into zygotes at the fertilisation cone stage before pronuclear formation (Fig. 1a). This resulted in efficient accumulation of H3.3 – GFP in the forming male pronucleus (Fig. 1b), in line with our previous observations 5. H3.3 – GFP was still present in the embryo even after several cell divisions (Fig. 1c-d). H3.3 – GFP wt-expressing embryos developed to the blastocyst stage in normal ratios compared to non-injected embryos (Fig. 1d and e) and exhibited normal expression pattern of the trophectoderm and inner cell mass markers Cdx2 and Nanog, respectively, as determined by immunostaining (Fig. 1c and not shown). We then used these parameters and expressed H3.3 – GFP K4R or K27R mutants and followed the development of these embryos (Fig. 1d). While embryos injected with H3.3 wt and K4R reached the blastocyst stage at the same time and in similar ratios as the non-injected controls, embryos expressing H3.3 K27R exhibited a reduced rate of development and only 29% of the embryos reached the blastocyst stage (p= 0. 000001)(Fig. 1d-e). We ruled out the possibility of H3.3 –GFP K27R having effects in developmental progression due to higher levels of expression compared to H3.3 wt or K4R by measuring the GFP fluorescence intensity in embryos expressing each of the 3 proteins. This showed no difference in GFP levels amongst the 3 groups (p = 0.75). Thus, among the residues analysed on H3.3, only K27 appears important for early embryonic development.
Figure 1. Embryos expressing H3.3 – GFP K27R are compromised in their development.
a. Diagram showing the experimental design. Zygotes were collected and microinjected at the fertilisation cone stage with in vitro transcribed mRNA and cultured till the blastocyst stage. Corresponding time after hCG injection is indicated.
b. Efficient incorporation of H3.3 – GFP in the forming male pronucleus after fertilisation upon microinjection of mRNA. Brighfield and GFP images of representative zygotes showing GFP fluorescence in the male pronucleus. Scale bar is 50 μm.
c. Overexpression of H3.3 – GFP does not alter development or blastocyst formation. Zygotes were injected with mRNA for H3.3 – GFP wt as in (a), cultured till the blastocyst stage, fixed and processed for immunostaining with a Cdx2 antibody (n=8). Note that H3.3 expression persists till the blastocyst stage in all cells. Shown are a middle section (left) and a full maximal intensity projection (right) of stack Z-images acquired every 2 μm. Cortical actin labelled with phalloidin demarcates cell boundaries. DNA (blue) was stained with DAPI. Scale bar is 50 μm.
d. Mutation of K27 of H3.3 compromises development to the blastocyst stage. Zygotes were microinjected as in (a) with the indicated mRNAs, cultured, monitored daily and scored for their developmental stage. Among the H3.3K27R expressing embryos showing developmental arrest, 39% arrested at the 2-cell stage, 41% between 3- and 4-cell stage and 20% at 8-cell stage. Shown are representative brightfield and fluorescence images of embryos imaged daily. Scale bar is 50 μm.
e. Summary of development of control, non-injected embryos or embryos expressing H3.3 – GFP wt, K4R or K27R of 6 independent experiments. Statistical analysis was applied using the ANOVA test. Note that embryos injected with GFP mRNA-only developed to the blastocyst in 87% of the cases (n=18, not shown).
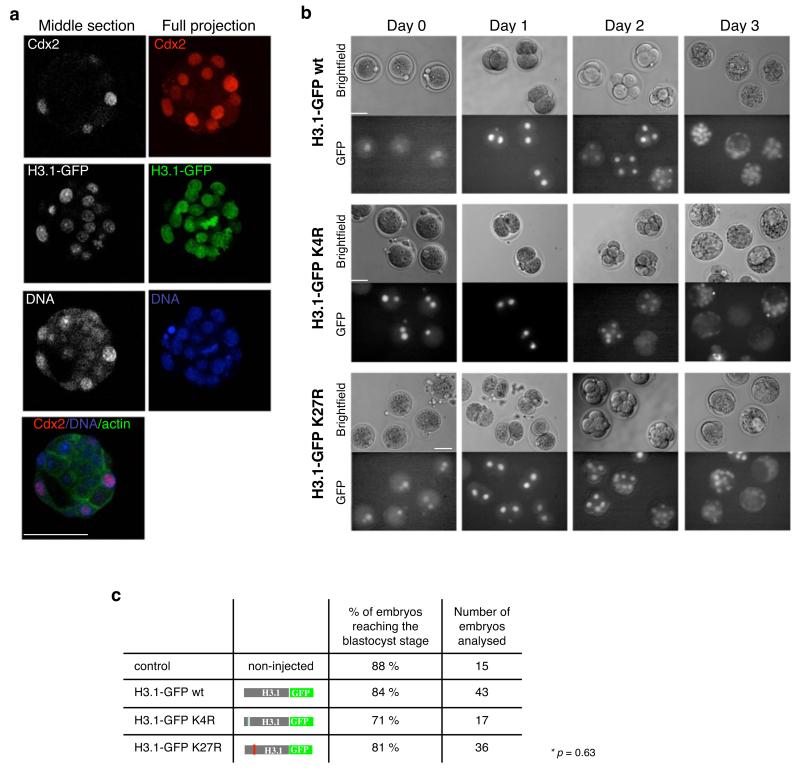
Modifications of K27 of H3, mainly methylation, have been involved in developmental processes including the establishment of a chromatin environment associated with pluripotency 17. However, whether the role of K27 modification is pertinent to a particular H3 variant is not known, as antibodies recognising K27 marks do not distinguish among different variants. To determine whether the defects of H3.3 – GFP K27R that we observed are H3 variant-specific, we repeated the same experiments as above, but this time using H3.1 – GFP. Embryos expressing H3.1 – GFP wt developed to the blastocyst stage in normal ratios compared to non-injected control embryos and exhibited correct expression of Cdx2 and Nanog (Fig. 2a-c and not shown). When we expressed H3.1 K4R or K27R mutants in the zygote, both groups of embryos developed normally and displayed no differences in their development compared to H3.1 wt or non-injected controls (p=0.63)(Fig. 2 b-c). These results indicate that the developmental defects elicited upon K27 mutation are H3.3 specific.
Figure 2. Developmental defects elicited upon K27 mutation are H3.3 specific.
a. Overexpression of H3.1 – GFP does not alter development or blastocyst formation. Zygotes were injected with mRNA for H3.1 – GFP wt as in Figure 1, cultured till they reached the blastocyst stage, fixed and analysed with the Cdx2 antibody. Confocal sections were taken every 2 μm. Shown are a middle section (left) and a full projection (right) of one representative blastocyst of 12 analysed. Scale bar is 50 μm.
b. Mutation of K27 in H3.1 does not alter developmental progression. Zygotes were microinjected as in figure 1a and their developmental stage was monitored daily. Scale bar is 50 μm.
c. Summary of development of embryos expressing H3.1 – GFP wt, K4R or K27R mutants of 5 independent experiments. Statistical analysis was performed using ANOVA.
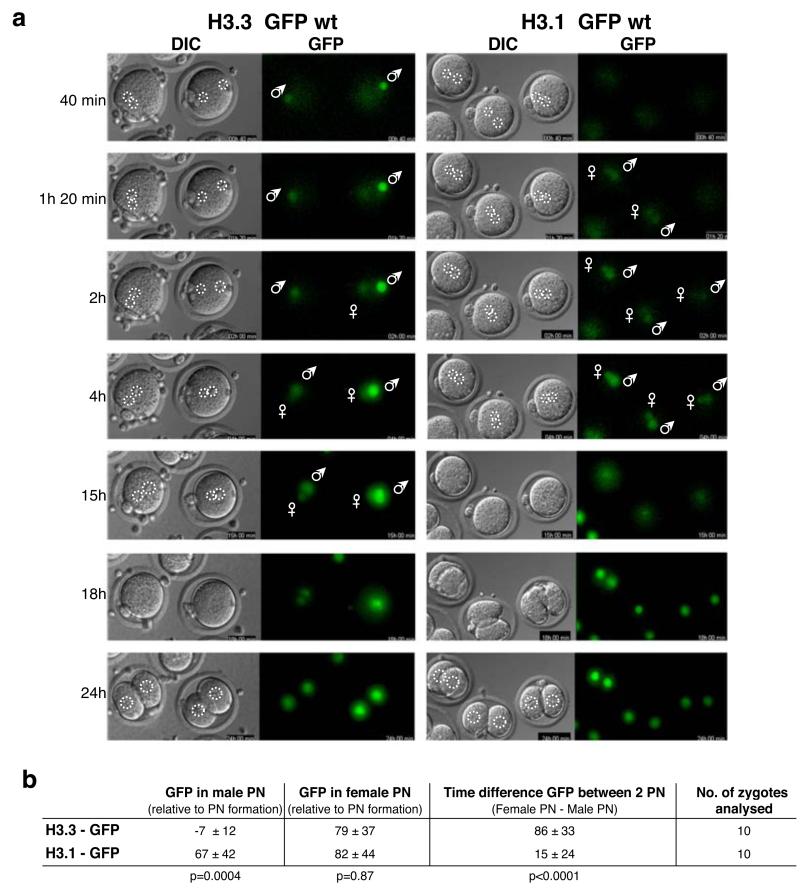
Next, we wished to determine the basis for the variant-specific difference we observed upon K27 mutation. We asked whether the timing of incorporation of H3.1 and H3.3 would be relevant for such effects. In somatic cells, H3.1 deposition, contrary to H3.3 deposition, is replication dependent 12, 18. It is currently unknown whether the same mechanisms regulate H3 variant deposition in the zygote. We performed time-lapse analyses to determine the dynamics of appearance of H3.3 and H3.1 in the forming male and female pronuclei, which were easily distinguishable under DIC optics (Fig. 3a). Zygotes injected as above with H3.3 or H3.1 – GFP wt mRNA were imaged every 10 minutes along Z-planes covering both pronuclei. We found that H3.3 is found on the paternal chromatin concomitant to pronuclear (PN) formation (Fig. 3a-b). However, in the female pronucleus H3.3 was only detected 1 hour after its formation (Fig. 3a-b). In contrast to H3.3, H3.1 was deposited almost simultaneously in both pronuclei (Fig. 3b) at the time when BrdU incorporation is first observed in the zygote (data not shown and Ref 7), suggesting that H3.1 is deposited, similarly to somatic cells, during S-phase. Thus, H3.3 appears first in the male chromatin concomitantly with pronuclear formation and its incorporation in the female pronucleus occurs only ~ 1h later while H3.1 is deposited in both pronuclei simultaneously at the onset of DNA replication.
Figure 3. H3.3 and H3.1 are incorporated at different times in the two pronuclei.
a. H3.3 is first incorporated in the male pronucleus, while H3.1 is only incorporated later and in both pronuclei simultaneously. Zygotes were injected as in Figure 1 with mRNAs for H3.3 or H3.1 – GFP wt and were subsequently grown under timelapse microscopy along Z-series covering both pronuclei. Shown are brightfield and GFP channels of images captured at the indicated times. Indicated times are arbitrarily taken from the beginning of the timelapse experiment, and are not related to the time of pronuclei formation. Where relevant, male and female pronuclei are indicated. White dashed line demarcates the position of the nuclei.
b. Summary of the analysis of the time lapse described in a. Time of GFP appearance in the male or the female pronucleus for either H3.1 or H3.3 is shown. Time is expressed in minutes and is relative to the time of pronuclear formation. PN, pronucleus. For both groups of embryos nuclear envelope breakdown occurred 13h 34min (± 4h 6min) after PN formation and cytokinesis followed 1h 46min later (± 11 min). This was similar to non-injected embryos, confirming that our conditions for expression of H3 variants do not significantly affect S-phase progression or mitosis.
We hypothesised that the time difference between incorporation of H3.3 and H3.1 could be relevant for the variant-specific effects of K27 mutation. Because this time corresponds to the onset of the 1st S-phase, we considered two possibilities to explain the developmental defects upon H3.3 K27R expression; that the effect of H3.3 K27R is related to a) a function of H3.3 before or concomitant to S-phase and/or b) its preferential incorporation to a specific genomic location.
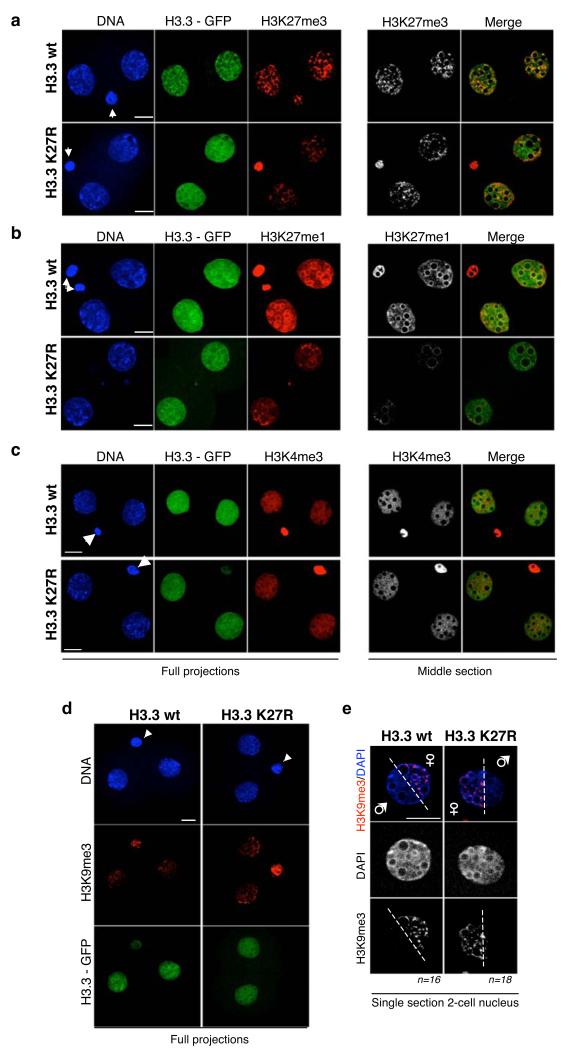
We first analysed whether embryos over-expressing H3.3 K27R display defects in epigenetic marks. Quantification of global levels of H3K27me3 in embryos expressing H3.3–GFP K27R revealed reduced methylation levels to approximately 65% of those in control embryos (Fig. 4a and Supplementary Information Fig. S5). Expression of H3.3–GFP K27R further resulted in altered distribution and global reduction in H3K27me1 levels to approximately 54% of those of the controls (Fig. 4b and Supplementary Information Fig. S5). In contrast, we did not detect any obvious change in the distribution of euchromatic marks such as H3K4me3, nor indeed in H3K9me3 in embryos expressing either H3.3 wt or K27R mutant compared to control embryos (Fig. 4c-d).
Figure 4. Expression of H3.3 – GFP K27R leads to changes in some epigenetic marks.
a-b. Changes in H3K27me3 and H3K27me1 in 2-cell stage embryos expressing either H3.3 – GFP wt or K27R mutants. Shown are full projections (left) or middle sections (right) of images taken along the Z-axis every 0.6 μm. For each antibody embryos were processed and analysed in parallel with identical confocal acquisition parameters. Data shown are representative of 16 (H3K27me1) and 19 (H3K27me3) embryos analysed. Quantification of fluorescence levels was performed throughout individual sections using ImageJ. DNA was stained with DAPI (blue) and the GFP signal is shown in green. Where visible, polar bodies are marked with an arrowhead. Non-injected controls are shown in Supplementary Information, Fig. S5. Scale bar is 14 μm.
c. H3.3 -GFP wild type or K27R mutant has no apparent effect on global distribution of H3K4me3 at the 2-cell stage. Embryos were processed as in a-b and analysed using a H3K4me3 antibody. Representative embryos of at least 7 embryos analysed per group are shown. Embryos were processed in parallel and acquisition was performed under identical confocal parameters. Similar results were obtained for H3.1 wt and H3.1 K27R injections. Scale bar is 10 μm.
d-e. Analysis of H3K9me3 upon expression of H3.3K27R. Zygotes were processed as above and stained with an H3K9me3 antibody. Shown in d are maximal projections of Z-stack sections taken every 0.5 μm representative 2-cell stage embryos (n=8 and n=9, respectively). In d, single sections of individual nuclei of 2-cell stage embryo are shown. Note that the maternal chromatin is clearly distinguishable from the paternal chromatin by H3K9me3 staining. The white dashed indicates the approximate ‘limit’ between the two parental chromatins. Scale bar is 10 μm.
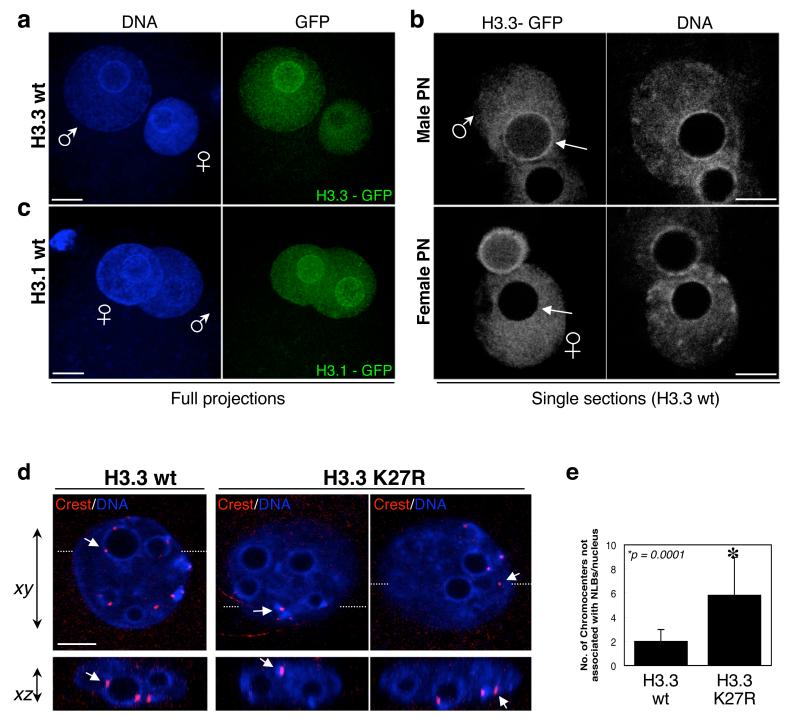
Secondly, we analysed H3.3 localisation in zygotes during S-phase. H3.3 is present in both pronuclei, with fluorescence levels slightly higher in the male pronucleus (Fig. 5a), similarly to endogenous H3.3 (ref. 5). Surprisingly, we found that H3.3 localises to the heterochromatic DAPI-intense rings surrounding the nucleolar-like bodies (NLBs) in the male pronucleus, but not in the female one (Fig. 5a-b). The same pattern was observed for the K4R and K27R H3.3 mutants (not shown). H3.1 was distributed throughout both pronuclei and followed the DAPI distribution, with no discernibly specific pattern (Fig. 5c). Such dense ring-like structures around NLBs in the zygote are formed by the chromocenters that contain pericentromeric and centromeric chromatin. In the male pronucleus, these regions gradually acquire methylation of H3K27 (but not of H3K9 or H3K4) after the mid pronuclear stages (PN3-PN4), concomitant to progression of S-phase (Supplementary Information, Figs. S2-4 and see also ref. 4). We next analysed the localistion of the chromocenters in our mutants. Notably, expression of H3.3-GFP K27R induces a spatial relocalisation of chromocenters at the 2-cell stage (Fig. 5d-e). This effect is specific for H3.3, as embryos expressing H3.1–GFP K27R displayed a normal pattern of chromocenter localisation (not shown). Because the association of chromocenters to NLBs has been suggested to reflect their heterochromatic nature 19, their mislocalisation in H3.3K27R expressing embryos suggests defects in heterochromatin.
Figure 5. H3.3 localises to pericentromeric domains surrounding NLBs only in the male pronucleus.
a-b. Zygotes injected with mRNA for H3.3 – GFP wt were analysed under confocal microscopy (n=73). Shown are full maximal intensity projections (a) or single sections (b) of the GFP and the DAPI channels where the diameter of the male (top) or female (bottom) pronucleus is maximal. Note that H3.3 localises to the pericentromeric chromatin surrounding the NLBs in the male, but not in the female pronucleus (arrows).
c. H3.1 is distributed throughout in both male and female pronuclei. Zygotes injected with mRNA for H3.1-GFP wt were fixed at the same time as the zygote shown in a. Shown are full maximal intensity projections of a representative of 27 zygotes. Male and female pronuclei are indicated.
d-e. Chromocenter localisation is affected upon H3.3 K27R expression. Confocal acquisition along x-y and x-z planes allowed us to determine the spatial positioning of individual chromocenters (labelled with a Crest antiserum). Most chromocenters occupy a restricted spatial localisation around the NLBs towards at the 2-cell stage, with only 1-2 chromocenters per nucleus showing no association with NLBs 19. In agreement, we found 2 ± 1 non-NLBs associated chromocenters per nucleus in non-injected embryos or in embryos expressing H3.3–GFP wt (n=10). In contrast, spatial localisation of chromocenters was affected upon expression of H3.3-GFP K27R, with an increased number of chromocenters not associated with NLBs (6 ± 2; n=16). Examples of xy and xz planes of one nucleus from H3.3 – GFP wt and two nuclei from H3.3 – GFP K27R expressing embryos. The xz section at the bottom corresponds to the section cut at the level of the white dashed line on the xy plane. Arrows point to the same Crest spots seen from two optical planes. Scale bar is 5 μm.
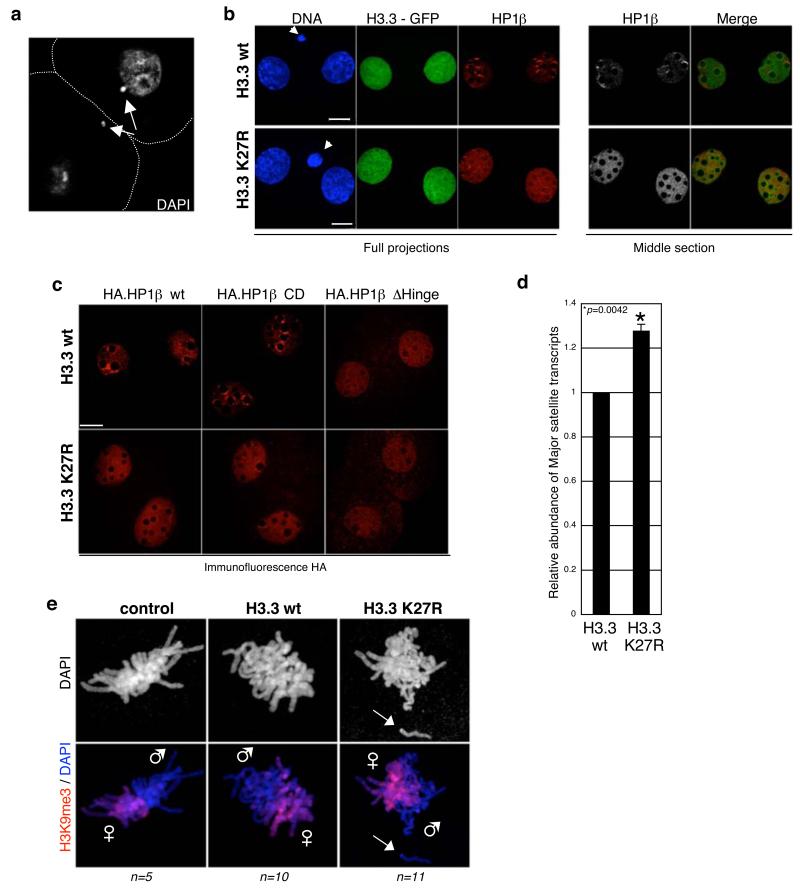
A major architectural component of chromocenters is the HP1 protein and its appropriate localization is essential for chromocenter function. Furthermore, in S. pombe, the HP1 homologue Swi6 is required for normal chromosome segregation and its deletion leads to chromosome lagging, a feature that we observed in 2-cell embryos expressing H3.3K27R (Fig. 6a). Considering all these facts together we reasoned that an analysis of HP1 localization might shed light on the mechanism(s) underlying the embryonic defects due to expression of H3.3 K27R. Interestingly, we found that expression of H3.3–GFP K27R led to mislocalisation of HP1β, which was no longer enriched in the DAPI-rich regions around the NLBs as compared to control embryos and was instead spread out in the nucleoplasm (Fig. 6b and Supplementary Information, Fig. S5). This suggests that recruitment of HP1β to pericentric chromatin is impaired in H3.3 K27R-expressing embryos. To further explore the involvement of HP1β in the observed effects we expressed three HP1β constructs; (i) a tagged full-length HP1β wt, (ii) a similar construct containing a mutation within its chromodomain that abolishes H3K9me binding, and (iii) a similar construct lacking the HP1β Hinge region. Tagged, full-length HP1β wt displayed the same localisation as endogenous HP1β both in H3.3-GFP wt and K27R expressing embryos (Fig. 6c). Mutation of the chromodomain did not alter HP1β enrichment around the NLBs in the H3.3 wt background (Fig. 6c). This is consistent with the fact that the male pronucleus is devoid of detectable H3K9me3 (Ref. 4). In contrast however, deletion of the Hinge region resulted in a similar HP1β localisation to that observed upon the H3.3K27R mutation (Fig. 6c). Furthermore, a significant proportion of embryos expressing HP1β ΔHinge displayed chromosome lagging (25%, n=12), which was not the case of embryos expressing HP1β wt or HP1β CD (0 out of 25 and 16, respectively). Thus, it appears that the HP1β Hinge region is necessary for the pericentric enrichment of HP1β in 2-cell embryos, but a functional chromodomain is dispensable. The HP1 Hinge region is essential for its interaction with RNA20 suggesting that the effects we observed may be due to an interaction between HP1β and chromatin-associated RNA molecules. Indeed, evidence for this stems from our observation that an RNAse treatment in the zygote results in mislocalisation of HP1β and that HP1β binds to pericentromeric RNA transcripts in vitro (Supplementary Information, Fig. S6).
Figure 6. Expression of H3.3 – GFP K27R in the zygote leads to altered pericentromeric transcription, defects in chromosome segregation and mislocalisation of HP1β.
a. Embryos expressing H3.3 K27R display chromosome seggregation defects (24%; n =57) compared to embryos expressing H3.3 wt or H3.1 K27R or to non-injected embryos (5%, n=30; 8%, n=26 and 5%, n=21, respectively). Shown is a single section of a 2-cell stage embryo expressing H3.3 - GFP K27R stained with DAPI. White dashed line marks the cell membrane. Arrows point to DNA fragments that were not incorporated into the nuclei.
b. HP1β is mislocalised in 2-cell stage embryos expressing H3.3-GFP K27R. Zygotes injected with H3.3-GFP wt (n=19) or K27R (n=18) mRNAs were stained with an HP1β antibody. Shown are full projections (left) or middle sections (right) of images taken along the Z-axis every 0.6 μm. Embryos were processed in parallel and with identical confocal acquisition parameters. Non-injected embryos are shown in Supplementary Information, Fig. S5. Polar bodies are indicated by an arrow. Scale bar is 14 μm.
c. Deletion of the Hinge domain in HP1β results in mislocalisation of HP1β similarly to that observed upon H3.3K27R mutation. The indicated HP1β mRNA was co-injected with either H3.3 – GFP wt or K27R mRNA as in figure 1. Embryos were analysed with an anti-HA antibody. Shown are single confocal sections of representative 2-cell stage embryos. Scale bar is 14 μm.
d. Increased accumulation of major satellite transcripts upon H3.3K27R expression. Zygotes were injected with mRNA for H3.3 – GFP wt or K27R and cultured until early 2-cell stage. Total RNA was retrotranscribed and analysed by PCR with specific primers for major satellites. Data was normalised with H2A mRNA levels and is presented as average ± SD of 3 independent biological replicates. We observed no difference in major satellite transcription between H3.3 wt and non-injected embryos (not shown).
e. Paternal chromatin displays segregation defects during the 1st mitosis in embryos expressing H3.3 K27R. Non-injected (control), H3.3 wt or H3.3 K27R-expressing embryos were cultured till they reached mitosis, fixed and stained with a H3K9me3 antibody (which at this stage marks exclusively maternal chromatin). Paternal chromosomes (e.g. lacking H3K9me3) show severe division defects (arrow).
Thus far, our data point toward a defect in chromocenter remodelling in H3.3 K27R-expressing embryos involving RNA and HP1β. In S. pombe transcription of centromeric chromatin during S-phase is essential to preserve the heterochromatic nature of the centromere via a mechanism involving RNA, the HP1 homologue Swi6 and the RITS complex21, 22. Heterochromatin assembly of the surrounding repetitive elements also requires transcription23. Although it is unclear whether these processes are conserved in full24, in mammalian cells major satellites are also transcribed predominantly during S-phase 25. Because it is the chromocenters that contain the minor (centromeric) and major (pericentromeric) satellite repeats 4, 19, we wondered whether H3.3 K27R expression affects the accumulation of transcripts derived from major satellites. Indeed, expression of H3.3–GFP K27R resulted in a modest but significant increase in the abundance of major satellite transcripts at the 2-cell stage, suggestive of de-repression or lack of silencing (p=0.004)(Fig. 6d). Importantly, over-expression of H3.3–GFP wt did not alter the levels of transcripts derived from major satellites compared to non-injected embryos (p = 0.74)(not shown). Furthermore, since H3.3 associates to active genomic regions in somatic cells, we tested whether H3.3 accumulation around NLBs in the male pronucleus might be indicative of major satellite transcripts being transcribed from the paternal genome. We assessed this by performing crosses with mice of different subspecies and found that it is indeed the paternal major satellites that are preferentially transcribed (Supplementary Information, Fig. S7a), in agreement with previous RNA-FISH data 26. Furthermore, by extrapolating these observations we hypothesised that the lagging chromatin in 2-cell stage embryos expressing H3.3 K27R (Fig. 6a) must be of paternal origin. We confirmed this by demonstrating that in H3.3 K27R expressing embryos the lagging chromatin was always of paternal origin (Fig. 6e) and that H3K9me3 levels –a mark only detected in the female chromatin-appeared unaffected (Fig. 4d-e). Notably, the defects in chromosome segregation occurred during the first mitosis (Fig. 6e). Taken together, these data demonstrate that mutation of K27 in H3.3 results in the accumulation of major satellite transcripts following the first mitotic division, suggesting defects in silencing and/or paternal heterochromatin formation.
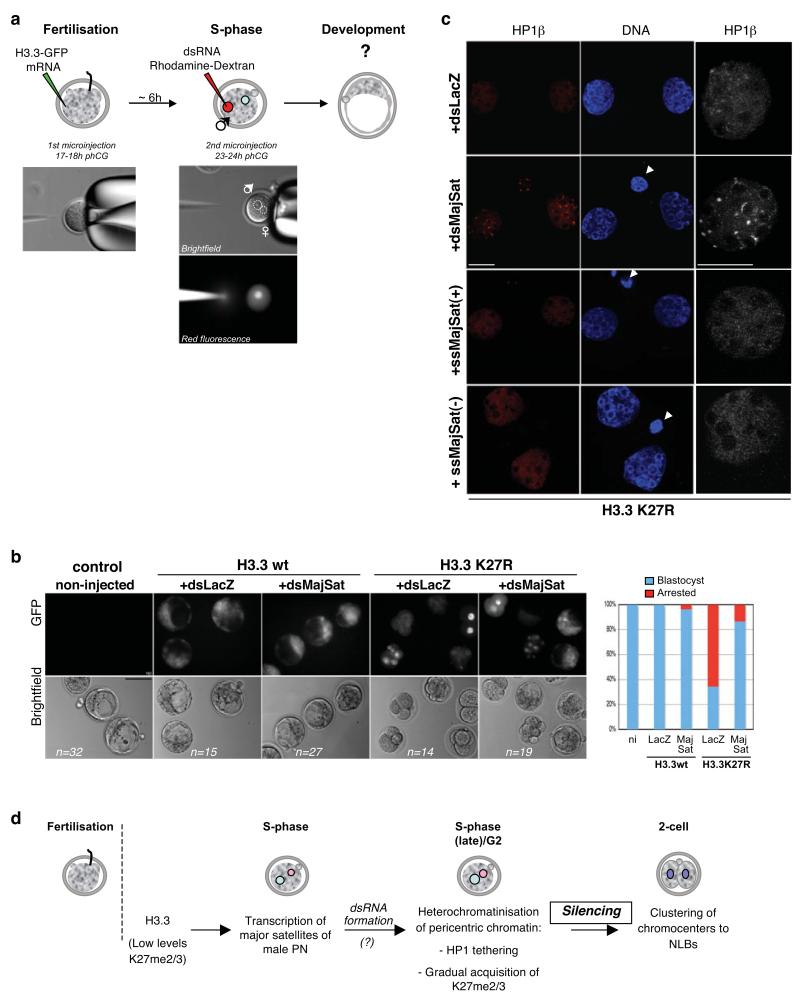
The similarity between the lagging phenotype and mislocalisation of HP1β obtained upon deletion of the Hinge region or upon H3.3 K27R expression, together with our observations that mutation of H3.3 K27 leads to improper silencing of major satellite repeats, prompted us to explore a link between these events. In S. pombe, centromeric silencing is mediated via an RNAi-pathway that depends on the generation of dsRNA from centromeric repeats. Moreover, the HP1 homologue Swi6 binds to centromeric transcripts – as determined by RNA-IP - and this association is necessary to enable RNAi-mediated silencing 27. Our own observations also show that HP1β can bind major satellite transcripts in vitro (Supplementary Information, Fig. S6). We showed above that H3.3K27R mutation lead to an accumulation of major satellite transcripts. Importantly, this analysis was performed at the early 2-cell stage, a time-point after the stage at which the repeats are normally silenced by inclusion into heterochromatin (see schematic, Fig. 7d). This indicated that H3.3K27 mutation lead to de-repression, or lack of silencing, of these repeats. We hypothesized that in the zygote (i.e. before the 2-cell stage) H3.3 K27R leads to inefficient production of major satellite dsRNA, which in turn would lead to an inability to initiate effective heterochromatinization of the repeats. We therefore tested whether artificial reintroduction of dsRNA from major satellites would overcome the developmental phenotype elicited upon mutation of K27 of H3.3. To address this we injected embryos with either H3.3 wt or H3.3 K27R mRNAs as before, and left the zygotes to progress into S-phase (~6 hours later). Then, we microinjected dsRNA for major satellites (MajSat), or LacZ as control, into the paternal pronucleus (Fig. 7a). As above, we monitored development daily and scored the number of embryos that reached the blastocyst stage. Introduction of dsRNA for MajSat or LacZ had no effect on embryos expressing H3.3 wt (Fig. 7b). In contrast, we found that embryos expressing H3.3-GFP K27R developed in normal ratios following introduction of dsMajSat RNA, but not dsLacZ RNA, into the paternal pronucleus (Fig. 7b). We further addressed whether the reintroduction of dsMajSat has an effect on HP1β localisation in H3.3-GFP K27R-embryos. While H3.3K27R-expressing embryos injected with dsLacZ showed the same diffuse pattern of localisation of HP1β as above, we found that HP1β relocalised to DAPI-rich regions following reintroduction of dsMajSat (Fig. 7c). Interestingly, ssRNA from MajSat did not rescue the localisation of HP1β (Fig. 7c), suggesting that the RNAi machinery –or at least the need from a dsRNA template-is involved in this process. These results also suggest that the phenotype elicited upon H3.3K27R expression is primarily due to the defects in transcriptional silencing of pericentromeric transcripts. Moreover, it suggests that production of dsRNA from the satellites might be limiting in the silencing process in the H3.3K27R mutants. Most importantly, addition of dsRNA, specifically that of major satellites transcripts, rescues the developmental phenotype elicited upon expression of H3.3K27R, demonstrating a functional link between H3.3 and pericentromeric RNA in this developmental context.
Figure 7. Addition of dsRNA from major satellites in the zygote rescues the developmental phenotype of H3.3 K27R mutants.
a. Experimental design for injection of dsRNA in embryos expressing H3.3 wt or K27R mutant. The first injection of H3.3 wt or H3.3 K27R –GFP constructs was as in Figure 1. Embryos were then cultured for ~6 hours till S-phase, at which time the male pronucleus was microinjected with dsRNA for LacZ (control) or for the major satellite repeat (dsMajSat). To control for pronuclear injection, dsRNA was mixed with rhodamine-coupled dextran.
b. The developmental phenotype elicited by H3.3 K27R is rescued by addition of dsRNA of major satellites. Representative embryos after 3 days of development are shown for each experimental group. The graph on the right depicts the percentage of embryos in each group that reached the blastocyst stage (blue), relative to the control, non-injected (ni) embryos, which was set at 100%. Embryos (%) showing defective development are shown in red. Data are compiled from 4 independent experiments.
c. HP1β relocalises to DAPI-rich regions upon injection of dsRNA for major satellites in H3.3 K27R-expressing embryos. Embryos were injected as in a, fixed at the 2-cell stage and analysed with an HP1β antibody. Shown are representative of 10 embryos analysed per group in two independent experiments. For the ssRNA experiments, results shown are for the sense (+) and the antisense (-) RNA (n=13 and 8). The right panel shows a higher magnification of one of the nuclei shown on the left. Scale bar is 10 μm.
d. Model for heterochromatin establishment at pericentromeric repeats. The presence of H3.3 and low levels/absence of K27 methylation in wild type embryos provide a chromatin environment for transcription of pericentromeric chromatin during the 1st S-phase in the male pronucleus. Both transcription of these domains and gradual accumulation of K27 methylation would subsequently lead to their heterochromatinisation and correct nuclear spatial positioning around NLBs at the 2-cell stage. Reinforcement of histone modifications in the second cell cyle will then allow heterochromatin maintenance.
DISCUSSION
Heterochromatic repeats need to be transcribed to generate dsRNA and propagate their heterochromatic state. We suggest that in wild type embryos, the low levels of K27me and the presence of H3.3 provide a window of opportunity for such transcription in the male pronucleus (Fig. 7d). H3.3K27me1 might support transcription of these regions. Although this certainly deserves further investigation, this is in line with the observed correlation between monomethylation of K27 and active transcription1. Further di- and tri-methylation of K27 in the paternal chromatin and recruitment of HP1β, mediated at least in part through the Hinge region, could ensure subsequent heterochromatinisation of pericentromeric chromatin in the absence of H3K9me3 (Fig. 7d). Our findings that H3.3K9R-expressing embryos develop in normal ratios (Supplementary Information, Fig. S7c-d) further support this notion. HP1β might then act as an architectural component necessary for chromosome segregation and/or for propagation of heterochromatin after the 1st mitosis. Reinforcement of additional histone modifications in the second cell cycle will then facilitate heterochromatin maintenance. In this sense, the mouse embryo might be particularly sensitive, as “naked paternal DNA” will assemble into newly formed chromatin in the moments that follow fertilisation. Indeed, we would not expect to have such a drastic effect following similar manipulations in, for example, a somatic cell where the heterochromatin structure is already established and only needs to be maintained. Although we can not formally rule out the possibility that acetylation of K27 is involved in the developmental heterochromatic defects that we describe, this possibility seems unlikely given the pattern of localisation of H3K27ac in the zygote (excluded from pericentromeric chromatin) and the sharp decrease to almost undetectable levels at the early 2-cell stage (Supplementary Information, Fig. S8a). Moreover, H3K27 has been reported to be hypoacetylated in centromeres 28.
Our results suggest that H3.3 plays an essential role during zygotic S-phase in the transcription of pericentromeric domains that trigger their silencing following the first cell cycle. The acquisition of K27 methylation by the male pronucleus coincides with S-phase (Supplementary Information, Figs. S2-S3, S8b and Ref. 4). Transcription during S-phase has been shown to be critical for the propagation of heterochromatic structures 24. Indeed, the S-phase could be the first time when newly assembled potential heterochromatin in the male pronucleus will be primed to give rise to specialized chromatin regions such as pericentromeric chromatin. Thus, we have uncovered a novel role for H3.3 in the initial establishment of heterochromatin in the mouse embryo.
METHODS
Embryo collection and microinjection
Zygotes were collected at the fertilisation cone stage from F1 (C57BL/6 × CBA/H) crosses upon superovulation ~17h post-hCG injection (h phCG). H3.1 (histone cluster 1, H3e), H3.3, HP1β wt, HP1β CD (K41W42 to AA) and HP1β Δhinge (Δ86-116) mRNAs were transcribed in vitro from the pRN3P plasmid using the mMESSAGE mMACHINE Kit (Ambion). All cDNAs were subcloned to include identical 5′UTR (including KOZAK) and 3′UTR sequences to ensure equivalent expression levels. Zygotes were microinjected with 1-2pl of 120ng/μl of the corresponding mRNAs and their development was monitored at regular intervals. Because it is well established that expression of exogenous histones at levels in excess of just 10-15% of the endogenous can elicit detrimental effects16, we first titrated experimentally the amount of exogenous histones that embryos can tolerate. For this, we injected various amounts of H3.3 wt mRNA to determine the maximum amount of exogenous mRNA that the embryos could tolerate without altering development (Supplementary Information, Fig. S5a). Arbitrary fluorescence units of H3-GFP in the nucleus were quantified comparatively among the groups of embryos using Metamorph (Universal Imaging). ssRNA and dsRNA of the 234bp repeat of mouse major satellite or the LacZ sequence was transcribed using the MaxiScript Kit (Ambion)29. Pictures were acquired with a CoolSnap camera attached to a Leica DMIRE2 inverted microscope.
Immunostaining and fluorescence microscopy
Immunostaining and Confocal analysis was performed as described 5 on a Leica TCS SP2/AOBS inverted confocal microscope using a Plan Apo CS (NA 1.4) 63x objective. Antibodies used were: AlexaFluor635-Phalloidin (Molecular Probes); anti-Cdx2 (BioGenex); anti-H3K27me1 and H3K27me3 (Upstate-Millipore), anti-H3K9me3 (Upstate-Millipore), anti-HP1β (IGBMC), and anti-Crest antisera (Europa Bioproducts). All other antibodies are described in the legends to Supplementary Figures. Time-lapse imaging was performed with a Plan Apo CS (NA 0.7) 20X objective on an inverted Leica DMIRE2 microscope and analysed using Metamorph. Images were captured every 10 or 20 minutes at multiple z-planes (covering 60 μm) to include both pronuclei.
Chromocenter localisation
For chromocenter localisation analysis, embryos expressing H3.3 – GFP wt or H3.3 – GFP K27R mutants were stained with Crest antiserum and DAPI and analysed using confocal microscopy through Z-sections. 3D reconstructions and orthogonal views were analysed with Metamorph from Z-series acquired every 0.6 μm. The number of chromocenters not associated with NLBs per nucleus was determined after 3D reconstitution.
Quantification of fluorescence levels
For quantification of H3K27me levels, pixel intensity values (gray-value intensity of the unprocessed 8-bit images) were determined throughout individual confocal sections covering the complete nucleus (around 19 sections per nucleus) using ImageJ. Values from all sections were added for each nucleus to obtain the total content of H3K27me per nucleus. Controls were analysed under identical conditions and in parallel. For example, in a typical experiment the intensity values of H3K27me3 in H3.3-GFP wt expressing embryos (n=4) were of 1414.8 ± 25 units/nucleus and those for the H3.3-GFP K27R embryos of 932.2 ± 372 (n=8). Likewise, for H3K27me1, values per nucleus were of 372 ± 185 for H3.3-GFP wt embryos (n=6) and 201 ± 49 for H3.3-GFP K27R (n=10).
RT-PCR
For RT-PCR, total mRNA was extracted using the PicoPure RNA extraction kit (Arcturus) and RT-PCR analysis for major satellites was performed from pooled embryos as described 30 and normalised to H2A mRNA levels.
Statistical analysis
Statistical analysis was performed following t-test or ANOVA according to the size of the sample groups.
Aknowledgments
We thank Kami Ahmad for providing H3.3 constructs, Florence Cammas and Tony Kouzarides for HP1β cDNAs, Natacha Dreumont and James Stevenin for advice on RNA-Shift and Olivier Pourquie for critical reading of the manuscript. A.J.B. aknowledges funding from Cancer Research U.K. M.E.T.-P. acknowledges funding from PNRRE and AVENIR programs from INSERM and ANR-09-Blanc-0114.
Footnotes
Competing interests statement. The authors declare that they have no competing financial interests.
Supplementary Information accompanies the paper on www.nature.com/ncb/
REFERENCES
- 1.Kouzarides T. Chromatin modifications and their function. Cell. 2007;128:693–705. doi: 10.1016/j.cell.2007.02.005. [DOI] [PubMed] [Google Scholar]
- 2.Arney KL, Bao S, Bannister AJ, Kouzarides T, Surani MA. Histone methylation defines epigenetic asymmetry in the mouse zygote. Int J Dev Biol. 2002;46:317–20. [PubMed] [Google Scholar]
- 3.Lepikhov K, Walter J. Differential dynamics of histone H3 methylation at positions K4 and K9 in the mouse zygote. BMC Dev Biol. 2004;4:12. doi: 10.1186/1471-213X-4-12. [DOI] [PMC free article] [PubMed] [Google Scholar]
- 4.Santos F, Peters AH, Otte AP, Reik W, Dean W. Dynamic chromatin modifications characterise the first cell cycle in mouse embryos. Dev Biol. 2005;280:225–36. doi: 10.1016/j.ydbio.2005.01.025. [DOI] [PubMed] [Google Scholar]
- 5.Torres-Padilla ME, Bannister AJ, Hurd PJ, Kouzarides T, Zernicka-Goetz M. Dynamic distribution of the replacement histone variant H3.3 in the mouse oocyte and preimplantation embryos. Int J Dev Biol. 2006;50:455–61. doi: 10.1387/ijdb.052073mt. [DOI] [PubMed] [Google Scholar]
- 6.Adenot PG, Mercier Y, Renard JP, Thompson EM. Differential H4 acetylation of paternal and maternal chromatin precedes DNA replication and differential transcriptional activity in pronuclei of 1-cell mouse embryos. Development. 1997;124:4615–25. doi: 10.1242/dev.124.22.4615. [DOI] [PubMed] [Google Scholar]
- 7.Bouniol-Baly C, Nguyen E, Besombes D, Debey P. Dynamic organization of DNA replication in one-cell mouse embryos: relationship to transcriptional activation. Exp Cell Res. 1997;236:201–11. doi: 10.1006/excr.1997.3708. [DOI] [PubMed] [Google Scholar]
- 8.Wouters-Tyrou D, Martinage A, Chevaillier P, Sautiere P. Nuclear basic proteins in spermiogenesis. Biochimie. 1998;80:117–28. doi: 10.1016/s0300-9084(98)80018-7. [DOI] [PubMed] [Google Scholar]
- 9.Wright SJ. Sperm nuclear activation during fertilization. Curr Top Dev Biol. 1999;46:133–78. doi: 10.1016/s0070-2153(08)60328-2. [DOI] [PubMed] [Google Scholar]
- 10.Wiekowski M, Miranda M, Nothias JY, DePamphilis ML. Changes in histone synthesis and modification at the beginning of mouse development correlate with the establishment of chromatin mediated repression of transcription. J Cell Sci. 1997;110(Pt 10):1147–58. doi: 10.1242/jcs.110.10.1147. [DOI] [PubMed] [Google Scholar]
- 11.van der Heijden GW, et al. Asymmetry in histone H3 variants and lysine methylation between paternal and maternal chromatin of the early mouse zygote. Mech Dev. 2005;122:1008–22. doi: 10.1016/j.mod.2005.04.009. [DOI] [PubMed] [Google Scholar]
- 12.Ahmad K, Henikoff S. The histone variant H3.3 marks active chromatin by replication-independent nucleosome assembly. Mol Cell. 2002;9:1191–200. doi: 10.1016/s1097-2765(02)00542-7. [DOI] [PubMed] [Google Scholar]
- 13.Schwartz BE, Ahmad K. Transcriptional activation triggers deposition and removal of the histone variant H3.3. Genes Dev. 2005;19:804–14. doi: 10.1101/gad.1259805. [DOI] [PMC free article] [PubMed] [Google Scholar]
- 14.Hake SB, et al. Expression patterns and post-translational modifications associated with mammalian histone H3 variants. J Biol Chem. 2006;281:559–68. doi: 10.1074/jbc.M509266200. [DOI] [PubMed] [Google Scholar]
- 15.McKittrick E, Gafken PR, Ahmad K, Henikoff S. Histone H3.3 is enriched in covalent modifications associated with active chromatin. Proc Natl Acad Sci U S A. 2004;101:1525–30. doi: 10.1073/pnas.0308092100. [DOI] [PMC free article] [PubMed] [Google Scholar]
- 16.Polo SE, Roche D, Almouzni G. New histone incorporation marks sites of UV repair in human cells. Cell. 2006;127:481–93. doi: 10.1016/j.cell.2006.08.049. [DOI] [PubMed] [Google Scholar]
- 17.Azuara V, et al. Chromatin signatures of pluripotent cell lines. Nat Cell Biol. 2006;8:532–8. doi: 10.1038/ncb1403. [DOI] [PubMed] [Google Scholar]
- 18.Tagami H, Ray-Gallet D, Almouzni G, Nakatani Y. Histone H3.1 and H3.3 complexes mediate nucleosome assembly pathways dependent or independent of DNA synthesis. Cell. 2004;116:51–61. doi: 10.1016/s0092-8674(03)01064-x. [DOI] [PubMed] [Google Scholar]
- 19.Probst AV, Santos F, Reik W, Almouzni G, Dean W. Structural differences in centromeric heterochromatin are spatially reconciled on fertilisation in the mouse zygote. Chromosoma. 2007;116:403–15. doi: 10.1007/s00412-007-0106-8. [DOI] [PubMed] [Google Scholar]
- 20.Muchardt C, et al. Coordinated methyl and RNA binding is required for heterochromatin localization of mammalian HP1alpha. EMBO Rep. 2002;3:975–81. doi: 10.1093/embo-reports/kvf194. [DOI] [PMC free article] [PubMed] [Google Scholar]
- 21.Chen ES, et al. Cell cycle control of centromeric repeat transcription and heterochromatin assembly. Nature. 2008;451:734–7. doi: 10.1038/nature06561. [DOI] [PubMed] [Google Scholar]
- 22.Djupedal I, et al. RNA Pol II subunit Rpb7 promotes centromeric transcription and RNAi-directed chromatin silencing. Genes Dev. 2005;19:2301–6. doi: 10.1101/gad.344205. [DOI] [PMC free article] [PubMed] [Google Scholar]
- 23.Verdel A, et al. RNAi-mediated targeting of heterochromatin by the RITS complex. Science. 2004;303:672–6. doi: 10.1126/science.1093686. [DOI] [PMC free article] [PubMed] [Google Scholar]
- 24.Grewal SI, Elgin SC. Transcription and RNA interference in the formation of heterochromatin. Nature. 2007;447:399–406. doi: 10.1038/nature05914. [DOI] [PMC free article] [PubMed] [Google Scholar]
- 25.Lu J, Gilbert DM. Proliferation-dependent and cell cycle regulated transcription of mouse pericentric heterochromatin. J Cell Biol. 2007;179:411–21. doi: 10.1083/jcb.200706176. [DOI] [PMC free article] [PubMed] [Google Scholar]
- 26.Puschendorf M, et al. PRC1 and Suv39h specify parental asymmetry at constitutive heterochromatin in early mouse embryos. Nat Genet. 2008;40:411–20. doi: 10.1038/ng.99. [DOI] [PubMed] [Google Scholar]
- 27.Motamedi MR, et al. HP1 proteins form distinct complexes and mediate heterochromatic gene silencing by nonoverlapping mechanisms. Mol Cell. 2008;32:778–90. doi: 10.1016/j.molcel.2008.10.026. [DOI] [PMC free article] [PubMed] [Google Scholar]
- 28.Mellone BG, et al. Centromere silencing and function in fission yeast is governed by the amino terminus of histone H3. Curr Biol. 2003;13:1748–57. doi: 10.1016/j.cub.2003.09.031. [DOI] [PubMed] [Google Scholar]
- 29.Wianny F, Zernicka-Goetz M. Specific interference with gene function by double-stranded RNA in early mouse development. Nat. Cell Biol. 2000:70–75. doi: 10.1038/35000016. [DOI] [PubMed] [Google Scholar]
- 30.Lehnertz B, et al. Suv39h-mediated histone H3 lysine 9 methylation directs DNA methylation to major satellite repeats at pericentric heterochromatin. Curr Biol. 2003;13:1192–200. doi: 10.1016/s0960-9822(03)00432-9. [DOI] [PubMed] [Google Scholar]


