

Abstract
This study examined the acute effect of a bout of walking on hunger, energy intake, and appetite-regulating hormones [acylated ghrelin and glucagon-like peptide-1 (GLP-1)] in 19 overweight/obese women (BMI:32.5±4.3kg/m2). Subjects underwent two experimental testing sessions in a counterbalanced order: exercise and rest. Subjects walked at a moderate-intensity for approximately 40 minutes or rested for a similar duration. Subjective feelings of hunger were assessed and blood was drawn at 5 time points (pre-, post-, 30-minutes, 60-minutes, 120-minutes post-testing). Ad-libitum energy intake consumed 1–2 hours post-exercise/rest was assessed and similar between conditions (mean ± standard deviation; exercise: 551.5±245.1 kcals [2.31±1.0MJ] vs. rest: 548.7±286.9 kcals [2.29±1.2MJ]). However, when considering the energy cost of exercise, relative energy intake was significantly lower following exercise (197.8±256.5 kcals [0.83±1.1MJ]) compared to rest (504.3±290.1 kcals [2.11±1.2MJ]). GLP-1 was lower in the exercise vs. resting condition while acylated ghrelin and hunger were unaltered by exercise. None of these variables were associated with energy intake. In conclusion, hunger and energy intake were unaltered by a bout of walking suggesting that overweight/obese individuals do not acutely compensate for the energy cost of the exercise bout through increased caloric consumption. This allows for an energy deficit to persist post-exercise, having potentially favorable implications for weight control.
Keywords: food intake, appetite regulation, energy balance, ghrelin, GLP-1, physical activity
INTRODUCTION
The prevalence of obesity in the United States has risen over the past decade (Flegal, Carroll, Ogden, & Curtin, 2010). Current strategies to enhance weight loss focus on reduced dietary intake and increased physical activity, targeting both sides of the energy balance equation. However, it is unclear whether physical activity and energy intake are independent determinants of energy balance, or whether they interact with one another, having additive or synergistic effects on body weight.
Hubert and colleagues recently suggested that two methods of creating an energy deficit, exercise and calorie restriction, differentially impact subsequent feeding behaviors (Hubert, King, & Blundell, 1998). Unlike calorie restriction which results in a compensatory increase in food intake, exercise may act through a different mechanism, attenuating the need to increase feeding in response to an energy deficit created, thus favoring weight loss. Yet, the control of appetite via exercise is still somewhat controversial and it is unclear whether the influence of exercise on appetite has favorable or detrimental effects on body weight.
Studies examining the acute relationship between exercise and energy intake have reported conflicting findings (Bilski, Teleglow, Zahradnik-Bilska, Dembinski, & Warzecha, 2009), with the majority reporting no change in energy intake after exercise in a lean population (Hubert, et al., 1998; Imbeault, Saint-Pierre, Almeras, & Tremblay, 1997; N. A. King & Blundell, 1995; N. A. King, Snell, Smith, & Blundell, 1996; Reger, Allison, & Kurucz, 1984; Thompson, Wolfe, & Eikelboom, 1988). However few studies have examined this relationship in an overweight/obese population and prior research demonstrates that energy intake after exercise may vary in obese and non-obese individuals (George & Morganstein, 2003; Kissileff, Pi-Sunyer, Segal, Meltzer, & Foelsch, 1990; Ueda, et al., 2009). Whether an exercise bout influences appetite regulation in overweight/obese individuals requires further exploration and factors that may contribute to this potential relationship need to be identified.
It is hypothesized that one pathway by which exercise exerts its effects on appetite is via changes in physiological hormones involved in appetite-control. Although there are many gut peptides involved in this complex process, glucagon-like peptide 1 (GLP-1) and ghrelin both exhibit short-term effects on appetite and have previously been shown to influence feeding and satiety independently (Cummings, et al., 2001; Naslund, Gutniak, Skogar, Rossner, & Hellstrom, 1998; O'Connor, et al., 2006; Wren, et al., 2000). Ghrelin, an orexigenic hormone, and GLP-1, an anorexigenic hormone, were chosen to be examined in the current study because previous research suggests that their concentrations are likely to be influenced by an acute exercise bout (Adam & Westerterp-Plantenga, 2004; Broom, Stensel, Bishop, Burns, & Miyashita, 2007; Marzullo, et al., 2008; O'Connor, et al., 1995; Ueda, et al., 2009). However, very few studies have investigated whether ghrelin and GLP-1 are altered by a bout of exercise in an overweight/obese population (Marzullo, et al., 2008; Ueda, et al., 2009; Westerterp-Plantenga, Verwegen, Ijedema, Wijckmans, & Saris, 1997) and even fewer have concomitantly examined post-exercise changes in hormone concentrations and energy intake (J. A. King, Wasse, Broom, & Stensel, 2010; Martins, Morgan, Bloom, & Robertson, 2007; Ueda, et al., 2009).
Therefore, the primary aim of this study was to examine whether a single bout of moderate intensity walking altered short-term energy intake, subjective feelings of hunger, acylated ghrelin and GLP-1 compared to a resting control condition in overweight/obese women. A secondary aim was to examine individual energy intake responses post-exercise.
SUBJECTS AND METHODS
Subjects
Subjects were recruited through local flyers and online advertisements. Twenty-one pre-menopausal, overweight women participated in this study. All women were between the ages of 18 and 45 and had a BMI between 25.0 and 39.9 kg/m2. All subjects were sedentary, defined as exercising at a moderate-intensity for less than 30 minutes/week over the previous six months. Subjects were excluded from participation in the study if they had a history of a chronic disease (e.g. – cancer, heart disease, diabetes), uncontrolled hypertension or taking blood pressure medication, any condition that would alter one’s metabolism (e.g.. – thyroid disease) or ability to exercise (e.g. – orthopedic limitations), diagnosed psychological disorders (e.g.– depression), recent weight loss of greater than 10 pounds, irregular menstrual cycles (<25 days or >35 days between cycles), or low levels of sleep (<6 hours/night). All subjects provided written informed consent prior to participation in the study and all study procedures were approved by the Institutional Review Board at the University of Pittsburgh. Subjects were compensated $300 upon completion of all study procedures.
Study Protocol
Subjects reported to the center on 3 separate occasions: 1) initial assessment visit, 2) exercise testing session, and 3) resting testing session. Following the initial assessment visit, the order of the testing sessions was randomly assigned. The exercise and resting testing sessions were separated by at least 2 days and testing was conducted between days 7 and 21 of the subject’s menstrual cycle. Both experimental testing sessions were performed at the same time of day (± 1 hour) and were conducted in the morning hours. After completing both testing visits, subjects completed the Three-Factor Eating Questionnaire (Stunkard & Messick, 1985) to assess dietary restraint and disinhibition.
Assessment Visit
Subjects reported to the lab between 07:30 and 09:30 having fasted overnight. Physical activity levels were assessed using the Paffenbarger Physical Activity Questionnaire (Paffenbarger, Wing, & Hyde, 1978). Height, weight, body composition (via bioelectrical impedance analysis), and resting metabolic rate (RMR) were measured using previously published procedures (Jakicic, Marcus, Lang, & Janney, 2008; Jakicic & Wing, 1998). Subjects completed an EKG monitored graded-exercise test (GXT) on a treadmill which was terminated when the subject reached 85% of age-predicted maximal heart rate. This test was performed to ensure subject safety and to allow for estimation of an exercise workload equivalent to 70–75% of age-predicted maximal heart rate (computed as 220 minus age) which was needed to determine the initial grade and speed of the treadmill for the exercise testing session.
Following the completion of all testing procedures, subjects were provided with a liquid meal replacement (47% carbohydrate, 28% fat, 25% protein), equivalent to 15% of measured resting metabolic rate and instructed to consume the beverage 2 hours prior to the upcoming testing visits. Subjects were asked to abstain from exercise for 2 days prior to the testing sessions and to consume only the liquid meal replacement the morning of testing.
Experimental Testing Sessions
Subjects reported to the lab between 7:30 and 9:30 on the morning of testing and compliance to pre-test guidelines was assessed. Body weight was measured and subjects completed questionnaires to assess mood (Watson, Clark, & Tellegen, 1988), hunger (see section below), and fatigue (McAuley & Courneya, 1994). A pre-testing blood sample was obtained via venepucture just prior to the start of the exercise or resting session. Immediately following the exercise/resting bout, the mood/hunger questionnaires were re-administered and a post-testing blood sample was obtained.
For the next two hours, subjects rested quietly while watching a video for the first hour and reading magazines during the second hour. Additional blood draws were performed at 30, 60, and 120 minutes post-exercise/rest and the mood/hunger/fatigue questionnaires were administered just prior to each blood draw. After the first hour of rest, subjects were provided ad-libitum access to a variety of snack foods unaware that food intake during this one-hour feeding period (1–2 hours post-exercise/rest) was being monitored. The food available to the subject was as follows: bagels (plain and cinnamon raisin), cream cheese (reduced fat and regular), butter, peanut butter, granola, three types of cereal, milk (2% and fat-free), yogurt (regular and reduced fat), powdered and chocolate mini-donuts, a variety of nutrition or snack bars, mixed berries, tea, and coffee. Energy intake (EI) was determined by weighing the food before and after the 1-hour feeding period. All subjects were presented with the same variety of foods which was held constant across testing days and subjects consumed these foods in isolation. Resting and exercise sessions were scheduled within one-hour of each other. Non-caloric fluid intake was monitored from immediately post-exercise until after the feeding session.
Exercise Testing Session
Subjects walked on a treadmill at 3.0 mph at a grade that elicited a heart rate between 70–75% of aged-predicted maximal heart rate. The initial grade of the treadmill was based upon an individuals’ heart rate response during the GXT at the assessment visit. Heart rate was monitored continuously and recorded every minute. If the subject’s heart rate fell outside the target heart rate range for 2 consecutive minutes the workload of the treadmill was adjusted appropriately. In order for the energy deficit created by the exercise bout to be comparable between subjects of different body weights, the exercise testing session was terminated once an energy expenditure (EE) of 3.0 kcal/kg [0.01 MJ/kg] of body weight was achieved, based upon the American College of Sports Medicine’s (ACSM) prediction equation for the energy expenditure of walking (American College of Sports Medicine, 2006). Oxygen consumption was monitored continuously using breath-by-breath analyses (Vmax Spectra; SensorMedics, Yorba Linda, CA) to measure actual energy expenditure during the exercise session. However, these data were not available until after the exercise session; thus the termination of the exercise test was dependent upon energy expenditure prediction equations. Given that the goal was to place all subjects at a comparable energy deficit for their body weight, neither the total energy expenditure nor the duration of the exercise session was held constant across subjects.
Resting Testing Session
Subjects rested in a seated, upright position for a predetermined length of time. By design, the length of the resting session was to be similar to the exercise testing session described above. However, because subjects were randomized to undergo either the exercise or resting testing condition first, the length of the resting session was estimated using ACSM’s metabolic equations for the energy expenditure of walking, with the workload reflecting the workload on the GXT that elicited a heart rate of 70% of age-predicted maximum. The duration needed to achieve 3.0 kcal/kg [0.01 MJ/kg] body weight, using this specified workload, was identified as the duration of the resting bout.
Subjective Feelings of Hunger
Subjective feelings of hunger were measured at five separate time points throughout the testing session, just prior to each blood draw (pre-testing, immediately post-testing, 30-minutes post-testing, 60-minutes post-testing, and 120-minutes post-testing). Hunger was assessed using two methods. Subjects were asked to rate their hunger using a 100mm visual analogue scale (VAS) anchored with “not hungry at all” and “very hungry” and using a 7-point Likert scale (1=not at all hungry, 7=very much so hungry). In an attempt to blind subjects that the measurement of hunger was a primary outcome measure of this study, these hunger questions were included as part of a larger questionnaire which contained additional questions related to mood.
Blood Analyses
Venous blood was collected in chilled tubes containing EDTA for analysis of GLP-1 and acylated ghrelin at five separate time points for each testing condition. For total GLP-1, the blood sample was stored on ice until it was centrifuged at 1000 G for 10 minutes at 4°C. One milliliter of plasma was then aliquotted into storage tubes and stored at −70°C until the analysis was performed using ELISA kits (ALPCO, Salem, NH). This assay has a sensitivity of 0.206 ng/ml and an inter- and intra-assay coefficient of variation of 9.9%, and 4.6% respectively.
In preparation for the acylated ghrelin assay, 10µl of p-hydroxymercuribenzoic acid (PHMB) was added (per ml of blood) to prevent the degradation of acylated ghrelin by protease. Samples were centrifuged at 1000 G for 10 minutes at 4°C. The supernatant was transferred and 100µl of 1N HCl was added per ml of plasma before centrifuging at 2054 G for 5 minutes at 4°C. One mL was aliquoted into tubes and stored at −70°C. An ELISA kit (ALPCO, Salem, NH) was used to assess acylated ghrelin concentrations in the blood. This assay has a sensitivity of 0.8 pg/ml and an inter- and intra-assay coefficient of variation of 3.9% and 3.0% respectively. All samples from a single person were performed using the same assay kit to reduce intra-individual variability.
Statistical Analyses
Statistical analyses were performed using SPSS for Windows (SPSS Inc., Chicago IL, version 15.0). Descriptive statistics were computed for all variables. Paired samples t-tests were used to determine whether there were differences in energy intake between experimental conditions. Multiple 5 × 2 ANOVAs were performed to examine the influence of time (pre-test, post-test, 30-, 60-, 120-min post) and condition (exercise and rest) on subjective feelings of hunger, GLP-1, and acylated ghrelin concentration, with and without adjusting for BMI. Post-hoc multiple pairwise comparisons using the Bonferoni adjustment were performed when statistical significance was detected. Area under the curve (AUC) values for subjective feelings of hunger, acylated ghrelin, and GLP-1 were calculated using the trapezoidal rule. Paired t-tests were used to assess differences between AUC values for each of these variables. Pearson correlation coefficients were calculated to examine relationships between hormone concentrations, hunger, and energy intake. The assumption of normality was assessed using the Shapiro-Wilk test and statistical significance was set at p<0.05. Data are expressed as mean ± standard deviation throughout the paper unless otherwise noted.
RESULTS
Subjects
Twenty-one subjects completed the initial assessment visit; however following this visit, one participant was ineligible due to an abnormal EKG finding and another was unable to complete additional testing due to irregularities with her menstrual cycle. Thus, complete data were collected on 19 subjects. Descriptive statistics are shown in Table 1. In short, subjects were overweight or obese (BMI: 32.5 kg/m2), had a mean age of 28.5 years, and were relatively sedentary, with an average activity energy expenditure of 586 kcal/wk. Dietary restraint (conscious control of food intake in order to prevent weight gain or achieve weight loss) and disinhibition (the loss of control over eating) scores were 10.3 and 9.9 respectively, similar to values seen in other samples of obese women (d'Amore, et al., 2001).
Table 1.
Descriptive statistics
| Mean ± SD (n=19) |
|
|---|---|
| Age (years) | 28.5 ± 8.3 |
| Height (cm) | 163.0 ± 4.5 |
| Weight (kg) | 86.8 ± 13.5 |
| BMI (kg/m2) | 32.5 ± 4.3 |
| Fitness (submax METs) | 6.5 ± 3.3 |
| Physical activity (kcal/wk) | 586.4 ± 529.9 |
| Physical activity (MJ/wk) | 2.46 ± 2.2 |
| Body composition (% body fat) | 41.7 ± 4.9 |
| RMR (kcals/day) | 1403.6 ± 272.7 |
| RMR (MJ/day) | 5.88 ± 1.1 |
| Cognitive restraint | 10.28 ± 4.3 |
| Disinhibition | 9.89 ± 2.7 |
Fitness is expressed as the metabolic equivalent (MET) at 85% of age-predicted maximal heart rate
Duration and Energy Expenditure of Exercise and Resting Sessions
As shown in Table 2, the exercise session resulted in a significantly higher energy expenditure after exercise compared to after rest (p<0.001). Although the exercise session was terminated when 3.0 kcal/kg [0.01 MJ/kg] was achieved using prediction equations, indirect calorimetry measurements indicate that participants expended 4.1 kcal/kg [0.02 MJ/kg] of body weight during the exercise session. The mean respiratory exchange ratio (RER) was significantly higher and the duration of the session was significantly longer in the exercise condition compared to the resting condition (p<0.05).
Table 2.
Exercise and resting testing sessions
| Exercise | Rest | p-value | |
|---|---|---|---|
| Energy Expenditure (kcal) | 353.6 ± 71.9 | 44.3 ± 8.9 | <0.001 |
| Energy Expenditure (MJ) | 1.48 ± 0.3 | 0.19 ± 0.4 | <0.001 |
| Testing Time (min) | 42.3 ± 7.7 | 35.3 ± 5.1 | <0.001 |
| Respiratory Exchange Ratio* | 0.82 ± 0.05 | 0.78 ± 0.05 | <0.05 |
| Absolute Energy Intake (kcals) | 551.5 ± 245.1 | 548.7 ± 286.9 | 0.92 |
| Absolute Energy Intake (MJ) | 2.31 ± 1.0 | 2.29 ± 1.2 | 0.92 |
| Relative Energy Intake (kcals)* | 197.8 ± 256.5 | 504.3 ± 290.1 | <0.001 |
| Relative Energy Intake (MJ)* | 0.83 ± 1.1 | 2.11 ± 1.2 | <0.001 |
| Fluid Intake (ml)** | 672.8 ± 616.7 | 438.7 ± 336.3 | 0.02 |
Mean ± standard deviation
Respiratory Exchange Ratio (RER) represents the mean value during the experimental testing session
Relative Energy Intake computed as ad-libitum energy intake minus energy expenditure during experimental condition.
Subjects were provided with water immediately post-exercise or rest. The quantity of water consumed immediately post-testing up until 120-minutes post-testing was added to the amount of coffee or tea consumed during the ad-libitum feeding period to quantify the total fluid intake for the testing session
The Effect of Exercise on Energy Intake
As shown in the Table 2, ad-libitum energy intake 1–2 hours post-testing was similar between exercise and resting conditions (p=0.92). Relative energy intake (REI), calculated as energy intake minus energy expenditure, was determined separately for the exercise and resting conditions and was significantly lower after exercise compared to rest (p<0.001; Table 2). These findings were not altered when multiple psychological and anthropometric variables were included as covariates in the analyses (data not shown). Fluid intake was significantly higher post-exercise compared to post-rest (p<0.05; Table 2), but did not correlate with energy intake.
Figure 1 illustrates the individual variability seen in feeding behaviors post-exercise. The difference in energy intake between conditions (EIdiff) was calculated as EIex – EIrest. Fifty-eight percent had a lower energy intake after exercise compared to rest (R>E; EIdiff : −71.5 ± 65.4 kcals [0.30 ± 0.3 MJ]) and 42% had a higher energy intake after exercise compared rest (R<E; EIdiff : 105.1 ± 123.4 kcals [0.44 ± 0.5 MJ]). Of particular interest were the 8 subjects who consumed more post-exercise compared to post-rest. In order to determine the potential impact of this acute increase in energy intake on body weight, we calculated the net energy expenditure (EEdiff = EEex – EErest; indicated by dotted line in Figure 1) and compared this to the EIdiff. As a result, only one individual increased energy intake to a magnitude that would result in a positive energy balance (the subject to the far right in Figure 1) and the remaining participants were left with an energy deficit of at least 200 kilocalories [0.84 MJ] after the exercise and feeding session.
FIGURE 1.
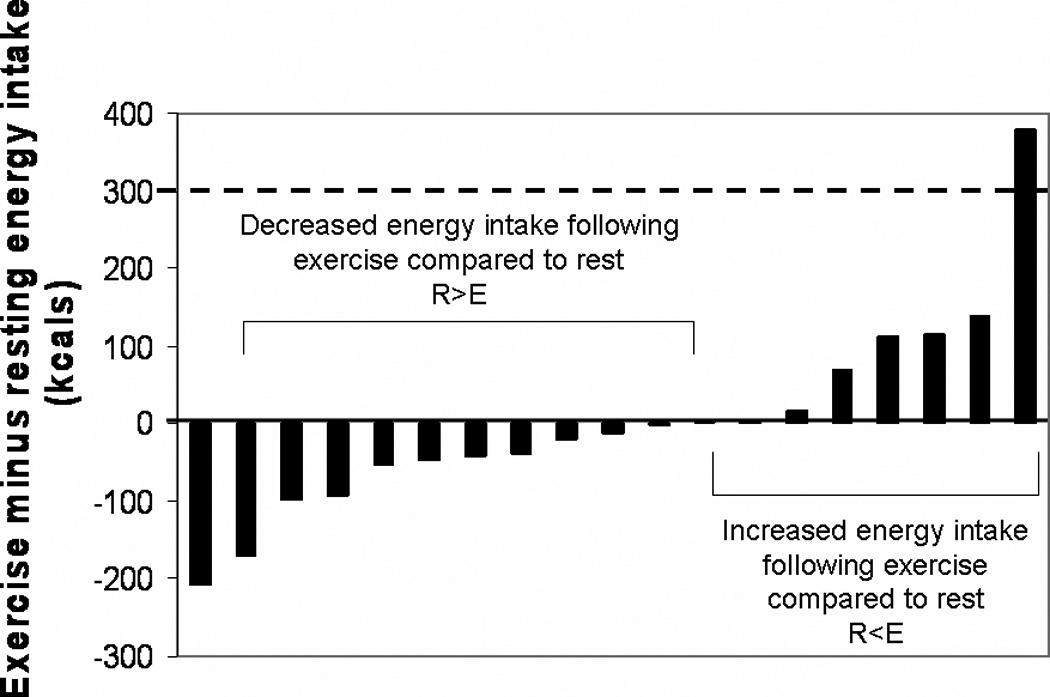
Individual differences in energy intake between exercise and resting sessions. The difference in energy intake between conditions (EIdiff) was calculated as the ad-libitum energy intake following the exercise session (EIex) minus the ad-libitum energy intake following the resting session (EIrest). The solid line indicates where EIex = EIrest. The dashed line reflects the net energy expenditure (EEex - EErest) of the exercise session.
The Effect of Exercise on Subjective Feelings of Hunger
The effect of exercise on subjective feelings of hunger did not differ between the VAS and Likert scale measurements; therefore the Likert scale data are presented in Figure 2 for both exercise and resting conditions. Pre-testing hunger scores were similar between conditions (p=0.39). There was a slightly greater increase in hunger from pre to post-exercise compared to pre to post-rest but this was not significant (p=0.10). At 30 and 60-minutes post-testing, hunger ratings were not different between conditions (p=0.51 and p=0.60, respectively). As expected, there was a significant decline in hunger from pre- to post-feeding (60 to 120 minutes post-testing) and this reduction was similar between experimental conditions (p=0.16). The AUC for hunger was not different between exercise and resting conditions (395.5 ± 164.5 vs. 391.7 ± 192.6; p =0.94).
FIGURE 2.
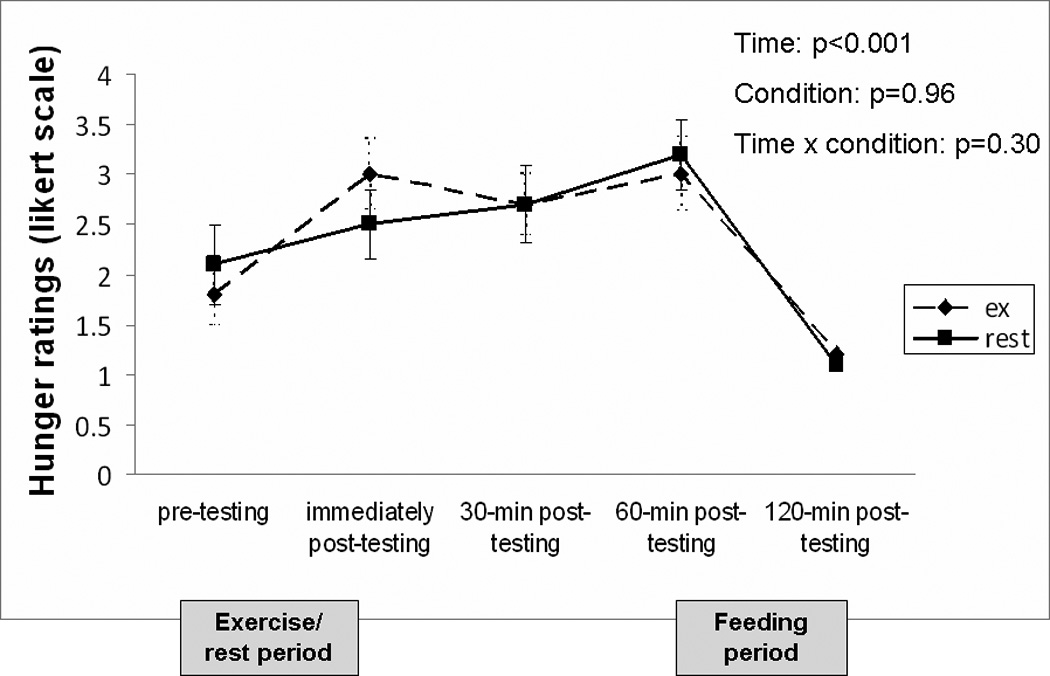
Change in subjective feelings of hunger over time for testing conditions. Subjects were asked to rate their hunger at 5 separate time points using a 7-point Likert scale (1=not at all, 7=very much so). Low numbers indicate that the subject was not hungry while higher numbers imply the opposite. A liquid meal replacement was consumed 2 hours prior to the pre-testing time point. Data is presented as mean ± standard error.
The Effect of Exercise on Acylated Ghrelin and GLP-1
Figure 3 shows the change in acylated ghrelin over time for each experimental condition. Pre-testing ghrelin concentrations were similar prior to exercise and rest (p=0.73). The overall time × condition interaction effect was not significant (p=0.16) but ghrelin significantly decreased over time when averaged across conditions (p<0.05). Calculation of the area under the curve for the entire testing day was similar between exercise (12720.6 ± 6677.3 pg/mL × 120min) and rest (13052.6 ± 5291.0 pg/mL × 120min; p=0.65). There was no significant interaction between BMI and condition, thus BMI did not moderate the effect of exercise on ghrelin (p=0.97).
FIGURE 3.
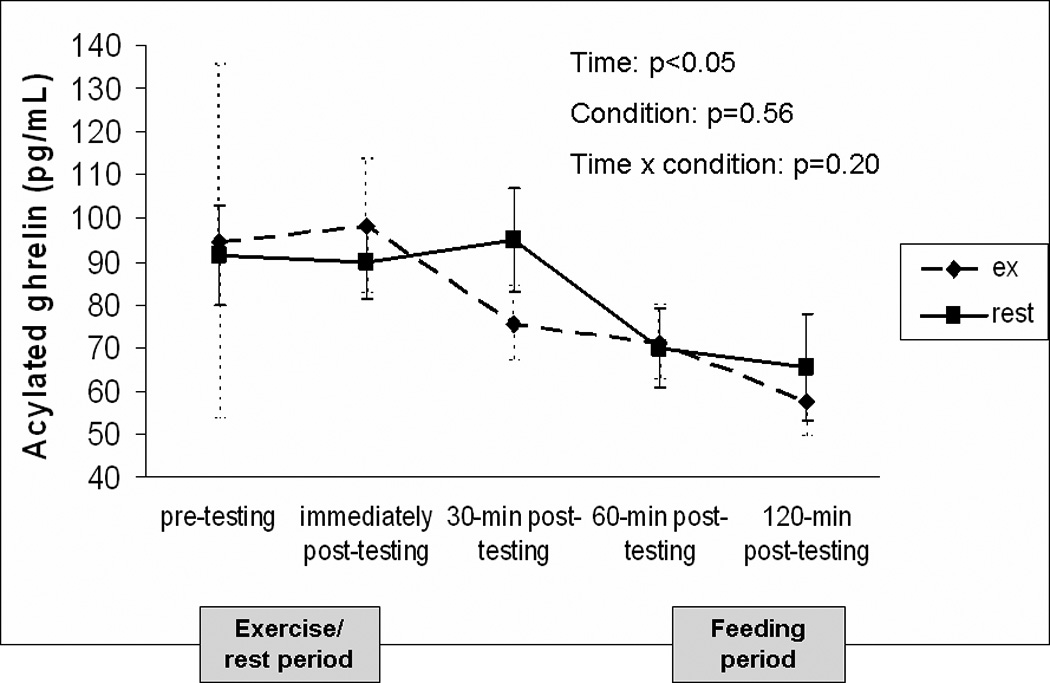
Change in acylated ghrelin concentrations over time for testing conditions. A liquid meal replacement was consumed 2 hours prior to the pre-testing time point. Data is presented as mean ± standard error.
The change in GLP-1 over time for both experimental conditions is shown in Figure 4. Pre-testing GLP-1 concentrations were similar prior to exercise and rest (p=0.41). The overall condition × time interaction effect was not significant (p=0.42). However, there was a trend for GLP-1 to be higher in the resting condition compared to the exercise condition when averaged over time (p=0.06). At 60-minutes post-exercise, GLP-1 concentrations were significantly lower than the resting condition (p<0.05). The area under the curve for GLP-1 across the entire testing day was significantly lower after exercise (402.4 ± 98.8 ng/mL × 120min) compared to rest (422.8 ± 103.2 ng/mL × 120min; p<0.05). There was no significant interaction between BMI and condition, thus BMI did not moderate the effect of exercise on GLP-1 (p=0.29).
FIGURE 4.
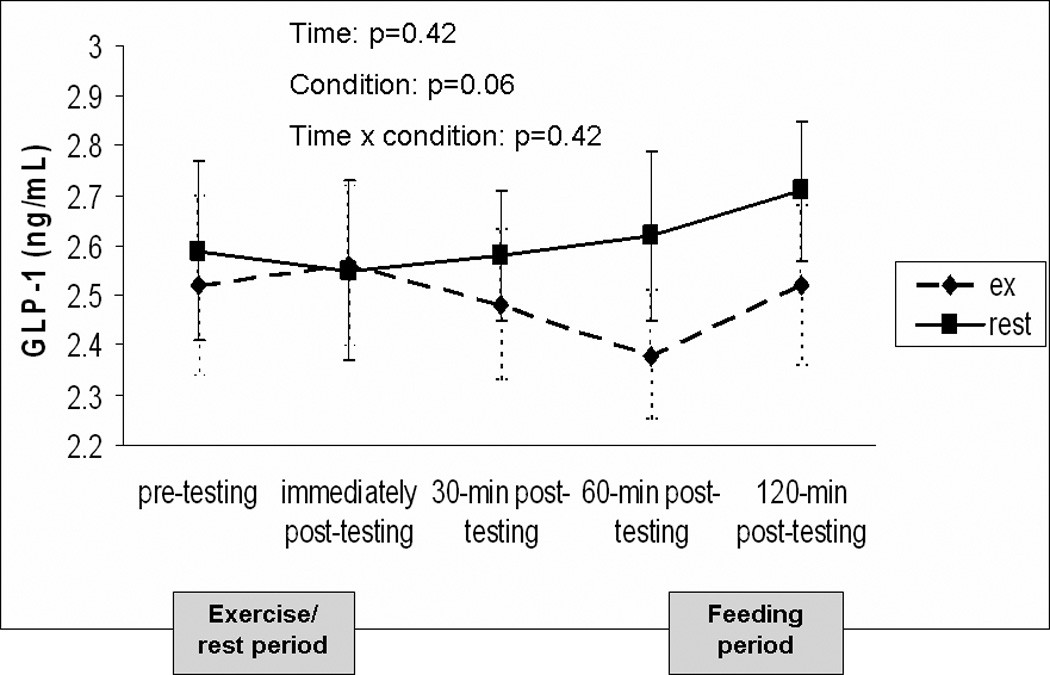
Change in GLP-1 concentrations over time for testing conditions. A liquid meal replacement was consumed 2 hours prior to the pre-testing time point. Data is presented as mean ± standard error.
Correlational analyses revealed that acylated ghrelin and GLP-1 were not significantly correlated with energy intake or subjective feelings of hunger in either condition at any time point (data not shown). However, pre-testing acylated ghrelin concentrations were negatively correlated with RMR (r=−0.476, p<0.05) but not age, body weight, BMI, or percent body fat. Pre-testing GLP-1 concentrations were only significantly correlated with age (r=0.504, p<0.05).
DISCUSSION
In the current study, subjective feelings of hunger and ad-libitum energy intake were unaltered by a bout of moderate-intensity walking compared to a resting condition. This contradicts the belief that exercise may counteract weight loss efforts due to an acute increase in hunger. Although energy intake was not suppressed after exercise as previously reported (Ueda, et al., 2009; Westerterp-Plantenga, et al., 1997), the clinical implications of these findings remain favorable regarding the role of exercise in weight control. Unlike calorie restriction which results in a compensatory increase in energy intake (Hubert, et al., 1998), we found that an exercise-induced energy deficit can remain for at least 2 hours post-exercise. Consequently, these findings suggest that it is unlikely that exercise would lead to weight gain as a result of an acute increase in hunger and energy intake in overweight individuals; however it is unclear whether this energy deficit is preserved beyond the time point measured in the current study.
Compared to other studies involving overweight/obese participants, our findings support those of Kissileff et al. (Kissileff, et al., 1990) but contrast with those of other investigators who reported a reduction in energy intake post-exercise compared to post-rest (Ueda, et al., 2009; Westerterp-Plantenga, et al., 1997). It is possible that gender differences or variations in exercise duration may explain these conflicting findings, although this requires further investigation. Our findings also suggest that it may be important to scrutinize variation in individual energy intake responses in addition to those at the group level. Approximately 42% of our sample increased energy intake after exercise while the remaining 58% reduced energy intake post-exercise compared to a resting condition; thus canceling each other out at the group-level. Large variability in energy intake post-exercise has also been reported in normal weight individuals (Finlayson, Bryant, Blundell, & King, 2009). In the previous study, approximately 50% of subjects created a positive energy balance while the remaining 50% created a negative energy balance following a 50-minute cycling bout. The authors reported that differences in BMI, habitual exercise, and implicit wanting explained some of the variation between groups.
Despite the large variability in energy intake responses in the current study, a larger proportion of participants had created a negative energy deficit following the exercise and feeding sessions compared to the study by Finlayson et al. (Finlayson, et al., 2009). Ninety five percent of our subjects created a short-term energy deficit following the exercise and feeding sessions while only one subject increased energy intake post-exercise to a magnitude that would result in a positive energy balance. These findings are clinically significant, indicating that a single bout of exercise can assist overweight/obese individuals in their weight control efforts. However, this is highly dependent upon whether food intake is altered later in the day to compensate for the energy expended during the exercise bout. Future studies should continue to explore individual responses in energy intake following exercise and monitor subjects for longer durations post-exercise.
In addition to examining post-exercise energy intake, this study examined the impact of exercise on acylated ghrelin and GLP-1. Similar to previous studies (J. A. King, et al., 2010; Martins, et al., 2007; Ueda, et al., 2009), acylated ghrelin was unaltered by the exercise bout and did not differ from the resting condition when measured for two hours post-testing. Pre to post-exercise changes in ghrelin did not predict energy intake, suggesting that ghrelin may not be involved in the control of appetite after exercise or that the lack of change in ghrelin may explain why hunger and energy intake were not altered by the exercise bout.
The finding that GLP-1 concentrations were slightly lower after exercise compared to rest is contrary to previous research which indicates that GLP-1 rises following exercise (Adam & Westerterp-Plantenga, 2004; Martins, et al., 2007; O'Connor, et al., 1995; Ueda, et al., 2009). These conflicting findings may be explained by differences in body weight between study samples or the fact that exercise may differentially affect obese and non-obese individuals; however this is still unclear (Adam & Westerterp-Plantenga, 2004; Ueda, et al., 2009). Despite the small reduction in GLP-1 post-exercise in the current study, changes in GLP-1 did not predict energy intake responses; nor does it appear that the magnitude of change in GLP-1 was large enough to alter hunger and thus may not greatly contribute to post-exercise energy intake or short-term regulation of energy balance.
Although not a primary aim, this study examined the impact of body weight on changes in GLP-1, ghrelin, and ad-libitum energy intake after exercise. Previous research indicates that obese and non-obese individuals have dissimilar short-term feeding responses following an exercise session (George & Morganstein, 2003; Kissileff, et al., 1990; Westerterp-Plantenga, et al., 1997) and that GLP-1 (Adam & Westerterp-Plantenga, 2004; Ranganath, et al., 1996) and ghrelin concentrations (Marzullo, et al., 2008; Tschop, et al., 2001) differ in obese and non-obese individuals. However, it is unknown whether these differences are caused by excess body weight or whether they are dependent upon the degree of obesity. Current findings indicate that BMI was not associated with GLP-1 or acylated ghrelin at any time point, nor did BMI influence the relationship between exercise and energy intake. However, this was a very limited sample of overweight/obese subjects and it is unclear whether the association between BMI and hormone concentrations would have been present had normal weight subjects also participated in the study.
The findings of this study should be considered in the context of certain limitations. This study monitored subjects for 2 hours post-testing, which limits the understanding of how exercise may influence these parameters beyond this period of time and whether individuals would have similar feeding responses in a free-living environment is unclear. Additionally, cognitive factors previously shown to influence compensation following exercise (e.g. - liking and wanting for particular food items) were not measured in the current study, thus we are unable to determine the impact of these factors on energy intake. Also, we do not know whether subjects typically ate between 9:00am and 12:00pm, thus this may not have been the most likely time of day for them to compensate for the exercise bout. Lastly, the mean exercise duration of 42.3 ± 7.7 minutes was longer than the estimated 35 minutes based on the baseline graded exercise test. This difference may have been a result of the heart rate and energy expenditure relationship during this experimental session differing from what was expected based on the baseline exercise test that was used to estimate the workloads for the experimental session. Thus, we are unable to determine the effect that the difference in testing durations between exercise and resting conditions may have had on the outcomes of this study.
In conclusion, in order to better understand the role of exercise in weight control it is essential to determine whether exercise and feeding behaviors are two independent determinants of energy balance or whether they interact with one another to influence body weight. In the current study, exercise did not acutely alter hunger or food intake in overweight/obese women which may have favorable implications for weight control. This suggests that exercise may uniquely alter some unknown psychological or physiological parameter, attenuating the need to acutely restore energy balance post-exercise. Additional research is needed to explore other possible mechanisms that may explain this relationship and future studies should continue to focus on the individual variability in feeding responses following an exercise bout. Finally, it will be important for subsequent studies to assess how energy intake is impacted by exercise over longer periods.
ACKNOWLEDGEMENTS
This study was supported by the University of Pittsburgh Obesity and Nutrition Research Center (P30 DK46204), the University of Pittsburgh Physical Activity and Weight Management Research Center, and the School of Education at the University of Pittsburgh. The authors thank the staff at the Physical Activity and Weight Management Research Center for their assistance with this study as well as those at the Heinz Nutrition Laboratory in the Graduate School of Public Health at the University of Pittsburgh for processing the blood samples. Great appreciation is expressed to Dr. Rena Wing and Dr. Dale Bond for their critical insights in the development of this manuscript.
References
- Adam TC, Westerterp-Plantenga MS. Activity-induced GLP-1 release in lean and obese subjects. Physiol Behav. 2004;83(3):459–466. doi: 10.1016/j.physbeh.2004.08.035. [DOI] [PubMed] [Google Scholar]
- American College of Sports Medicine. ACSM's guidelines for exercise testing and prescription. 7 ed. New York: Lippincott Williams & Wilkins; 2006. [DOI] [PubMed] [Google Scholar]
- Bilski J, Teleglow A, Zahradnik-Bilska J, Dembinski A, Warzecha Z. Effects of exercise on appetite and food intake regulation. Med Sport. 2009;13(2):82–94. [Google Scholar]
- Broom DR, Stensel DJ, Bishop NC, Burns SF, Miyashita M. Exercise-induced suppression of acylated ghrelin in humans. J Appl Physiol. 2007;102(6):2165–2171. doi: 10.1152/japplphysiol.00759.2006. [DOI] [PubMed] [Google Scholar]
- Cummings DE, Purnell JQ, Frayo RS, Schmidova K, Wisse BE, Weigle DS. A preprandial rise in plasma ghrelin levels suggests a role in meal initiation in humans. Diabetes. 2001;50(8):1714–1719. doi: 10.2337/diabetes.50.8.1714. [DOI] [PubMed] [Google Scholar]
- d'Amore A, Massignan C, Montera P, Moles A, De Lorenzo A, Scucchi S. Relationship between dietary restraint, binge eating, and leptin in obese women. Int J Obes Relat Metab Disord. 2001;25(3):373–377. doi: 10.1038/sj.ijo.0801565. [DOI] [PubMed] [Google Scholar]
- Finlayson G, Bryant E, Blundell JE, King NA. Acute compensatory eating following exercise is associated with implicit hedonic wanting for food. Physiol Behav. 2009;97(1):62–67. doi: 10.1016/j.physbeh.2009.02.002. [DOI] [PubMed] [Google Scholar]
- Flegal KM, Carroll MD, Ogden CL, Curtin LR. Prevalence and trends in obesity among US adults 1999-2008. JAMA. 2010;303(3):235–241. doi: 10.1001/jama.2009.2014. [DOI] [PubMed] [Google Scholar]
- George VA, Morganstein A. Effect of moderate intensity exercise on acute energy intake in normal and overweight females. Appetite. 2003;40(1):43–46. doi: 10.1016/s0195-6663(02)00146-0. [DOI] [PubMed] [Google Scholar]
- Hubert P, King NA, Blundell JE. Uncoupling the effects of energy expenditure and energy intake: appetite response to short-term energy deficit induced by meal omission and physical activity. Appetite. 1998;31(1):9–19. doi: 10.1006/appe.1997.0148. [DOI] [PubMed] [Google Scholar]
- Imbeault P, Saint-Pierre S, Almeras N, Tremblay A. Acute effects of exercise on energy intake and feeding behaviour. Br J Nutr. 1997;77(4):511–521. doi: 10.1079/bjn19970053. [DOI] [PubMed] [Google Scholar]
- Jakicic JM, Marcus BH, Lang W, Janney C. Effect of exercise on 24-month weight loss maintenance in overweight women. Arch Intern Med. 2008;168(14):1550–1559. doi: 10.1001/archinte.168.14.1550. discussion 1559-1560. [DOI] [PMC free article] [PubMed] [Google Scholar]
- Jakicic JM, Wing RR. Differences in resting energy expenditure in African-American vs Caucasian overweight females. Int J Obes Relat Metab Disord. 1998;22(3):236–242. doi: 10.1038/sj.ijo.0800575. [DOI] [PubMed] [Google Scholar]
- King JA, Wasse LK, Broom DR, Stensel DJ. Influence of brisk walking on appetite, energy intake, and plasma acylated ghrelin. Med Sci Sports Exerc. 2010;42(3):485–492. doi: 10.1249/MSS.0b013e3181ba10c4. [DOI] [PubMed] [Google Scholar]
- King NA, Blundell JE. High-fat foods overcome the energy expenditure induced by high-intensity cycling or running. Eur J Clin Nutr. 1995;49(2):114–123. [PubMed] [Google Scholar]
- King NA, Snell L, Smith RD, Blundell JE. Effects of short-term exercise on appetite responses in unrestrained females. Eur J Clin Nutr. 1996;50(10):663–667. [PubMed] [Google Scholar]
- Kissileff HR, Pi-Sunyer FX, Segal K, Meltzer S, Foelsch PA. Acute effects of exercise on food intake in obese and nonobese women. Am J Clin Nutr. 1990;52(2):240–245. doi: 10.1093/ajcn/52.2.240. [DOI] [PubMed] [Google Scholar]
- Martins C, Morgan LM, Bloom SR, Robertson MD. Effects of exercise on gut peptides, energy intake and appetite. J Endocrinol. 2007;193(2):251–258. doi: 10.1677/JOE-06-0030. [DOI] [PubMed] [Google Scholar]
- Marzullo P, Salvadori A, Brunani A, Verti B, Walker GE, Fanari P, et al. Acylated ghrelin decreases during acute exercise in the lean and obese state. Clin Endocrinol (Oxf) 2008 doi: 10.1111/j.1365-2265.2008.03275.x. [DOI] [PubMed] [Google Scholar]
- McAuley E, Courneya CA. The subjective exercise experiences scale (SEES): Development and preliminary validation. J Sport Exerc Psychol. 1994;16:163–177. [Google Scholar]
- Naslund E, Gutniak M, Skogar S, Rossner S, Hellstrom PM. Glucagon-like peptide 1 increases the period of postprandial satiety and slows gastric emptying in obese men. Am J Clin Nutr. 1998;68(3):525–530. doi: 10.1093/ajcn/68.3.525. [DOI] [PubMed] [Google Scholar]
- O'Connor AM, Johnston CF, Buchanan KD, Boreham C, Trinick TR, Riddoch CJ. Circulating gastrointestinal hormone changes in marathon running. Int J Sports Med. 1995;16(5):283–287. doi: 10.1055/s-2007-973006. [DOI] [PubMed] [Google Scholar]
- O'Connor AM, Pola S, Ward BM, Fillmore D, Buchanan KD, Kirwan JP. The gastroenteroinsular response to glucose ingestion during postexercise recovery. Am J Physiol Endocrinol Metab. 2006;290(6):E1155–E1161. doi: 10.1152/ajpendo.00500.2005. [DOI] [PubMed] [Google Scholar]
- Paffenbarger RS, Jr, Wing AL, Hyde RT. Physical activity as an index of heart attack risk in college alumni. Am J Epidemiol. 1978;108(3):161–175. doi: 10.1093/oxfordjournals.aje.a112608. [DOI] [PubMed] [Google Scholar]
- Ranganath LR, Beety JM, Morgan LM, Wright JW, Howland R, Marks V. Attenuated GLP-1 secretion in obesity: cause or consequence? Gut. 1996;38(6):916–919. doi: 10.1136/gut.38.6.916. [DOI] [PMC free article] [PubMed] [Google Scholar]
- Reger WE, Allison TG, Kurucz RL. Exercise, postexercise, metabolic rate, and appetite. In: Katch FI, editor. Sport, Health, and Nutrition. Vol. 2. Champaign IL: Human Kinetics Publishers, Inc.; 1984. [Google Scholar]
- Stunkard AJ, Messick S. The three-factor eating questionnaire to measure dietary restraint, disinhibition and hunger. J Psychosom Res. 1985;29(1):71–83. doi: 10.1016/0022-3999(85)90010-8. [DOI] [PubMed] [Google Scholar]
- Thompson DA, Wolfe LA, Eikelboom R. Acute effects of exercise intensity on appetite in young men. Med Sci Sports Exerc. 1988;20(3):222–227. doi: 10.1249/00005768-198806000-00002. [DOI] [PubMed] [Google Scholar]
- Tschop M, Weyer C, Tataranni PA, Devanarayan V, Ravussin E, Heiman ML. Circulating ghrelin levels are decreased in human obesity. Diabetes. 2001;50(4):707–709. doi: 10.2337/diabetes.50.4.707. [DOI] [PubMed] [Google Scholar]
- Ueda SY, Yoshikawa T, Katsura Y, Usui T, Nakao H, Fujimoto S. Changes in gut hormone levels and negative energy balance during aerobic exercise in obese young males. J Endocrinol. 2009;201(1):151–159. doi: 10.1677/JOE-08-0500. [DOI] [PubMed] [Google Scholar]
- Watson D, Clark LA, Tellegen A. Development and validation of brief measures of positive and negative affect: the PANAS scales. J Pers Soc Psychol. 1988;54(6):1063–1070. doi: 10.1037//0022-3514.54.6.1063. [DOI] [PubMed] [Google Scholar]
- Westerterp-Plantenga MS, Verwegen CR, Ijedema MJ, Wijckmans NE, Saris WH. Acute effects of exercise or sauna on appetite in obese and nonobese men. Physiol Behav. 1997;62(6):1345–1354. doi: 10.1016/s0031-9384(97)00353-3. [DOI] [PubMed] [Google Scholar]
- Wren AM, Small CJ, Ward HL, Murphy KG, Dakin CL, Taheri S, et al. The novel hypothalamic peptide ghrelin stimulates food intake and growth hormone secretion. Endocrinology. 2000;141(11):4325–4328. doi: 10.1210/endo.141.11.7873. [DOI] [PubMed] [Google Scholar]