

Abstract
Compounds 1–4 were synthesized and investigated for selectivity and potency for the oxytocin receptor (OTR) to determine their viability as radioactive ligands. Binding assays determined 1–4 to have high binding affinity for both the human and rodent OTR and also have high selectivity for the human OTR over human vasopressin V1a receptors (V1aR). Inadequate selectivity for OTR over V1aR was found for rodent receptors in all four compounds. The radioactive (C-11, F-18, and I-125) derivatives of 1–4 were synthesized and investigated for use as autoradiography and positron emission tomography (PET) ligands. Receptor autoradiography performed with [125I]1 and [125I]2 on rodent brain slices provided the first small molecule radioligand images of the OTR and V1aR. Biodistribution studies determined [125I]1 and [125I]2 were adequate for in vivo peripheral investigations, but not for central investigations due to low uptake within the brain. A biodistribution study with [18F]3 suggested brain uptake occurred slowly over time. PET imaging studies with [18F]3 and [11C]4 using a rat model provided insufficient uptake in the brain over a 90 and 45 min scan times respectively to merit further investigations in non-human primates.
Keywords: Oxytocin, Vasopressin, Receptors, Iodine-125, Autoradiography
1. Introduction
Investigations of the physiology of oxytocin (OT) and vasopressin (AVP) as neurotransmitters or neuromodulators in the central nervous system (CNS) via their respective receptors in specific areas of the brain has led to conclusive evidence implicating these peptide hormones as modulators of social behaviors ranging from maternal attachment to aggression. Furthermore, the OT system has been proposed as a potential therapeutic target for enhancing social functioning in autism spectrum disorders.1,2 The application of receptor autoradiography for the in vitro localization and quantification of brain tissue receptor densities has been a valuable experimental technique in exploring the mechanisms by which these peptides affect behavior.3–7 Autoradiographic studies investigating the oxytocin receptor (OTR) and the vasopressin 1a receptor (V1aR) densities have most commonly been conducted using the radiolabeled peptides [125I]-ornithine vasotocin (125I-OVTA) and [125I]-linear vasopressin (125I-LVA), respectively. These radiolabeled peptides have proven useful in the distinction of the respective OTR and V1aR densities in rodents, providing high signal to noise ratios; however the selectivity of the peptide radiotracers has not always been sufficient for distinguishing the densities of homological receptors in other mammalian species, specifically non-human primates and humans.8–10 Due to the variation in the selectivity for the respective receptors across species, we thought it would be useful to develop an alternative radioligand to the labeled peptides that are currently available for investigations. Furthermore, reliable radioligands for in vivo PET neuroimaging are not yet available for OTR or V1aR. In order to make progress toward more accurate localization techniques for the OT and AVP receptor systems in primates, this study aims to synthesize and characterize novel molecules with high affinity and binding selectivity to primate OTR as well as to investigate the ability to incorporate radioactive isotopes into their structure. A non-peptide small molecule agonist or antagonist for the OTR could further be developed into a potential PET imaging tracer, a primate-selective radioligand for receptor autoradiography, or a pharmacological tool to manipulate the OT system uniquely designed for use in primates. The development of tools such as these could be used to finally elucidate the neuroanatomical distribution of OTR and V1aR in primate brain and to determine whether compromised OTR expression is associated with psychiatric disorders characterized by deficits in social behavior, such as autism. We report here the synthesis and radiolabeling of four compounds bearing the desired characterizations herein described, their biological evaluation in both rodent and human OT systems, and PET imaging studies using rodent models. In order to identify a suitable structure for labeling, our search led us to modify the structure of a molecule developed by Merck Research Laboratories which was derived from a vasopressin receptor binding ligand discovered in a screen by Otsuka Pharmaceuticals, 1-(1-(2-(4-(1-(methylsulfonyl)piperidin-4-yloxy)-2-(2,2,2-trifluoroethoxy)phenyl)acetyl)piperidin-4-yl)-3, 4-dihydroquinolin-2(1H)-one (5), Figure 1.11,12 Having fluorine atoms in a location suitable for generating a labeling precursor and having high potency and selectivity for the human OTR over all vasopressin receptor subtypes, the structural and biological properties of 5 were favorable for our purpose. Although 5 was labeled and investigated using S-35, the methodology and expenses involved with production of [35S] methane sulfonyl chloride were not appealing for receptor autoradiographic studies.13 Our target structures, (E)-1-(1-(2-(2-(3-iodoallyloxy)-4-(1-(methylsulfonyl) piperidin-4-yloxy)phenyl)acetyl)piperidin-4-yl)-3,4-dihydroquinolin-2(1H)-one (1), (Z)-1-(1-(2-(2-(3-iodoallyloxy)-4-(1-(methylsulfonyl)piperidin-4-yloxy)phenyl)acetyl)piperidin-4-yl)-3,4-dihydroquinolin-2(1H)-one (2), 1-(4-(3,4-dihydroquinolin-1(2H)-yl) piperidin-1-yl)-2-(2-(2-fluoroethoxy)-4-((1-(methylsulfonyl)piperidin-4-yl)oxy)phenyl)ethanone (3), and 1-(1-(2-(2-methoxy-4-((1-(methylsulfonyl)piperidin-4yl)oxy)phenyl)acetyl)piperidin-4-yl)-3, 4-dihydroquinolin-2(1H)-one (4) are shown in Figure 1. The approach to our investigation was simplified by making modifications only to the trifluoroethoxy chain in order to minimize changes in the previously reported biological properties of 5. The goal was to make a more practical target in which I-125 or F-18 could be incorporated directly from the commercially available [125I]-sodium iodide or cyclotron produced F-18 using SN2 substitution techniques. We included the E and Z iodopropenyl moieties in our targets to mimic the trifluoroethoxy side chain, but enable the incorporation of the I-125 isotope more suitable for autoradiography. Additionally, if 1 or 2 proved to be viable candidates for PET studies, the positron emitting I-124 isotope could be incorporated using the same synthetic pathway. The differences in electronegativity and molecular weight (the iodopropenyl moiety has a molecular weight double that of the trifluoroethoxy group) are the main variables in their structure activity relationships. To generate our first selective PET ligand for investigation of the OTR, we eliminated two of the fluorine atoms in the trifluoroethoxy chain of 5 to give our candidate ligand 3. Having only a single fluorine atom reduces the bulk of the side chain and reduces the electronegativity of 5, but it also eliminates the possibility for isotopic exchange of fluorine atoms during an F-18 radiolabeling—thus preserving the likelihood of desired high specific activity. Additionally, the reduction of electronegative pull on the side chain would reduce the inductive polarization of the side chain, thus strengthening its O–C bond. Nevertheless, a potential method for generating [18F]5 is theoretically possible by generating a 1,1-difluoropropoxy moiety and following methods outlined by Riss et al., but it was anticipated that the reduction of molecular weight involved in eliminating the two fluorine atoms increased the potential of 4 to breach the blood–brain barrier.14 To investigate a side chain moiety with a much lower molecular weight, we chose to investigate the methoxy side chain due to its ability to incorporate a [11C]methyl group via [11C]iodomethane. We anticipated the reduction in molecular weight and bulk might make 4 the best candidate of this family of compounds to breach the blood–brain barrier.
Figure 1.

Structures of synthetic targets 1–4 and previously reported compound 5.
In addition to the synthesis of 1–4 and their radioactive derivatives, we report in vitro competitive binding assay results in which 1–4 were used in competition with 125I-OVTA and 125I-LVA using prairie vole brain sections. We also include competitive binding assay results derived from cell lines expressing the human OTR and V1aR courtesy of Bryan Roth et al. The first small molecule receptor autoradiography images of the OTR and V1aR were generated from [125I]1 and [125I]2 using prairie vole brain slices and are presented in direct comparison to the images generated with 125I-OVTA and 125I-LVA. We report the lipophilicity of all radiligands and in vivo biodistribution results of [125I]1, [125I]2, and [18F]3. Finally, we report image data generated with [18F]3 and [11C ]4 in a PET scan using a rat model.
2. Materials and methods
2.1. General
All reagents used for experiments were obtained from commercially available sources unless otherwise noted. Solvents used for reactions were obtained from either Aldrich or EMD Chemicals Inc. Solvents used for chromatography were obtained from VWR. 1H and 13C NMR were recorded on a Varian spectrometer at 300 or 400 MHz and referenced to solvent or internal TMS standard. Mass spectra were determined on a JEOL JMS-SX102/SX102 double focusing mass spectrometer using electrospray ionization (ESI). Silica gel column chromatography was performed using Whatman’s Purasil 60A Silica gel (230–400 mesh). Thin layer chromatography was performed using 250 μm layers of F254 silica on alumina plates obtained from EMD Chemicals Inc. Unless described otherwise, analytical HPLC retention times were determined on a Novapak 4 μm C-18 column measuring 3.9 × 150 mm on a Waters pump and 2487 UV detector set at 254 nm using a solvent system A (50:50:0.1 ethanol:water:triethylamine) or solvent system B (70:30:0.1 methanol:water:triethylamine). Radiochemical purity was determined on a Bioscan AR-2000 radio-TLC for I-125 compounds or a Waters HPLC equipped with UV and SAT/IN radioactivity detector module for C-11 and F-18 compounds. Both F-18 and C-11 were obtained from a Siemens Eclipse 111 cyclotron after proton beam bombardment of the respective O-18 or N-14 targets. MicroPET images were obtained using a Siemens Inveon DPET scanner with a cobalt-57 source for attenuation correction. Scans were performed in a 12.5 cm field of view starting with the nose of the rodent. A 7 min transmission scan was performed with the cobalt-57 source prior to the emission scans. Scan times were 90 min for [18F]3 and 45 min for [11C ]4. Further details of the Inveon scanner are as published by Bao et al.15
All animal experiments were carried out according to protocols approved by the Institutional Animal Care and Use Committee (IACUC) and Environmental Health and Safety Office of Emory University.
2.2. Synthesis and radiolabeling
The synthesis methodology of the target compounds, their radiolabeled analogues, and precursors are reported in the following procedures.
2.2.1. tert-Butyl 4-(4-acetyl-3-hydroxyphenoxy)piperidine-1-carboxylate (7)
To a triple neck flask was added 2,4-dihydroxyacetophenone, 6 (2.73 g, 17.9 mmol), triphenylphosphine (7.05 g, 26.9 mmol), and 60 ml of tetrahydrofuran (THF). The flask was equipped with an addition funnel and a premixed solution of diethyl azodicarboxylate (DEAD) (40% by weight in Toluene, 11.7 g, 26.9 mmol) and 4-hydroxypiperidinecarboxylate in 40 ml THF was transferred to the addition funnel via cannula. The flask was cooled to 0 °C and the DEAD—triphenylphosphine mixture was added dropwise over a period of 2 h. After addition of the mixture was complete, the addition funnel was rinsed with 5 ml THF which was added to the stirring mixture immediately. The mixture was allowed to warm to room temperature and stir for an additional 18 h. The solvents were removed under reduced pressure and high vacuum. The solid residue was suspended in ether to separate triphenylphosphine oxide. The solid triphenylphosphine oxide was filtered and the filtrate was concentrated. The residue was dissolved in a minimal amount of DCM and added to a silica gel column (40 mm in diameter and 310 mm in height) packed with hexanes. The product was eluted via a gradient of hexanes, 8:1 hexanes: EtOAc, and 4:1 Hexanes: EtOAc. Fractions containing product were concentrated to give 4.91 g (77%) of a white solid. 1H NMR (CDCl3) δ 7.63 (d, J = 8.8 Hz, 1H), 6.45–6.39 (m, 2H), 4.56–4.49 (m, 1H), 3.73–3.65 (m, 2H), 3.38–3.30 (m, 2H) 2.55 (s, 3H), 1.99–1.89 (m, 2H), 1.78–1.70 (m, 2H), 1.46 (s, 9H); 13C NMR (CDCl3) δ 202.7, 165.3, 164.0, 155.0, 132.7, 114.1, 108.9, 102.3, 80.0, 72.6, 40.7, 30.5, 28.6, 26.4.
2.2.2. tert-Butyl 4-(4-acetyl-3-(methoxymethoxy)phenoxy) piperidine-1-carboxylate (8)
Compound 7 (0.23 g, 0.7 mmol) was added to a round bottom flask with cesium carbonate (0.44 g, 1.5 mmol) and 3 ml of N,N-dimethylformamide (DMF). Chloromethyl methyl ether (0.1 ml, 1.5 mmol) was then added dropwise at room temperature while stirring. The reaction stirred for 16 h under argon at room temperature. The DMF was then removed under high vacuum and the residue was extracted into EtOAc (100 ml) and washed with water (100 ml) and brine (100 ml). The organic layer was dried over anhydrous magnesium sulfate, filtered, and concentrated. The residual solid was dissolved in a minimal amount of EtOAc and added to a silica gel column (25 mm in diameter and 255 mm in height) packed with hexanes. The product was eluted via a gradient of hexanes, 4:1 hexanes: EtOAc, 1:1 hexanes: EtOAc. The fractions containing product were concentrated to give 0.21 g (82%) of a white solid. 1H NMR (CDCl3) δ 7.71 (d, J = 8.8 Hz, 1H), 6.64 (d, J = 2.0 Hz 1H), 6.50 (dd, J = 8.8, 2.4 Hz, 1H), 5.20 (s, 2H), 4.50–4.46 (m, 1H), 3.63–3.57 (m, 2H), 3.44 (s, 3H), 3.34–3.27 (m, 2H), 2.52 (s, 3H), 1.88–1.83 (m, 2H), 1.72–1.66 (m, 2H), 1.39 (s, 9H); 13C NMR (CDCl3) δ 197.5, 162.0, 158.7, 154.7, 132.4, 121.6, 107.9, 102.6, 94.4, 79.6, 72.1, 56.4, 31.7, 30.3, 28.4; HRMS (ESI) m/z 402.1892 (MNa+ [C20H29NO6Na] = 402.1887).
2.2.3. 2-(4-(1-(tert-Butoxycarbonyl)piperidin-4-yloxy)-2-(methoxymethoxy)phenyl)acetic acid (9)
Compound 8 (5.53 g, 14.6 mmol) and sulfur (0.7 g, 21.9 mmol) were added to a round bottom flask with 22 ml of morpholine. The flask was equipped with a reflux condenser and heated to 135–140 °C for 5 h. The excess morpholine was removed under high vacuum. The residue was dissolved in a minimal amount of dichloromethane and added to a silica gel column (40 mm in diameter and 300 mm in height) packed with hexanes. The unreacted starting material was separated from the intermediate product via a gradient elution of hexanes, 2:1 hexanes: EtOAc, and 1:1 hexanes: EtOAc. The fractions containing unreacted product were concentrated and subjected to morpholine addition and separation again. The combined intermediate product fractions were concentrated and then dissolved in methanol (75 ml) and 2 N NaOH (75 ml). The mixture was heated to reflux for 24 h. The methanol was then evaporated under reduced pressure and the product was extracted into dichloromethane (150 ml × 2) and washed with water (150 ml × 2). The organic layer was dried over anhydrous magnesium sulfate, filtered, and concentrated to give 3.0 g (53%) of product having purity adequate enough for the next step in the synthesis. 1H NMR (CDCl3) δ 7.08 (d, J = 8.4 Hz, 1H), 6.70 (d, J = 2.1 Hz, 1H), 6.51 (dd, J = 8.4, 2.4 Hz, 1H), 5.16 (s, 2H), 4.47–4.40 (m, 1H), 3.70–3.61 (m, 4H), 3.44 (s, 3H), 3.92–3.31 (m, 2H), 1.93–1.86 (m, 2H), 1.79–1.68 (m, 2H), 1.47 (s, 9H); 13C NMR (CDCl3) δ 177.6, 158.1, 156.4, 155.1, 131.5, 115.8, 108.2, 103.5, 94.5, 79.9, 72.3, 56.3, 35.4, 30.7, 28.7; HRMS (ESI–negative mode) m/z 394.1880 (M+ [C20H28NO7] = 394.1871).
2.2.4. tert-Butyl 4-(3-(methoxymethoxy)-4-(2-oxo-2-(4-(2-oxo-3,4-dihydroquinolin-1(2H)-yl)piperidin-1-yl)ethyl)phenoxy) piperidine-1-carboxylate (11)
To a round bottom flask was mixed 1-hydroxybenzotriazole hydrate (0.26 g, 1.9 mmol), compound 9 (0.75 g, 1.9 mmol), quinolinone 10 (0.51 g, 1.9 mmol), 1-ethyl-3-(dimethylaminopropyl) carbodiimide hydrochloride (0.58 g, 3.1 mmol) and DMF (10 ml). To the stirring mixture was added diisopropylethylamine (0.63 ml, 3.6 mmol). The mixture stirred for 19 h at room temperature under argon. The DMF was removed under high vacuum and the residue was extracted into EtOAc (125 ml). The organic layer was washed with water (100 ml) and dried over anhydrous magnesium sulfate, filtered, and concentrated. The residue was dissolved in a minimal amount of EtOAc and added to a silica gel column (63 mm in diameter and 178 mm in height) packed with EtOAc. The product was eluted with EtOAc. Fractions containing product were concentrated to give 1.1 g of a white solid (80%). 1H NMR (CDCl3) δ 7.18–7.15 (om, 3H), 7.03–6.96 (om, 2H), 6.69 (d, J = 2.4 Hz, 1H), 6.56 (dd, J = 8.4, 2.4 Hz, 1H), 5.19 (s, 2H), 4.82 (br d, J ~11.7 Hz, 1H), 4.54–4.38 (m, 2H), 4.05 (br d, J ~12.6 Hz, 1H), 3.73–3.62 (m, 4H), 3.46 (s, 3H), 3.36–3.28 (m, 2H), 3.06 (br t, J ~11.4 Hz, 1H), 2.83–2.79 (om, 2H), 2.68–2.29 (om, 5H),1.93–1.84 (m, 2H), 1.77–1.67 (m, 4H), 1.47 (s, 9H); 13C NMR (CDCl3) δ 171.8, 170.4, 157.5, 155.6, 155.1, 140.3, 130.6, 128.9, 128.1, 127.3, 123.5, 117.2, 116.6, 108.6, 103.7, 94.8, 79.8, 72.4, 56.4, 55.5, 46.2, 42.4, 40.8, 34.3, 33.7, 30.7, 28.7, 25.9; HRMS (ESI) m/z 608.3338 (MH+ [C34H46N3O7] = 608.3330).
2.2.5. 1-(1-(2-(2-Hydroxy-4-(piperidin-4-yloxy)phenyl)acetyl) piperidin-4-yl)-3,4-dihydroquinolin-2(1H)-one hydrochloride (12)
Compound 11 (0.75 g, 1.2 mmol) was dissolved in DCM (~3 ml) and 5 ml of 1 M HCl in ether was added while stirring rapidly. The reaction was allowed to stir at room temperature for 12 h under argon. The solvents were removed and 20 ml of ether was added back into the flask. The flask was sealed under argon and placed in a −20 °C freezer for 4 h. The solid was filtered and rinsed with ice cold ether and then dried under high vacuum and mild heat to give a tan solid (quantitative yield). 1H NMR (CDCl3) δ 9.84 (br s, 1H), 7.20–7.15 (om, 3H), 7.04–6.98 (om, 2H), 6.96–6.91 (om, 2H), 6.59 (d, J = 2.1 Hz, 1H), 6.39 (dd, J = 8.7, 2.7 Hz, 1H), 4.77 (br d, J = 13.5 Hz, 1H), 4.45–4.40 (m, 2H), 4.28, (br d, J = 14.4 Hz, 1H), 3.73 (s, 2H), 3.24–3.17 (m, 2H), 2.95–2.8 (om, 5H), 2.7–2.5 (om, 5H), 2.10–2.05 (m, 2H), 1.91–1.79 (m, 4H); 13C NMR (CDCl3) δ 171.9, 158.4, 158.0, 140.2, 131.1, 128.9, 128.2, 127.4, 123.6, 116.4, 113.7, 108.5, 105.4, 55.2, 47.2, 42.8, 42.1, 36.1, 33.7, 30.0, 29.5, 28.5, and 25.9; HRMS (ESI) m/z 464.2548 (MH+ [C27H34N3O4] = 464.2544).
2.2.6. 1-(1-(2-(2-Hydroxy-4-(1-(methylsulfonyl)piperidin-4-yloxy)phenyl)acetyl)piperidin-4-yl)-3,4-dihydroquinolin-2(1H)-one (13)
To a stirring solution of compound 12 (0.44 g, 0.9 mmol) and triethylamine (0.14 ml, 1.1 mmol) in anhydrous DCM (200 ml) at room temperature was added methane sulfonyl chloride (69 μl, 0.9 mmol). The reaction stirred for 14 h at room temperature and a TLC in 100% EtOAc showed one product spot (Rf = 0.45) and a spot at the origin. The mixture was poured directly onto a column containing a plug of silica gel, rinsed with 100 ml DCM, and then product was eluted with 250 ml EtOAc. Fractions containing product were combined and concentrated to give 0.25 g of a white solid (51%). 1H NMR (CDCl3) δ 9.98 (br s, 1H), 7.18–7.13 (om, 2H), 7.00 (t, J = 7.5 Hz, 1H), 6.92 (dd, J = 8.1, 2.7 Hz, 2H), 6.57 (d, J = 2.4 Hz, 1H), 6.39 (dd, J = 8.4, 2.4 Hz, 1H), 4.77 (br d, J ~13.8 Hz, 1H), 4.50–4.37 (om, 2H), 4.28 (br d, J ~13.8 Hz, 1H), 3.73 (s, 2H), 3.40–3.21 (om, 5H), 2.81(s, om, 5H), 2.72–2.46 (om, 5H), 2.02–1.97 (m, 4H), 1.90–1.78 (m, 2H); 13C NMR (CDCl3) δ 172.0, 171.9, 158.5, 157.9, 140.2, 131.1, 128.9, 128.2, 127.4, 123.6, 116.3, 113.8, 108.4, 105.7, 70.1, 55.3, 47.3, 42.8, 42.5, 36.1, 34.9, 33.7, 30.0, 29.5, 28.4, 28.9; HRMS (ESI) m/z 542.2325 (MH+ [C28H36O6N3S] = 542.2319) m/z 564.2144 (MNa+ [C28H35O6N3NaS] = 564.2139).
2.2.7. (E)-1-(1-(2-(4-(1-(Methylsulfonyl)piperidin-4-yloxy)-2-(3-(tributylstannyl)allyloxy)phenyl)acetyl)piperidin-4-yl)-3,4-dihydroquinolin-2(1H)-one (14a)
Compound 13 (25 mg, 5 × 10⁻² mmol), (E)-tributyl(3-chloro-prop-1-enyl)stannane (34 mg, 9 × 10⁻² mmol), and cesium carbonate (30 mg, 9 × 10⁻² mmol) were mixed in 1 ml DMF. The mixture was stirred for 19 h at room temperature. The mixture was then poured into a separatory funnel and extracted into EtOAc (2 × 25 ml), washing each extraction with 25 ml of water three times. The organic layer was dried over magnesium sulfate, filtered, and concentrated. The residue was dissolved in a minimal amount of DCM and added to a silica sep-pak plus cartridge. The cartridge was rinsed with 12 ml of DCM and the product was then eluted with EtOAc. The fractions containing product were concentrated to give 38 mg (95%) of a tan waxy solid. 1H NMR (CDCl3) δ 7.27–7.15 (om, 3H), 7.03–6.96 (om, 2H), 6.74 (dt, Jd = 12.9 Hz, Jt = 6.3 Hz, 1H), 6.52 (dd, J = 9.0, 2.1 Hz, 1H), 6.42 (d, J = 2.1 Hz 1H), 6.24 (d, J = 12.9 Hz, 1H), 4.82 (br d, ~11 Hz, 1H), 4.52–4.38 (d, om, J = 6.3 Hz, 4H), 4.05 (br d, J ~13.5 Hz, 1H), 3.69 (AB q, J = 15.6 Hz, 2H), 3.34 (t, J = 5.4 Hz, 4H), 3.03 (br t, J ~12 Hz, 1H), 2.81 (s, om, 5H), 2.66–2.41 (om, 4H), 2.29 (dq, Jq = 12.9 Hz, Jd = 4.2 Hz, 1H), 2.09–1.94 (m, 4H), 1.72 (br t, J ~13 Hz, 2H), 1.55–1.4 (m, 6H), 1.28 (sxt, J = 7.5 Hz, 6H), 0.94 (t, J = 7.8 Hz, 6H), 0.867 (t, J = 7.2 Hz, 9H); 13C NMR (CDCl3) δ 171.8, 170.5, 157.1, 156.8, 142.9, 140.2, 134.7, 130.6, 128.9, 128.1, 127.2, 123.4, 117.2, 116.6, 107.1, 102.9, 101.7, 71.7, 70.46, 55.5, 46.3, 42.5, 42.3, 34.9, 33.9, 33.6, 30.1, 29.4, 29.3, 28.7, 25.9, 13.9, 10.5; HRMS (ESI) m/z 872.3692 (MH+ [C43H66N3O6SSn] = 872.3689)
2.2.8. (Z)-1-(1-(2-(4-(1-(Methylsulfonyl)piperidin-4-yloxy)-2-(3-(tributylstannyl)allyloxy)phenyl)acetyl)piperidin-4-yl)-3,4-dihydroquinolin-2(1H)-one (14b)
The procedure was identical to that described above for compound 14a except (Z)-tributyl(3-chloroprop-1-enyl)stannane was used to give 97% of a waxy solid. 1H NMR (CDCl3) δ 7.24–7.15 (om, 3H), 7.02–6.95 (om, 2H), 6.52 (dd, J = 8.4, 2.4 Hz, 1H), 6.44 (d, J = 2.4 Hz, 1H), 6.33 (d, J = 19.2 Hz, 1H), 6.14 (dt, Jd = 19.2 Hz, Jt = 4.5 Hz, 1H), 4.83 (br d, J ~11 Hz, 1H), 4.54 (d, J = 4.2 Hz, 2H), 4.50–4.38 (om, 2H), 4.07 (br d, J ~13 Hz, 1H), 3.73 (AB q, J = 15 Hz, 2H), 3.34 (t, J = 5.4 Hz, 4H), 3.03 (br t, J ~12 Hz, 1H), 2.81 (s, om, 5H), 2.62 (br t, J ~12 Hz, 1H), 2.57–2.46 (om, 3H), 2.29 (dq, Jq = 12.0 Hz, Jd = 3.6 Hz, 1H), 2.05–1.96 (m, 4H), 1.72 (br t, J ~14 Hz, 2H), 1.54–1.38 (m, 6H), 1.29 (sxt, J = 7.5 Hz, 6H), 1.01–0.79 (om, 15H); 13C NMR (CDCl3) δ 171.7, 170.5, 157.1, 156.8, 142.5, 140.2, 132.2, 130.5, 128.9, 128.1, 127.2, 123.4, 117.1, 116.5, 107.1, 101.8, 71.8, 70.3, 55.5, 46.3, 42.5, 42.3, 34.9, 33.9, 33.6, 30.1, 29.4, 29.2, 28.7, 27.4, 25.9, 13.9, 9.7; HRMS (ESI) m/z 872.3691 (MH+ [C43H66N3O6SSn] = 872.3689).
2.2.9. 2-(5-((1-(Methylsulfonyl)piperidin-4-yl)oxy)-2-(2-oxo-2-(4-(2-oxo-3,4-dihydroquinolin-1(2H)-yl)piperidin-1-yl)ethyl) phenoxy)ethyl 4-methylbenzenesulfonate (15)
Compound 13 (37 mg, 7 × 10⁻² mmol), cesium carbonate (46 mg, 0.14 mmol), and ethane-1,2-diyl bis(4-methylbenzenesulfonate) (51 mg, 0.14 mmol) were mixed in 1.5 ml DMF under argon. The mixture stirred for 16 h at room temperature. The DMF was then removed under high vacuum at 70 °C. The residue was dissolved in DCM and water (20 ml) and product was extracted into DCM (2 × 20 ml). The organic layer was dried over magnesium sulfate, filtered, and concentrated. The residue was dissolved in a minimal amount of DCM and added to a silica sep-pak plus cartridge. The cartridge was rinsed with 25 ml of DCM and the product was then eluted with EtOAc. The fractions containing product were concentrated to give 35 mg (70%) of a tan solid. 1H NMR (CDCl3) δ 7.79 (d, J = 8.4 Hz, 2H), 7.35 (d, J = 7.8, 2H), 7.23–7.14 (m, 3H), 7.02–6.97 (om, 2H), 6.53 (dd, J = 8.5, 2.1 Hz, 1H), 6.38 (d, J = 2.1 Hz, 1H), 4.79 (br d, J = 11.7, 1H), 4.48–4.46 (m, 1H), 4.37–4.30 (om, 3H), 4.16 (t, J = 4.3 Hz), 4.01 (br d, J = 15.3 Hz, 1H), 3.60 (AB q, J = 15.9 Hz, 2H), 3.49–3.31 (om, 4H), 3.04 (br t, J = 12.9 Hz, 1H), 2.83–2.66 (om, 5H), 2.62–2.48 (om, 4H), 2.44 (s, 3H), 2.39–2.27 (m, 1H), 2.04–1.92 (om, 4H), 1.72 (br t, J = 12.9 Hz, 2H); 13C NMR (CDCl3) δ 171.7, 170.1, 157.1, 156.3, 145.4, 140.5, 133.0, 131.1, 130.2, 128.8, 128.1, 127.3, 123.4, 117.6, 116.5, 107.8, 101.7, 70.5, 68.3, 66.3, 55.9, 46.2, 42.5, 42.3, 35.0, 33.8, 30.1, 29.3, 28.7, 26.0, 21.9; HRMS (ESI) m/z 778.22491 (MK+ = [C47H45N3O9KS2] = 778.22288).
2.2.10. (E)-1-(1-(2-(2-(3-Iodoallyloxy)-4-(1-(methylsulfonyl) piperidin-4-yloxy)phenyl)acetyl)piperidin-4-yl)-3,4-dihydroquinolin-2(1H)-one (1)
Compound 14a (40 mg, 5 × 10⁻² mmol) was dissolved in 10 ml anhydrous DCM under argon. Iodine (12 mg, 5 × 10⁻² mmol) was added and the mixture was purged with argon and stirred for 2 h at room temperature. The mixture was diluted with 15 ml of DCM and quenched with 10% aqueous sodium thiosulfate. The organic layer was separated and dried over anhydrous magnesium sulfate, filtered, and concentrated. The residue was dissolved in a minimal amount of DCM and added to a Waters silica Sep-Pak plus cartridge (WAT051900) previously treated with 5 ml DCM. The cartridge was rinsed with 12 ml of DCM and the product was then eluted with EtOAc. The concentrated fractions produced 27 mg (83%) of a yellow solid. 1H NMR (CDCl3) δ 7.23–7.17 (m, 3H), 7.04–7.00 (m, 2H), 6.75 (dt, Jd = 15 Hz, Jt = 5.1 Hz, 1H), 6.55–6.50 (m, 2H), 6.41 (d, J = 2.4 Hz, 1H), 4.82 (br d, J = 11.1 Hz, 1H), 4.52–4.64 (m, 3H), 4.43–4.35 (m, 1H), 4.05 (br d, J = 14.4 Hz, 1H), 3.68 (AB q, J = 15.6 Hz, 2H), 3.40–3.34 (m, 4H), 3.08 (br t, J = 12.6, 1H), 2.85–2.80 (m, 5H), 2.69–2.33 (m, 5H), 2.03–1.99 (m, 4H), 1.75 (br t, J = 15.9 Hz, 2H); 13C NMR (CDCl3) δ 171.8, 170.0, 157.2, 156.4, 140.6, 140.4, 131.1, 128.9, 128.1, 127.3, 123.4, 117.5, 116.4, 107.4, 101.8, 79.9, 70.4, 70.1, 55.8, 46.3, 42.5, 35.0, 34.2, 33.7, 30.1, 29.5, 28.8, 26.0; HRMS (ESI) m/z 708.1605 (MH+ [C31H39I-N3O6S] = 708.1599); HPLC retention time = 6.65 (solvent system A); Anal. Calcd for C31H38IN3O6S: C, 52.62; H, 5.41; N, 5.94. Found: C, 53.47; H, 5.88; N, 5.63.
2.2.11. (Z)-1-(1-(2-(2-(3-Iodoallyloxy)-4-(1-(methylsulfonyl) piperidin-4-yloxy)phenyl)acetyl)piperidin-4-yl)-3,4-dihydroquinolin-2(1H)-one (2)
Compound 14b (20 mg, 2 × 10⁻² mmol), sodium iodide (11 mg, excess), and 3 ml ethanol were mixed in air. Hydrogen peroxide (85 μl of 3% weight aqueous solution) was then added while stirring. The mixture stirred at room temperature for 3 h and was then stopped with 10% aqueous sodium thiosulfate. The mixture was then diluted with 30 ml DCM and washed with 30 ml of water and 30 ml of brine. The organic layer was dried over anhydrous magnesium sulfate, filtered, and concentrated. The residue was dissolved in a minimal amount of DCM and added to a Waters silica Sep-Pak plus cartridge (WAT051900) previously treated with 5 ml DCM. The cartridge was rinsed with 12 ml of DCM and the product was then eluted with EtOAc. The concentrated fractions produced 15 mg (94%) of a yellow solid. 1H NMR (CDCl3) δ 7.22–7.15 (m, 3H), 7.02–6.97 (m, 2H), 6.62–6.49 (m, 3H), 6.42 (d, J = 2.4 Hz, 1H), 4.81 (br d, J = 11.1 Hz, 1H), 4.52 (quin, J = 4.35 Hz, 1H), 4.37 (tt, J = 12 Hz, J = 3.9 Hz, 1H), 4.04 (br d, J = 11.7 Hz, 1H), 3.67 (AB q, J = 15 Hz, 2 H), 3.39–3.28 (m, 4H), 3.05 (td, J = 13.5 Hz, J = 2.4 Hz, 1H), 2.81–2.78 (m, 5H), 2.66–2.47 (m, 4H), 2.37 (qd, J = 12.9, J = 3.6, 1H), 2.04–1.97 (m, 4H), 1.72 (br t, J = 14.4 Hz, 2H); 13C NMR (CDCl3) δ 171.8, 170.2, 157.2, 156.5, 140.4, 137.3, 131.0, 128.9, 128.1, 127.3, 123.5, 117.3, 116.5, 107.7, 101.6, 84.3, 71.3, 70.4, 55.8, 46.3, 42.5, 35.0, 34.1, 33.7, 30.1, 29.5, 28.8, 26.0; HRMS (ESI) m/z 708.1590 (MH+ [C31H39I-N3O6S] = 708.1599); HPLC retention time = 6.84 min (solvent system A); Anal. Calcd for C31H38IN3O6S: C, 52.62; H, 5.41; N, 5.94. Found: C, 52.89; H, 5.69; N, 5.56.
2.2.12. 1-(4-(3,4-Dihydroquinolin-1(2H)-yl)piperidin-1-yl)-2-(2-(2-fluoroethoxy)-4-((1-(methylsulfonyl)piperidin-4-yl)oxy) phenyl)ethanone (3)
Compound 13 (69 mg, 0.13 mmol), 1-bromo-2-fluoroethane (17 μl, 0.25 mmol), and cesium carbonate (83 mg, 0.25 mmol) were mixed in 1.5 ml DMF. The mixture was stirred for 19 h at room temperature. The DMF was removed under high vacuum at 60 °C. The residue was extracted into EtOAc (2 × 25 ml), washing each extraction twice with 25 ml of water. The organic layer was dried over magnesium sulfate, filtered, and concentrated. The residue was dissolved in a minimal amount of DCM and added to a silica sep-pak plus cartridge. The cartridge was rinsed with 12 ml of DCM and the product was then eluted with EtOAc. The fractions containing product were concentrated to give 74 mg (77%) of a white solid.
1H NMR (CDCl3) δ 7.24 (d, J = 8.0 Hz, 1H), 7.21–7.15 (m, 2H), 6.55 (dd, J = 8.4, 2.4 Hz, 1H), 6.45 (d, J = 2.4 Hz, 1H), 4.83–4.80 (m, 2H), 4.70 (t, J = 3.6 Hz, 1H), 4.50 (qui, J = 3.6 Hz, 1H), 4.43–4.37 (m, 1H), 4.21 (dt, Jd = 28.4 Hz, Jt = 4 Hz, 2H), 4.11 (br d, J ~12.4 Hz, 1H), 3.71 (AB q, J ~15 Hz, 2H), 3.35 (t, J = 5.6 Hz, 4H), 3.06 (br t, J ~12 Hz, 1H), 2.82 (s, om, 5H), 2.63 (br t, J = 12.8 Hz, 1H), 2.57–2.48 (m, 3H), 2.37 (dq, Jq = 12.4 Hz, Jd = 4.4, 1H), 2.04–1.95 (m, 4H), 1.73 (br t, J = 14 Hz, 2H). 13C NMR (CDCl3) δ 171.7, 170.2, 157.2, 156.7, 140.3, 131.1, 128.8, 128.0, 127.2, 123.4, 117.6, 116.5, 107.6, 101.8, 82.8, 81.1, 70.4, 68.0, 67.8, 55.7, 46.2, 42.5, 42.3, 35.0, 33.8, 33.7, 30.1, 29.4, 28.7, 25.9. HRMS (ESI) m/z 588.25449 (MH+ [C30H39N3O6FS] = 588.25381); HPLC retention time = 2.44 min (solvent system B); Anal. Calcd for C30H38N3O6FS: C, 61.31; H, 6.52; N, 7.15. Found: C, 61.42; H, 6.51; N, 6.91.
2.2.13. 1-(1-(2-(2-Methoxy-4-((1-(methylsulfonyl)piperidin-4-yl)oxy)phenyl)acetyl)piperidin-4-yl)-3,4-dihydroquinolin-2(1H)-one (4)
To a stirring solution of compound 13 (24 mg, 5 × 10⁻² mmol) and cesium carbonate (30 mg, 9 × 10⁻² mmol) in DMF (1 ml) was added iodomethane (6 μl, 9 × 10⁻² mmol). The flask was purged with argon and sealed. The mixture was allowed to stir for 12 h at room temperature. The mixture was poured into a separatory funnel with 50 ml of EtOAc and washed 3 times with 40 ml of water. The water layers were sequentially mixed with another 50 ml of EtOAc for further extraction. The organic layer was dried over magnesium sulfate, filtered, and concentrated. The residue was dissolved in a minimal amount of EtOAc and added to a silica gel column 10 mm in diameter and 275 mm in height. The product was eluted with 75 ml of pure EtOAc followed by 25:1 EtOAc: MeOH. The fractions containing product were concentrated to give 17 mg (68%) of a white solid. 1H NMR (CDCl3) δ 7.21–7.16 (m, 3H), 7.03–6.98 (om, 2H), 6.50 (dd, J = 8.1, 2.4 Hz, 1H), 6.46 (d, J = 2.1 Hz, 1H), 4.82 (br d, J ~ 11.7, 1H), 4.52 (qui, J = 4.2 Hz, 1H), 4.45–4.37 (m, 1H), 4.06 (br d, J ~10.2 Hz, 1H), 3.82 (s, 3H), 3.67 (AB q, J ~15 Hz, 2H), 3.35 (t, J = 6 Hz, 4H), 3.06 (br t, J ~11 Hz, 1H), 2.82(s, om, 5H), 2.63 (br t, J ~12 Hz, 1H), 2.58 (om, 3H), 2.37 (dq, Jq = 12.6 Hz, Jd = 4.2 Hz, 1H), 2.06–1.98 (m, 4H), 1.73 (br t, J ~ 15 Hz, 2H). 13C NMR (CDCl3) δ 171.8, 170.3, 158.0, 157.3, 140.3, 130.8, 128.9, 128.1, 127.2, 123.5, 117.1, 116.5, 106.7, 100.6, 70.3, 55.8, 55.7, 46.3, 42.5, 42.4, 35.0, 34.0, 33.7, 30.1, 29.5, 28.8, 26.0. HRMS (ESI) m/z 546.24811 (MH+ [C29H38N3O6S] = 556.24758); HPLC retention time = 4.87 min (solvent system B); Anal. Calcd for C29H37N3O6S: C, 62.68; H, 6.71; N, 7.56. Found: C, 61.47; H, 6.69; N, 7.02.
2.2.14. (E)-1-(1-(2-(2-(3-[125I]Iodoallyloxy)-4-(1-(methylsulfonyl)piperidin-4-yloxy)phenyl)acetyl)piperidin-4-yl)-3,4-dihy droquinolin-2(1H)-one ([125I]1) and (Z)-1-(1-(2-(2-(3-[125I] Iodoallyloxy)-4-(1-(methylsulfonyl)piperidin-4-yloxy)phenyl) acetyl)piperidin-4-yl)-3,4-dihydroquinolin-2(1H)-one ([125I]2)
To a sealed vial containing no-carrier-added Na[125I]I (MDS Nordion—specific activity ~2.52 Ci/μmol) in 0.1 N sodium hydroxide (~100 μl) was equipped with a carbon filter vent. Approximately 100 μg of tributyltin precursor 14a or 14b dissolved in 0.3 ml of ethanol was then added (300 μl of a 1 mg/ml solution). In rapid succession was added an excess of 0.4 N aqueous hydrochloric acid (100 μl) and 3% hydrogen peroxide (50 μl). The carbon filter was removed from the reaction vial and it was placed on a vortex and agitated vigorously for 1 min and then allowed to proceed for 45 min at room temperature. The reaction was then quenched with aqueous sodium hydrogen sulfate (0.25 g/ml, 50 μl). The reaction mixture was drawn into a syringe containing an aqueous solution of saturated sodium bicarbonate (0.5 ml) and injected on a C18 SepPak (preconditioned with 10 ml ethanol followed by 15 ml water). The SepPak was then rinsed with 20 ml of water. The product was then eluted into sealed vials with 0.5 ml portions of ethanol (each portion was collected in a separate vial). Using 100% EtOAc as solvent, an Rf of 0.38 was observed for [125I]1 and 0.33 for [125I]2 on a radioTLC. Using a 10:1 EtOAc: Hexanes solvent system, an Rf of 0.21 was found for [125I]2. There were no radioactive side products. Radiochemical yields were 59% for [125I]1 and with of 42% for [125I]2. The product vials were then diluted to 10% ethanol with saline and used for the corresponding autoradiography and biodistribution studies.
2.2.15. 1-(4-(3,4-Dihydroquinolin-1(2H)-yl)piperidin-1-yl)-2-(2-(2-[18F]fluoroethoxy)-4-((1-(methylsulfonyl)piperidin-4-yl)oxy)phenyl)ethanone ([18F]3)
Method A
A suspension containing 2 mg of compound 13 and 10 mg of cesium carbonate in 0.5 ml DMF was added to a V-tube containing 2-[18F]fluoroethylbrosylate prepared according to previously reported methods.16,17 The mixture was heated to 110 °C in an oil bath for 40 min and then cooled in an ice bath. The crude mixture was diluted with 5 ml of HPLC mobile phase (50:50:0.1 ethanol:water:triethylamine) and purified via reverse phase HPLC on a C18 xterra prep column (25 × 100 mm). Product elution peaked at 13 min with a flow rate of 6 ml/min. Fractions containing product were diluted with twice their volume of water and loaded on a pre-rinsed C18 sep-pak via vacuum and rinsed with 25 ml of saline. Product was eluted with 1.5 ml of ethanol into a vial containing 13.5 ml saline. The resulting mixture was then transferred under argon pressure over a Millipore filter (pore size of 1.0 μm) followed by a smaller Millipore filter (pore size of 0.2 μm). An HPLC analysis (Waters, Novapak, 3.9 × 150 mm) using both a UV detector and radioactivity detector was conducted at a flow rate of 1 ml/min (70:30:0.1 methanol:water:triethylamine). The resulting analysis showed the formulated dose of [18F]3 to have radiochemical purity greater than 99%. The total synthesis time including generation of 2-[18F]fluoroethylbrosylate was 145 min. The uncorrected radiochemical yield was 2.3%.
Method B
The tosylate 15 was mixed with dried K222 18F via CPCU in acetonitrile at 110 °C for 15 min. The resulting product was transferred via argon pressure with 7 ml of HPLC mobile phase and subjected to identical purification and analytical techniques outlined in Method A. The radiochemical purity was found to be greater than 99%. The total synthesis time was 100 min after initial transfer of activity from the cyclotron. The uncorrected radiochemical yield was 19%.
2.2.16. 1-(1-(2-(2-[11C]methoxy-4-((1-(methylsulfonyl)piperi din-4-yl)oxy)phenyl)acetyl)piperidin-4-yl)-3,4-dihydroquin olin-2(1H)-one ([11C]4)
A typical trial was performed by preparing a mixture of compound 13 (1.3 mg) and tetrabutylammonium hydrogen carbonate (25 μl of a 0.075 M aq. solution) in DMF (400 μl) in a sealed 1 ml v-vial. A balloon to capture excess activity was attached to the vial and a delivery needle was submerged in the mixture. Then [11C]methyliodide was transferred from a GE methyliodide synthesis unit via helium gas and bubbled through the cooled mixture. After measuring activity trapped in the vial, the sealed vial was heated at 110 °C for 10 min. The mixture was rapidly cooled, diluted with 0.5 ml of mobile phase solution (50:50:0.1 ethanol:water:triethylamine) and subjected to HPLC purification on a C18 xterra prep column (25 × 100 mm). Product elution peaked at 8.5 min using a flow rate of 6 ml/min. Fractions containing product were diluted with twice their volume of water, loaded on a prerinsed C18 sep-pak cartridge, rinsed with 25 ml saline, and eluted with 1.5 ml ethanol into a sterile vial containing 13.5 ml saline. The resulting mixture was then transferred under argon pressure over a Millipore filter (pore size of 1.0 μm) followed by a smaller Millipore filter (pore size of 0.2 μm). An HPLC analysis (Waters, Novapak, 3.9 × 150 mm) using both a UV detector and radioactivity detector was conducted at a flow rate of 1 ml/min (70:30:0.1 methanol:water:triethylamine) retention time = 4.92 min. The resulting analysis showed the formulated dose of [11C]4 to have radiochemical purity greater than 99%. The total synthesis time from end of bombardment was 65 min. The uncorrected radiochemical yield was 6.7%.
2.3. In vitro rodent OTR and V1aR binding assays: competitive binding
Prairie vole brains were collected immediately following euthanasia and frozen on powdered dry ice. The brains were sectioned from the prefrontal cortex (PFC) through the nucleus accumbens (NAcc) and ventral pallidum (VP) in seven series at 20 μm, on a cryostat, and placed on Fisher Frost-plus slides. Slides were stored at −80 °C until used in receptor autoradiography. Autoradiography was performed as described previously with slight modifications.3,4,18,19 Brain sections of six different animals were used for each study. The brain sections were removed from −80 °C storage, allowed to thaw in air, dipped in 0.1% paraformaldehyde in PBS, pH 7.4, and rinsed twice in 50 mM Tris buffer, pH 7.4, to remove endogenous ligand. For competition studies, in order to generate a competitive displacement curve, the seven adjacent series of brain tissue sections were then incubated for 1 h in 50 pM of radioligand, either 125I-OVTA (for detecting OTR) or 125I-LVA (for detecting V1aR), with a gradient of seven different increasing concentrations of competitor (either 1 or 2). Concentrations of the unlabeled competitor included 0, 10−10, 10−9, 10−8, 10−7, 10−6, and 10−5 M. Unbound radioligand was removed by four washes in 50 mM Tris buffer plus 2% MgCl2, pH 7.4, and then dipped into dd H2O and air dried under a stream of cool air. Once dry, the slides were exposed to BioMax MR film (Kodak) for 72 h with a set of 10 125I standards (ARI 0133A from American Radiolabeled Chemicals, Inc.). Radioligand tracers 125I-OVTA and 125I-LVA were obtained from Perkin Elmer (NEX254010UC and NEX310010UC, respectively).
For the competitive binding assays, quantification of optical binding density (OBD) was conducted on the resulting autoradiogram images in the following manner using AIS software (Imaging Research, Inc.). After determining a flat field correction for luminosity levels, optical binding values from the set of standards were loaded into the software and used to generate a standard curve, from which binding density values from brain regions of interest would be extrapolated. An average OBD for each region of interest was calculated from three separate 30 × 30 pixel circular area ‘punches’ through that brain region. An area of the brain with no specific binding served as a background levels control for each individual; an average of the OBD from three separate punches in this background region was subtracted from the average value for the specific binding in the region of interest. Specifically, for the OTR autoradiograms labeled with 125I-OVTA, a final specific binding value was calculated for the PFC as our region of interest for each animal, and the primary somatosensory cortex served as the background/nonspecific binding reference point. For the V1aR autoradiograms labeled with 125I-LVA, a final specific binding value for each individual was calculated for the VP and used the caudate putamen as the background levels reference. These final values for each animal were averaged for each treatment and plotted (using GraphPad Prism software) as a logarithmic competition curve showing standard error of the mean. Prism was also used to calculate the binding affinity (Ki) values for each competitor molecule.
2.4. In vitro rodent OTR and V1aR binding assays: receptor autoradiography using [125I]1 and [125I]2
Tissue sections were prepared as described above for the competition assays and incubated in 70 pM of either radioligand, [125I]1 and [125I]2, using the same methodology described above, but without unlabeled competitors. The concentration of 70 pM was determined after repeated optimization experiments (data not shown). After incubation for 1 h in the radioligand, unbound tracer was removed with rinses and the slides were exposed to Bio-Max MR film (Kodak) for 72 h and then developed for visualization.
2.5. In vitro human OTR and vasopressin receptor binding assays: competitive binding
The binding characteristics of 1 and 2 for the human OTR and V1aR were determined by NIMH’s Psychoactive Drug Screening Program at the University of North Carolina Chapel Hill. The protocol used for the assays was adopted from a previously reported methodology and is summarized here as found on their website http://pdsp.med.unc.edu/.20 A solution of the compound to be tested was prepared as a 1-mg/ml stock in DMSO. A similar stock of a reference compound (either oxytocin or vasopressin as a positive control) was also prepared. Eleven dilutions (5× assay concentration) of the test and reference compounds were prepared in a binding buffer solution (100 mM NaCl, 10 mM MgCl2, 0.1 mg/ml bacitracin, 1 mg/ml BSA, 20 mM Tris–HCl, pH 7.4) by serial dilution: 0.05, 0.5, 1.5, 5, 15, 50, 150, 500 nM, 1.5, 5, 50 μM (thus, the corresponding assay concentrations span from 10 pM to 10 μM and include semilog points in the range where high-to-moderate affinity ligands compete with radioligand for binding sites). The radioligand ([3H]vasopressin or [3H]oxytocin) is diluted to 5 nM (five times the assay concentration) in the binding buffer solution. Aliquots (50 μl) of radioligand are dispensed into the wells of a 96-well plate containing 100 μl of binding buffer solution. Then, duplicate 50-μl aliquots of the test and reference compound dilutions are added. Crude membrane fractions of cells expressing recombinant target OTR or vasopressin receptors (either of the 3 subtypes) were prepared from 10-cm plates by harvesting PBS-rinsed monolayers, resuspending and lysing in chilled, hypotonic 50 mM Tris–HCl, pH 7.4, centrifuging at 20,000×g, decanting the supernatant and storing at −80 °C. These thawed cell lines are resuspended in 3 ml of chilled binding buffer solution and homogenized by several passages through a 26 gauge needle and 50 μl are dispensed into each well. The 250-μl reactions are incubated at room temperature and shielded from light for 1.5 h and harvested by rapid filtration onto Whatman GF/B glass fiber filters pre-soaked with 0.3% polyethyleneimine using a 96-well Brandel harverster. Four rapid 500-μl washes were performed with chilled standard binding buffer to reduce non-specific binding. Filters are placed in 6-ml scintillation tubes and allowed to dry overnight. The next day, 4 ml of EcoScint scintillation cocktail (National Diagnostics) was added to each tube. The tubes were capped, labeled, and counted by liquid scintillation counting. Raw data (dpm) representing total radioligand binding were plotted as a function of the logarithm of the molar concentration of the competitor. Non-linear regression of the normalized raw data was performed in Prism 4.0.
2.6. Lipophilicity determination
The octanol/water partition coefficient was measured via a previously reported methodology.21 Approximately 5–10 μCi of 1 or 2 were added to a separatory funnel containing 5 ml of 0.1 M sodium phosphate buffer solution (pH = 7.4) and 10 ml of octanol. After shaking for 3 min, the buffer layer was discarded and 2 ml aliquots of the remaining octanol layer were placed in separate test tubes containing 2 ml of fresh buffer. The tubes were vortexed for 7 min and then centrifuged (20,000×g) for 5 min. Samples (0.5 ml) of both the buffer and octanol layer were then transferred to separated tubes and counted on a Cobra scintillation counter. The average counts of the two layers were used to determine the logP7.4.
2.7. Rodent biodistribution studies
Tissue distributions studies were performed in female Sprague–Dawley rats (180–200 g) after intravenous injection of [125I]1, [125I]2, or [18F]3 in 0.1–0.2 ml of 10% ethanol/saline. The animals were allowed food and water ad libitum before the experiments. The animals were anesthetized with an intramuscular injection of 0.1 ml/100 g of a 1/1 ketamine (500 mg/ml)/xylazine (20 mg/ml) solution, and cannulas were placed in the tail veins. The animals were euthanized at the indicated time points of 15, 30, 60 or 120 min, tissue samples from the brain, liver, kidney, heart, lung, thyroid, muscle, uterus, and blood were taken, weighed, and counted along with dose standards in a Packard Cobra II auto-γ counter. The raw counts were decay-corrected to a standard time, and the counts were normalized as the percent of total injected dose per gram of tissue (% ID/g).
2.8. PET Imaging with [18F]3 and [11C]4
Sprague–Dawley rats were subcutaneously administered estrogen in the form of estradiol benzoate (10–12 μg in 0.2 ml sesame oil) once a day for 3 days prior to the scan dates to up-regulate the oxytocin receptor expression. On the day of imaging, the rats were anesthetized with ketamine/xylazine cocktail (100 and 10 mg/kg, respectively, via ip), affixed with a tail vein catheter, and then strapped in a prone position on a plastic board designed for the microPET. Radioligand [18F]3 (200–300 μCi) or [11C]4 (200–300 μCi) were then injected into the subject and PET imaging of the brain area was performed for 90 min ([18F]3) or 45 min ([11C]4). Three rats were scanned in this manner using [18F]3 and four rats were scanned using [11C]4. Animals were euthanized with compressed C02 following the scan.
3. Results and discussion
3.1. Synthesis of target compounds and labeling precursors
In order to obtain the target compounds 1–4 and their radiolabeled analogues, a versatile intermediate, 13, was generated to enable facile synthesis of various O-alkylated derivatives. Our applied synthetic pathway to 13 is outlined in Scheme 1. The dihydroxyacetophenone 6 was alkylated specifically to the para position using Mitsonobu conditions with a commercially available tert-butoxycarbonyl protected hydroxy piperidine to give 7. The ortho hydroxyl group was protected with MOM in DMF to give 8. The acetophenone of 8 was converted to phenyl acetic acid 9 using the Wilgerodt-Kindler reaction followed by saponification. Although this step in the synthesis afforded a modestly low yield, unreacted starting material could be recovered from the reaction. Additionally, this methodology eliminated the use of highly toxic thallium nitrate which was included in a previously reported synthetic pathway of a similar molecule.22 It should also be noted that the use of thallium nitrate was originally implemented in our synthetic pathway, but the resulting yields were extremely lower than what literature reported—including complete failures in multiple trials. Acetic acid 9 was then reacted with quinolinone 10 via condensation in the presence of hydroxybenzotriazole, 1-ethyl-3-(3-dimethylaminopropyl)carbodiimide, and Hünig’s base to give 11 in good yields. This reaction was also performed using Castro’s reagent (benzotriazole-1-yl-oxy-tris-(dimethylamino)-phosphonium hexafluorophosphate) in place of hydroxybenzotriazole and 1-ethyl-3-(3-dimethylaminopropyl)carbodiimide with similar yields. A double deprotection of 11 was then performed using 1 M HCl in ether to give the hydrochloride salt 12. The piperidine amine of 12 was selectively sulfonylated with 1 equiv of methanesulfonyl chloride by using a dilute mixture of 12 in the presence of an organic base to produce sulfonamide 13. Multiple trials were performed in attempts to optimize the addition so that it occurred specifically on the amine position and not the phenol position. An NMR analysis confirmed a side product found in the reaction to be a double sulfonylated product—suggesting O-sulfonylation as well as N-sulfonylation. Instead of using a cold, concentrated mixture and a short reaction time, it was found that using a small scale, diluting the mixture, and extending the reaction time eliminated sulfonylation on the phenol position altogether and prevented a difficult separation from the double addition side product.
Scheme 1.

Synthesis of the versatile precursor 13. Reagents and conditions: (a) DEAD, Ph3P, THF 0 °C to rt. (b) chloro(methoxy)methane, Cs2CO3, DMF, rt. (c) (1) Morpholine, sulfur, 120 °C (2) 2 N NaOH, 110 °C. (d) HOBT, EDC, DMF, rt. (e) 1 M HCl in Ether, rt. (f) Methanesulfonyl chloride, Et3N, DCM, rt.
Having synthesized phenol 13, a family of compounds could be generated bearing a similar structure as the original model compound 5 by performing a simple and efficient O-alkylation with cesium carbonate in DMF at room temperature. The versatility of 13 is featured in Scheme 2 which shows the synthetic pathway to compounds 1–4. Alkylation of the phenol with E or Z tributyl(3-chloroprop-1-enyl)stannane (synthesized according to previously reported methods) gave the tributylstannyl precursors 14a and 14b.23 Iodination was then performed on 14a successfully with iodine in DCM for generation of 1, but it was discovered through NMR analysis that the use of 14b with these conditions resulted in isomerization. Therefore, to generate 2, iodination was performed using sodium iodide in the presence of hydrogen peroxide.Figure 2a shows the stacked 1H NMR data of the iodopropenyl chemical shifts generated from 1 (top spectra), 2 (bottom spectra), and the resultant product from reacting 14b with iodine in DCM (middle spectra). The integration suggested a 50% mixture of the diastereomers. The radiosynthesis of [125I]1 and [125I]2 involved the use of sodium [125I]iodide and hydrogen peroxide, therefore this phenomenon was not a concern for radiochemical purity. Synthesis of 3, 4, and 15 were performed similarly using 1-bromo-2-fluoroethane, iodomethane, and ethane-1,2-diyl bis(4-methylbenzenesulfonate) respectively with cesium carbonate in DMF. These O-alkylation syntheses were generally allowed to stir overnight with no evidence of any side products observed. An interesting aspect found in the 1H NMR of these compounds was the restricted rotation that resulted around the methylene carbon connecting the piperidinyl amide and the benzene ring. Figure 2b shows the stacked 1H NMR data of the chemical shifts generated by the methylene hydrogen atoms of precursor 13 and O-alkylated product 3. The methylene protons of 13 become diastereotopic after O-alkylation due to the restriction of rotation; the chemical shift of 13 morphs from a singlet to form an AB quartet upon alkylation. In theory, the addition of heat would provide enough energy to enable free rotation, but experiments were not undertaken to determine the exact amount of heat. Therefore, free rotation may or may not occur in vivo with the addition of body heat. Nevertheless, to investigate if restriction of rotation played a role in potency or selectivity of our compounds, 13 was included in human cell line binding assays.
Scheme 2.

Syntheses implemented with precursor 13 to generate 1–4. (a) Cs2CO3, (E)-tributyl(3-chloroprop-1-enyl)stannane, DMF, rt for 14a (b) Cs2CO3,(Z)-tributyl(3-chloroprop-1-enyl)stannane, DMF, rt for 14b (c) I2 in DCM for 1 (d) 3% H2O2 (aq), NaI, EtOH, rt for 2. (e) Cs2CO3, 1-bromo-2-fluoroethane, DMF, rt. (f) Cs2CO3, ethane-1,2-diyl bis(4-methylbenzenesulfonate), DMF, rt. (g) Cs2CO3, iodomethane, DMF rt.
Figure 2.

Stacked NMR signals demonstrating reaction phenomenon and structural phenomenon. (a) the alkenyl hydrogen atoms of 1, 2, and the mixture of diasteriomers generated from reacting 14b with I2 in DCM. (b) the methylene hydrogen atoms (indicated by *) of 13 and 1 showing the formation of an AB quartet.
3.2. In vitro binding assays using rodent brain tissue
To investigate the selectivity of 1–4 for the OTR over V1aR as well as to determine their binding affinity for these receptors in rodents, in vitro competition assays were performed with the four compounds on prairie vole brain sections via autoradiography using a procedure similar to that previously reported.3,24 The prairie vole OTR and V1aR system was used because it has been extensively characterized and this species has been shown to express the OTR more broadly than in a rat brain. Figure 3 shows a representative set of brain images generated from co-incubating the tissue sections in seven increasing concentrations of 1 in competition for the OTR with [125I]-OVTA or in competition for V1aR with [125I]-LVA, standard radioligands used for this type of receptor autoradiography in rodents. The binding density was quantified and plotted as a competition curve that was used to determine the binding affinities for these compounds (Fig. 4A–D, Table 1). Increasing concentrations of all four ligands resulted in greater displacement of both radioligands from the respective receptors as indicated by decreased signal. Compounds 1–3 all demonstrated similar potency with Ki values around 3 nm which is adequate for their purpose. This demonstrates the viability of the iodopropoxy moiety in mimicking the function of the fluoroethyl group and vice versa. Compound 4 was not quite as potent with a Ki value of 18 nm. There are several variables that could contribute to the decrease in potency including side chain length, electronegativity, and orientation of the compound around the methylene bond (Fig. 2). We will not speculate as to which variable contributed to the change in potency as these molecules were selected for application purposes and not for determining binding affinity trends. The selectivity of 1–4 for the rodent OTR over the rodent V1aR was poor for all candidates. The best selectivity was observed with 2 and 4 which were four times more selective for the rodent OTR over V1aR, but still not adequate for distinction. For example, a multiple of at least 50 would be desirable for ensuring distinction between the receptor density patterns in vivo using PET imaging. It is important to note the lack of selectivity in rodent tissue for these compounds was anticipated due to previously reported studies in rats using the similar compound 5 as the competitor.11 We did not include the results from this previously reported data because the values determined in the study were from rat uterine OTR and used different techniques which leaves any comparisons in question.
Figure 3.

Representative set of brain images generated from competitive receptor autoradiography. Columns A and B: tissue sections were co-incubated in seven increasing concentrations of 1 in competition for the OTR with 50 pM [125I]-OVTA (A) or in competition for V1aR with 50 pM [125I]-LVA (B). Columns C and D: tissue sections were co-incubated in seven increasing concentrations of 2 in competition for the OTR with 50 pM [125I]-OVTA (C) or in competition for V1aR with 50 pM [125I]-LVA (D).
Figure 4.

Competitive binding graphs generated from varying concentrations of 1–4 in competition for OTR and V1aR on prairie vole brain slices with [125I]-OVTA and [125I]-LVA respectively. (A) Curves generated using 1. (B) Curves generated using 2. (C) Curves generated using 3. (D) Curves generated using 4.
Table 1.
In vitro Ki (nM) determinations of 1–4 and 13 in competition assays with human and rodent OTR and vasopressin receptors (3 subtypes)
| Compound | Rodenta |
Humanb |
||||
|---|---|---|---|---|---|---|
| OTR | V1aR | OTR | V1aR | V1b | V2 | |
| 1 | 3.6 | 1.7 | 10 | 7.9 × 10² | >xs1 × 104 | 1.4 × 10³ |
| 2 | 4.2 | 16 | 5.7 | 5.3 × 10² | 9.6 × 10³ | 5.8 × 10² |
| 3 | 2.9 | 9.4 | 16 | 8.7 × 10³ | >1 × 10⁴ | 1.8 × 10³ |
| 4 | 18 | 78 | 28 | 4.8 × 10³ | >1 × 10⁴ | 3.7 × 10³ |
| 13 | – | – | 78 | >1 × 10⁴ | >1 × 10⁴ | >1 × 10⁴ |
Values were determined from six sets of autoradiography data.
Ki values for human receptors were generously provided by the National Institute of Mental Health’s Psychoactive Drug Screening Program, Contract # HHSN-271-2008-00025-C (NIMH PDSP). The NIMH PDSP is Directed by Bryan L. Roth MD, PhD at the University of North Carolina at Chapel Hill and Project Officer Jamie Driscol at NIMH, Bethesda MD, USA. For experimental details please refer to the PDSP web site http://pdsp.med.unc.edu/ and click on ‘Binding Assay’ or ‘Functional Assay’ on the menu bar.
3.3. In vitro binding assay using human receptors
Our unpublished data as well as published reports indicate that the commercially available radiolabeled peptides (e.g., [125I]-OVTA and [125I]-LVA), which have been used to reliably investigate OTR and V1aR in binding assays with rodent tissues, have displayed mixed affinity for these receptors in primates. Therefore, these radiolabeled peptides have decreased utility in localizing these receptors in brain tissue from humans as well as other primate species of interest.8,25 To determine the binding characteristics of our selected compounds for the human OTR and all human vasopressin receptor subtypes (V1a, V1b, and V2), compounds 1–4 and 13 were subjected to competitive binding assays using membrane preparations from two different cell lines that have been engineered to stably express either the gene for the human OTR or the human vasopressin receptor (either of the 3 subtypes). The radioligands used for competition were [3H]-OT for OTR and [3H]-AVP for vasopressin receptors, as described by the NIMH’s Psychoactive Drug Screening Program at the University of North Carolina Chapel Hill. The competitive binding curves for the human receptor assays are shown in Figure 5A–D and the data is tabulated in Table 1. As can be seen from the charts and tables, the potency for 1–4 were not altered significantly when assaying the OTR homologues from two different species with a Ki values ranging from 5.7–28 nM. However, the potency for the human V1aR homologue was significantly diminished (Ki value range of 5.3 × 10² to 8.8 × 10³ nM), thus making these compounds selective for human OTR. There was virtually no potency observed for the V1b subtype and no significant potency for the V2 subtype with the lowest Ki value being 1.4 × 10⁻³ M for 1. Having potency of at least 79 times greater for the human OTR over all vasopressin receptor subtypes, 1–4 were all valid candidates for pursuing selective detection of human OTR in autoradiography or PET imaging studies.
Figure 5.

Curves generated from varying concentrations of 1–4 in competition with [3H]-OT and [3H]-AVP for OTR and V1aR on membrane preparations from cells stably transfected with the human OTR or V1aR gene. a(A) Curves generated using 1. (B) Curves generated using 2. (C) Curves generated using 3. (D) Curves generated using 4. aCompetitive binding plots of human receptors were generously provided by the National Institute of Mental Health’s Psychoactive Drug Screening Program, Contract # HHSN-271-2008-00025-C (NIMH PDSP). The NIMH PDSP is Directed by Bryan L. Roth MD, PhD at the University of North Carolina at Chapel Hill and Project Officer Jamie Driscol at NIMH, Bethesda MD, USA. For experimental details please refer to the PDSP web site http://pdsp.med.unc.edu/ and click on ‘Binding Assay’ or ‘Functional Assay’ on the menu bar.
Despite a lower potency for OTR, 13 displayed superior selectivity with no detectable affinity for any vasopressin receptor subtype in the human OTR assays. We investigated 13 primarily because it was a precursor in two of our radiosyntheses, but we were also curious about structure allowing free rotation around its methylene bond (Fig. 2b). In addition to free rotation, the hydroxyl group acts as a hydrogen bond donor, a structural feature which is not present in 1–4. Further structure activity studies will need to be conducted to conclude if free rotation or the hydrogen bond donor is responsible for the superior selectivity, perhaps by investigating the unsubstituted moiety.
3.4. Radiolabeling of [125I]1 and [125I]2
Both [125I]1 and [125I]2 were obtained using the same methodology (reaction A of Scheme 3). The tributylstannyl compounds 14a and 14b were treated with 125I+ for 45 min via in situ oxidation of no-carrier-added Na125I with hydrogen peroxide. Both compounds afforded their respective compounds in yields of 42% for the Z isomer and 59% for the E isomer after sep-pak purification. No attempts were made to improve these yields because ample amounts of product were generated for our purpose; a diminutive amount of [125I]1 and [125I]2 was required for autoradiography. Due to the 60 day half-life of I-125, decay correction was not applied to the yields. Radiochemical purity was high for both diastereomers at 95–96% pure as determined by radio-TLC. Thus, the use of sep-pak purification was deemed adequate for acquiring acceptable radiochemical purity. The radiolabeling was repeated a second time and a radio-HPLC became available to accommodate the contamination of the long half-life of I-125 45 days after these trials (75% of a half-life). We investigated for UV traces to estimate specific activity and purity. It should be noted that decomposition of both [125I]1 and [125I]2 was observed after being stored in the 10% ethanol in saline solution for 45 days when comparing the radio-HPLC with the radio-TLC from the day of synthesis (see supporting information). Approximately 15–20% more radioactivity was detected where sodium [125I]iodide would be expected to elute in comparison with the radio-TLC. Therefore, the shelf life is limited in this media, and [125I]1 and [125I]2 should be used as soon as possible for receptor assays following our protocol, or stored in another media. The specific activity as determined from calibration curves was found to be 408 Ci/mmol for [125I]1 and 413 Ci/ mmol for [125I]2. There were trace UV impurities found. We speculated the impurities to be residual precursor or a protodestannylated side product of the precursor. Since our procedure for radiolabeling involved the use of a small amount of hydrochloric acid to neutralize sodium hydroxide contained in the delivered Na125I, it was theoretically possible for the tin labeling precursors to undergo protodestannylation, a commonly known issue for iodination using a tin precursor.26 Although this phenomenon is more readily observed when a heated reaction mixture is required for a deprotection reaction post labeling, it was investigated further for clarification. To a 3 ml reaction mixture during an experimental trial of the synthesis of 2, 200 μl of 0.4 N HCl was added and the mixture was concentrated in vacuo to a residue. Only desired product was found when analyzed via NMR after work-up. The reaction mixture volume during the radiosynthesis of [125I]1 and [125I]2 is 300ul, and the presence of sodium hydroxide greatly reduces the actual concentration of HCl in the mixture. Therefore, we believe it was very unlikely that protodestannylation occurred during radiosynthesis and any observed UV trace from our HPLC came from the starting material. We did not investigate the potency of 14a or 14b. Due to the significant difference in retention times in UV impurity traces and [125I]1 and [125I]2, the labeled products could be separated completely from all detected trace impurities via prep-HPLC. However, to avoid a lengthy contamination of an HPLC system, a sep-pak procedure may prove to be functional, as was demonstrated by our studies. The trace impurities did not hinder the binding of [125I]1 and [125I]2 to prairie vole brain receptors during autoradiography (see Fig. 6).
Scheme 3.

Radiosynthesis of [125I]1, [125I]2, [18F]3, and [11C]4. Reagents and conditions: (A) Na125I, 3% H2O2 (aq), 0.4 N HCl, EtOH, rt. (B) 2-[18F]fluoroethylbrosylate, Cs2CO3, acetonitrile, 110C, 40 min. (C) K222 18F, Acetonitrile, 110 °C, 15 min. (D) [11C]methyliodide, tetrabutylammonium hydrogen carbonate, DMF, 100 °C, 10 min.
Figure 6.

Autoradiography images generated from [125I]1, [125I]2, [125I]-OVTA, and [125I]-LVA on prairie vole brain sections. Both [125I]1 and [125I]2 bound as expected to regions of the brain where OTR and V1aR are expressed in prairie voles. The images from [125I]-LVA and [125I]-OVTA were provided with permission by Lim et al. 2004.
3.5. Autoradiograpy with [125I]1 and [125I]2
To begin to assess the utility of [125I]1 and [125I]2 as adequate radioligands for localizing brain receptors with in vitro autoradiography, we subjected these radioligands for receptor autoradiography on brain slices from prairie voles, whose OTR and V1aR distributions are well established. Figure 6 shows the images generated from our assay demonstrating that both [125I]1 and [125I]2 bind to receptors in the NAcc and VP with a slightly lower signal to noise ratio than the peptide radioligands. It has been established previously that the NAcc in prairie voles contains a high density of OTR and the VP contains a high density of V1aR; reference images generated from [125I]-LVA (showing V1aR) and [125I]-OVTA (showing OTR) are also reproduced from images previously reported by Lim et al4 These results are consistent with our competition binding data described above and suggest the radioligands label both the prairie vole OTR and V1aR in autoradiography. Therefore, with the lower signal to noise ratio and lack of selectivity, [125I]1 and [125I]2 would not be ideal for rodent tissue autoradiography in comparison to the peptide radioligands. Nevertheless, these autoradiography images are very encouraging as they demonstrate the capability of these small molecules bind in a manner that enables distinct OTR receptor density patterns to be recognized. Therefore, based on these expected results in rodent tissue and the binding data from cell culture which shows much higher selectivity between the human OTR and human V1aR, we would predict that these compounds would preferentially bind to the OTR over the V1aR in primate tissue, thus distinguishing between the two. Additionally, we would anticipate similar patterns to be formed in vivo if these compounds were investigated via PET imaging with the positron emitting I-124 analogues and they manage to breach the blood–brain barrier (BBB). Future studies are planned to assess the utility of these ligands to selectively label OTR in primate tissue using autoradiography.
3.6. Radiolabeling of [18F]3 and [11C ]4
Reactions B and C in Scheme 3 present the two methodologies used in attaining [18F]3. The first method involved synthesis of 2-[18F]fluoroethylbrosylate according to previously reported methodologies.16,17 Alkylation of phenol 13 with 2-[18F]fluoroethylbrosylate was then conducted in DMF at 110 °C for 40 min. This method was successful in obtaining [18F]3 in high radiochemical purity and enough product to generate a human dose, the yield (2.3% uncorrected) was not ideal for routine production. Therefore, to eliminate the use of 2-[18F]fluoroethylbrosylate and make the process a one-step synthesis, 15 was subjected to SN2 substitution with K222 18F in acetonitrile at 110 C for 15 min (reaction C in Scheme 3). The result was an 8 fold improvement in yield which generated ample product for multiple studies. The radiochemical purity was more than adequate as well. There were no UV impurities found in either method as HPLC separation was efficient in both cases.
The conditions for radiolabeling [11C ]4 are outlined in reaction D of Scheme 1. Several bases were tried unsuccessfully prior to the use of tetrabutylammonium hydrogen carbonate (TBAHC). Sodium hydroxide in various molarities was found to be too harsh for 13 as decomposition was observed. Cesium carbonate did not generate adequate yields even with a brosylate leaving group and 40 min reaction time as was discussed for the synthesis of [18F]3. The 20 min half-life compounded the need to alter the conditions. The use of TBAHC as purchased from ABX was found to be mild enough to avoid decomposition of 13 and function well enough to increase the reaction time. We were able to obtain uncorrected yields of 6.7% with radiochemical purity >99% with only a 10 min reaction time. No significant UV impurities were observed.
3.7. Lipophilicity
The lipophilicity of raiolabeled analogues of 1–4 were determined in efforts to predict their ability to cross the BBB and for future reference if further structure–activity studies were needed. The optimal range of lipophilicity desired of radioligands to achieve BBB penetration has been reported to be logP7.4 = 2.0–3.5 by one source (Waterhouse) and 2.0 ± 0.7 by another (Hansch).27,28 Our measured values determined from a previously reported method are tabulated in Table 2.21 According to both Waterhouse and Hansch, 1–4 were all in optimal range for penetrating the BBB (values ranged 2.02–2.36). There are other factors that will influence the ability of these molecules to penetrate the BBB including size, hydrogen bonding donor and acceptors, functional groups, rotatable bonds, and others.29 Our primary concern with 1–4 was their size and lack of hydrogen bond donor groups. Computational studies have predicted a molecular weight below 500 should be a requirement for breaching the BBB.30 As can be seen from Table 2, 1–4 are all over 500 g/mol with 4 being the smallest at 555. We limited our investigations to of BBB permeability to calculating logP7.4 for future reference as we planned to conduct in vivo studies to further evaluate the radioactive analogues of 1–4.
Table 2.
Determined logP7.4 values and molecular weights of 1–4
| Compound | logP7.4 | MW |
|---|---|---|
| 1 | 2.36 | 707.62 |
| 2 | 2.18 | 707.62 |
| 3 | 2.02 | 587.70 |
| 4 | 2.25 | 555.69 |
3.8. Biodistribution studies
The distribution of radioactivity expressed as the mean percent of total injected dose per gram (% ID/g) of tissue in female Sprague–Dawley rats at 15, 30, 60, and 120 min after injection of either [125I]1, [125I]2, and [18F]3 is shown in Table 3a–c. The primary focus of our study was brain penetration and uptake of neural OTR. Having a measured ID/g of 0.05 ± 0.01 or less across all time points for [125I]1, [125I]2, and [18F]3, we believed our radioligands failed to penetrate into the rodent brain efficiently. Considering the expression of the OTR in the rat brain is limited, we dissected and measured specific areas of the brain known to express OTR, including the amygdala, basal hypothalamus, and dorsal striatum.31 As a comparison control, we examined the cerebellum and tabulated these results in Table 4. The remaining brain was also counted to provide the total brain uptake values in Table 3. The distribution within the brain of all the radioligands was not very evident—suggesting lack of penetration. It is possible that BBB penetration occurred rapidly, well before the first time point of 15 min and were then ejected immediately via the P-glycoprotein efflux pump, a common obstacle in developing drugs targeting the brain.32 Although it was not performed in this study, a 5 min time point would help in determining if the P-glycoprotein pump or simply lack of retention was responsible for inconsistent BBB penetration. A P-glycoprotein pump assay would also determine if our targets were susceptible, but we did not have the cell cultures readily available. We did, however, investigate this phenomenon with [18F]3 and [11C]4 via PET imaging as described in the following section.
Table 3.
Biodistribution of radioactivity in female Sprague–Dawley rats after injection of [125I]1(a), [125I]2 (b), and [18F]3 (c)a
| (a) | ||||
|---|---|---|---|---|
|
| ||||
| [125I]1 | 15 minb | 30 min | 60 min | 120 min |
| Blood | 0.58 ± 0.51 | 0.58 ± 0.07 | 0.55 ± 0.27 | 0.38 ± 0.14 |
| Heart | 0.82 ± 0.70 | 0.61 ± 0.18 | 0.54 ± 0.28 | 0.38 ± 0.06 |
| Lung | 1.86 ± 1.60 | 1.41 ± 0.72 | 1.45 ± 1.04 | 1.04 ± 0.75 |
| Liver | 5.67 ± 5.08 | 3.90 ± 0.15 | 3.09 ± 1.34 | 1.81 ± 0.30 |
| Kidney | 0.96 ± 0.84 | 0.75 ± 0.07 | 0.69 ± 0.30 | 0.42 ± 0.10 |
| Thyroidc | 0.19 ± 0.16 | 0.53 ± 0.23 | 0.81 ± 0.53 | 1.05 ± 0.70 |
| Muscle | 0.28 ± 0.24 | 0.26 ± 0.02 | 0.23 ± 0.11 | 0.14 ± 0.03 |
| Uterus | 0.43 ± 0.38 | 0.41 ± 0.07 | 0.45 ± 0.23 | 0.30 ± 0.10 |
| Brain | 0.05 ± 0.04 | 0.05 ± 0.02 | 0.04 ± 0.02 | 0.02 ± 0.01 |
| (b) | ||||
|
| ||||
| [125I]2 | ||||
| Blood | 0.22 ± 0.14 | 0.23 ± 0.23 | 0.32 ± 0.06 | 0.31 ± 0.17 |
| Heart | 0.51 ± 0.41 | 0.39 ± 0.38 | 0.39 ± 0.12 | 0.19 ± 0.09 |
| Lung | 1.79 ± 1.78 | 1.02 ± 1.13 | 0.66 ± 0.32 | 0.41 ± 0.27 |
| Liver | 2.12 ± 1.73 | 1.91 ± 1.88 | 3.01 ± 0.50 | 1.91 ± 1.02 |
| Kidney | 0.38 ± 0.20 | 0.31 ± 0.27 | 0.46 ± 0.04 | 0.29 ± 0.15 |
| Thyroidc | 0.05 ± 0.04 | 0.20 ± 0.22 | 0.32 ± 0.05 | 0.67 ± 0.56 |
| Muscle | 0.10 ± 0.09 | 0.09 ± 0.08 | 0.15 ± 0.03 | 0.10 ± 0.05 |
| Uterus | 0.22 ± 0.16 | 0.16 ± 0.16 | 0.31 ± 0.08 | 0.22 ± 0.13 |
| Brain | 0.02 ± 0.01 | 0.02 ± 0.01 | 0.02 ± 0.01 | 0.02 ± 0.01 |
| (c) | ||||
|
| ||||
| [18F]3 | ||||
| Blood | 0.07 ± 0.04 | 0.06 ± 0.01 | 0.04 ± 0.02 | 0.09 ± 0.04 |
| Heart | 0.17 ± 0.09 | 0.09 ± 0.02 | 0.07 ± 0.02 | 0.08 ± 0.02 |
| Lung | 0.39 ± 0.3 | 0.1 ± 0.03 | 0.1 ± 0.03 | 0.19 ± 0.15 |
| Liver | 1.81 ± 0.36 | 1.41 ± 0.17 | 0.98 ± 0.44 | 1.18 ± 0.18 |
| Kidney | 0.27±0.11 | 0.15 ± 0.04 | 0.08 ± 0.02 | 0.10 ± 0.02 |
| Bone | 0.05±0.01 | 0.05 ± 0.01 | 0.03 ± 0.01 | 0.07 ± 0.04 |
| Muscle | 0.07 ± 0.01 | 0.06 ± 0.01 | 0.03 ± 0.01 | 0.07 ± 0.04 |
| Brain | 0.02 ± 0.01 | 0.02 ± 0.01 | 0.02 ± 0.01 | 0.04 ± 0.03 |
Values are reported as the mean percent of total injected dose per gram (%ID/g) of tissue ± standard deviation (n = 4 for all time points except where noted).
n = 3.
Thyroid values are reported as percent dose per organ rather than % ID/g.
Table 4.
Biodistribution of radioactivity in specific brain regions of female Sprague–Dawley rats after injection of [125I]1 (a), [125I]2 (b), and [18F]3 (c) a
| (a) | ||||
|---|---|---|---|---|
|
| ||||
| [125I]1 | 15 min | 30 minb | 60 min | 120 min |
| Basal Hypothalamus | 0.08 ± 0.01 | 0.06 ± 0.01 | 0.06 ± 0.01 | 0.05 ± 0.04 |
| Amygdala | 0.09 ± 0.02 | 0.07 ± 0.03 | 0.09 ± 0.02 | 0.06 ± 0.01 |
| Dorsal Striatum | 0.05 ± 0.01 | 0.05 ± 0.01 | 0.04 ± 0.01 | 0.03 ± 0.01 |
| Cerebellum | 0.08 ± 0.01 | 0.05 ± 0.01 | 0.05 ± 0.01 | 0.03 ± 0.01 |
| Remaining Brain | 0.07 ± 0.01 | 0.05 ± 0.01 | 0.05 ± 0.01 | 0.03 ± 0.01 |
| (b) | ||||
|
| ||||
| [125I]2 | ||||
| Basal hypothalamus | 0.04 ± 0.01 | 0.03 ± 0.01 | 0.03 ± 0.01 | 0.04 ± 0.01 |
| Amygdala | 0.06 ± 0.01 | 0.08 ± 0.06 | 0.06 ± 0.01 | 0.05 ± 0.02 |
| Dorsal striatum | 0.03 ± 0.01 | 0.03 ± 0.01 | 0.02 ± 0.01 | 0.02 ± 0.01 |
| Cerebellum | 0.03 ± 0.01 | 0.03 ± 0.01 | 0.03 ± 0.01 | 0.03 ± 0.01 |
| Remaining brain | 0.03 ± 0.01 | 0.02 ± 0.01 | 0.02 ± 0.01 | 0.02 ± 0.01 |
| (c) | ||||
|
| ||||
| [18F]3 | ||||
| Basal hypothalamus | 0.03 ± 0.01 | 0.03 ± 0.01 | 0.06 ± 0.01 | 0.11 ± 0.04 |
| Amygdala | 0.05 ± 0.01 | 0.10 ± 0.03 | 0.11 ± 0.07 | 0.13 ± 0.02 |
| Dorsal striatum | 0.02 ± 0.01 | 0.03 ± 0.01 | 0.03 ± 0.01 | 0.05 ± 0.03 |
| Cerebellum | 0.02 ± 0.01 | 0.05 ± 0.04 | 0.02 ± 0.01 | 0.04 ± 0.03 |
| Remaining brain | 0.02 ± 0.01 | 0.02 ± 0.01 | 0.02 ± 0.01 | 0.03 ± 0.03 |
Values are reported as the mean percent of total injected dose per gram (%ID/g) of tissue ± standard deviation (n = 4 for all time points except where noted).
n = 3.
When comparing the regions of higher rat OTR densities with the low OTR density region of the cerebellum, there was not a significant difference as most activity measurements for the brain samples were very near background readings. However, there was a slightly noticeable increase in activity at the 60 and 120 min time points of [18F]3 in the amygdala and basal hypothalamus. This data could account for penetration of [18F]3 to the brain, but at a rate not ideal for PET imaging. To further clarify if [18F]3 was viable for PET imaging OTR of the CNS, a PET scan was performed using a rat model.
Considering the periphery, the increase in I-125 uptake in the thyroid over time suggests [125I]1 and [125I]2 both were broken down readily in vivo at the iodine position with the cis-isomer being slightly more stable. In contrast, [18F]3 appeared to remain intact as there was no significant increase in F-18 bone uptake over time. This is to be expected as iodine is a much better leaving group than fluorine. There was significant uptake of [125I]1 and [125I]2 observed within the uterus as was expected due to the uterus being rich in OTR. The data generated from the uterus for [18F]3 was deleted from Table 3c due to a discovered experimental error. The liver was the region with the most uptake of all radiotracers. The physiology of the liver involves breaking down small and complex molecules; therefore the uptake in the liver indicates the tracers were being metabolized. Elevated uptake in the kidney confirms this. In general, an overall lower amount of activity was detected with [18F]3 in comparison to [125I]1 and [125I]2, especially in the heart, blood, muscle, and lung. We speculate, due to the increased stability of [18F]3 mentioned previously, [18F]3 saturates OTR and V1aR sites (or possibly other receptors) more rapidly as its radioactive isotope stays intact with the core molecule and, therefore, less of it reaches the liver and kidney. The increased activity measured for [125I]1 and [125I]2 in the heart, blood, muscle, and lung was more likely free I-125 than [125I]1 or [125I]2 that did not reach the OTR or V1aR.
3.9. PET imaging of [18F]3 and [11C]4 using rat models
Determining OTR densities non-invasively would be ideal for correlating OTR density to social behavior patterns, normal and abnormal, without incurring physical harm to subjects. We anticipated the use of [18F]3 and [11C]4 in PET imaging studies would provide a good base in our path to develop such a tool. Although [18F]3 and [11C]4 would not be ideal for use in rodent subjects unless the distribution of both OTR and V1aR were desired, their selectivity in homologous human receptors should provide a distinctive pattern once the technology is proven viable. To investigate the viability of [18F]3, three Sprague–Dawley rats were investigated in 90 min PET imaging scans beginning at the time of injection. Figure 7 shows three sagittal images of the brain region which are a sum of the total 90 min of the scan (Fig. 7a), a sum of the first 5 min of the scan (Fig. 7b), and a sum of the last 30 min of the scan (Fig. 7c). A thorough investigation of the entire brain region from the sum of the total scan indicated that there was not enough specific uptake of [18F]3 to merit regular investigative use of OTR density mapping. To determine if [18F]3 was penetrating to the brain within the first 5 min post injection, we summed the scan within this timeframe. As indicated by the red arrows in Figure 7b, it appears there was some mild brain penetration of [18F]3 immediately following injection. A time-activity curve (TAC) generated from our software (Fig. 8) confirmed that there appeared to be a burst of activity into the brain immediately following injection, followed a rapid decrease. Figure 8 includes the TACs of the rostral and caudal halves of the brain, the whole brain, and some muscle tissue representing periphery uptake. These TACs may imply [18F]3 has affinity for the P-glycoprotein pump, but further studies would need be conducted for validation. Additionally, the TACs confirmed that [18F]3 or a metabolite of [18F]3 does, in fact, gradually enter the brain over time. Thus, Figure 7c clearly has a much higher background in the brain region than Figure 7b, yet no specific uptake was observed.
Figure 7.

PET images of 295 μCi of [18F]3 in a 280 kg female Sprague-Dawley rat. (a) Sum of 90 min scan. (b) Sum of first 5 min of scan with red arrows pointing to suspected uptake. (c) Sum of last 30 min of scan.
Figure 8.

Time-activity curves showing uptake graphs over time of the rostral and caudal halves of the brain, the whole brain, and muscle tissue from the periphery.
Although the potency of 4 was not quite as good as 3, we wanted to investigate if a slightly smaller molecule would aid in penetration of the BBB. Therefore, [11C]4 was investigated in four Sprague–Dawley rats. The results were more disappointing than those obtained from [18F]3. This was somewhat anticipated as a compound bearing a similar structure, L-371257, is known for being a very poor brain penetrant.33 Figure 9 has a representative sagittal image from the sum of the 45 min scan and Figure 10 contains a TAC curve generated from the entire brain region and an area of muscle representing periphery uptake. The TAC curve suggests that a gradual uptake of [11C]4 in the brain may occur as was seen with [18F]3 as there was an uptick in activity near 2000 s, but the scan was stopped shortly after two half-lives. It is also possible that [11C]4 penetrated to the brain immediately following injection as there was a spike in activity in the area, however, there was no visual confirmation from the image itself.
Figure 9.
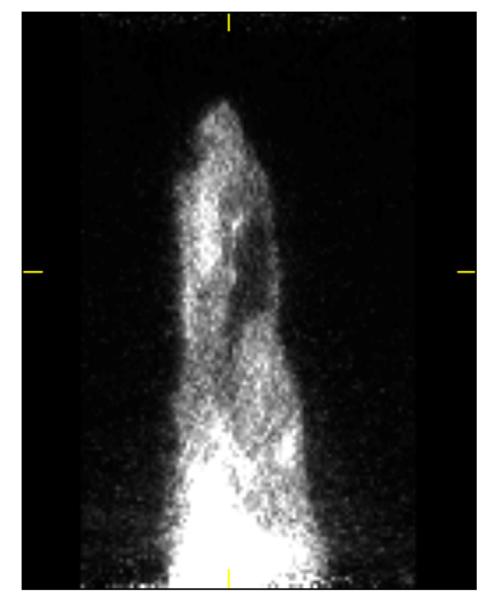
PET image of 277 μCi of [11C]4 in a 280 kg female Sprague-Dawley rat over 45 min.
Figure 10.

Time-activity curves showing uptake graphs over time of the whole brain and muscle tissue from the periphery.
4. Conclusion
The OTR ligands (E)-1-(1-(2-(2-(3-iodoallyloxy)-4-(1-(methylsulfonyl)piperidin-4-yloxy)phenyl)acetyl)piperidin-4-yl)-3,4-dihy droquinolin-2(1H)-one (1), (Z)-1-(1-(2-(2-(3-iodoallyloxy)-4-(1-(methylsulfonyl)piperidin-4-yloxy)phenyl)acetyl)piperidin-4-yl)-3, 4-dihydroquinolin-2(1H)-one (2), 1-(4-(3,4-dihydroquinolin-1(2H)-yl)piperidin-1-yl)-2-(2-(2-fluoroethoxy)-4-((1-(methylsulfonyl) piperidin-4-yl)oxy)phenyl)ethanone (3), and 1-(1-(2-(2-methoxy-4-((1-(methylsulfonyl)piperidin-4-yl)oxy)phenyl)acetyl)piperidin-4-yl)-3,4-dihydroquinolin-2(1H)-one (4) have been synthesized, radiolabeled, and evaluated via in vitro and in vivo methods. Competitive binding assays performed using prairie vole brain slices with 1–4 showed a high potency for both the OTR and V1aR; no significant selectivity was observed for these compounds in rodent tissue. Competitive binding assays using cell lines expressing the homologous human OTR and vasopressin receptors (three subtypes) revealed 1–4 displayed potency for the OTR comparable to that of the rodent receptors, but showed significantly improved selectivity for the OTR over V1aR. Potency for the human OTR was at least 79-fold greater (1) than that of the V1aR and as much as 500-fold greater (3).
An in vitro autoradiography study confirmed the ability of [125I]1 and [125I]2 to localize the OTR and V1aR on prairie vole brain slices in specific regions previously investigated with radioactive peptides—encouraging proof that the receptors could potentially be localized in vivo with a small molecule ligand. Biodistribution studies suggested [18F]3 was more stable than [125I]1 and [125I]2 in an in vivo environment, but sufficient retention within the brain was not observed for any of the 3 molecules. PET imaging studies determined that both [18F]3 and [C11]4 were not viable for in vivo PET imaging of the OTR of the CNS although visual evidence suggested [18F]3 did penetrate the brain temporarily following injection. Therefore, the radioactive analogues of 1–4 are limited to in vitro studies following the procedures outlined here. Perhaps an alternative approach, such as the use of mannitol or adenosine, to help these compounds breach the BBB more readily could increase their viability for in vivo purposes within the CNS.34,35
The utility of [125I]1 and [125I]2 for localizing the OTR in primate brain sections is yet to be determined. The successful localization of primate OTR using these molecules would alleviate doubt that has been shed on localizations generated with peptides.8 Therefore, further studies are planned to assess the potential of these I-125 ligands in validating the OTR localization of primate brain sections.
Although having a slightly decreased potency for OTR, the synthetic intermediate 13 was found to have achieved optimal selectivity with no detectable affinity for any vasopressin receptor subtype. This result suggests further structural modifications could potentially lead to a radioligand candidate with the ability breach the BBB and maintain retention. It is theoretically possible to label 13 using [11C]methanesulfonylchoride as has been prepared previously.36 The addition of a hydrogen bond donor to the structure clearly improved selectivity despite allowing free rotation about its methylene bond and further reducing its molecular weight. Therefore, the potent and selective 13 may be a viable target for future studies.
In conclusion, noteworthy progress has been made and is still ongoing toward the development of small molecules bearing the ability to localize the OTR using both in vitro and in vivo methodologies. The two novel PET ligands investigated here were found unsuitable candidates for in vivo studies. However, two novel I-125 molecules were proven viable for in vitro localization of OTR via autoradiography and will be investigated further to validate their utility with primate brain sections.
Supplementary Material
Acknowledgements
We thank Larry Williams, Mel Camp, and Eugene Malveaux for their contributions in the rodent distribution studies. We thank the NIMH PDSP directed by Bryan L. Roth MD, PhD at the University of North Carolina at Chapel Hill and Project Officer Jamie Driscol at NIMH, Bethesda MD, USA for their contributions of the human cell line studies. We also thank Dr. Fred Strobel at the Emory University Mass Spectrometry Center for our mass spectrometry data. This research was funded by the National Institute of Mental Health through Grant 5 R21 MH090776-02. We also acknowledge NIH MH064692 (LJY) and RR00165 to YNPRC.
Footnotes
Supplementary data Supplementary data associated with this article can be found, in the online version, at doi:10.1016/j.bmc.2012.02.019.
References and notes
- 1.Andari E, Duhamel JR, Zalla T, Herbrecht E, Leboyer M, Sirigu A. Proc Natl Acad Sci U.S.A. 2010;107:4389. doi: 10.1073/pnas.0910249107. [DOI] [PMC free article] [PubMed] [Google Scholar]
- 2.Lim MM, Young LJ. Horm. Behav. 2006;50:506. doi: 10.1016/j.yhbeh.2006.06.028. [DOI] [PubMed] [Google Scholar]
- 3.Ross HE, Freeman SM, Spiegel LL, Ren X, Terwilliger EF, Young LJ. J. Neurosci. 2009;29:1312. doi: 10.1523/JNEUROSCI.5039-08.2009. [DOI] [PMC free article] [PubMed] [Google Scholar]
- 4.Lim MM, Murphy AZ, Young LJ. J. Comp. Neurol. 2004;468:555. doi: 10.1002/cne.10973. [DOI] [PubMed] [Google Scholar]
- 5.Olazabal DE, Young LJ. Horm. Behav. 2006;49:681. doi: 10.1016/j.yhbeh.2005.12.010. [DOI] [PubMed] [Google Scholar]
- 6.Olazabal DE, Young LJ. Neuroscience. 2006;141:559. doi: 10.1016/j.neuroscience.2006.04.017. [DOI] [PubMed] [Google Scholar]
- 7.Shapiro LE, Insel TR. Ann. N. Y. Acad. Sci. 1992;652:448. doi: 10.1111/j.1749-6632.1992.tb34380.x. [DOI] [PubMed] [Google Scholar]
- 8.Toloczko DM, Young L, Insel TR. Ann. N. Y. Acad. Sci. 1997;807:506. doi: 10.1111/j.1749-6632.1997.tb51953.x. [DOI] [PubMed] [Google Scholar]
- 9.Manning M, Stoev S, Chini B, Durroux T, Mouillac B, Guillon G. Prog. Brain Res. 2008;170:473. doi: 10.1016/S0079-6123(08)00437-8. [DOI] [PubMed] [Google Scholar]
- 10.Schorscher-Petcu A, Dupre A, Tribollet E. Neurosci. Lett. 2009;461:217. doi: 10.1016/j.neulet.2009.06.016. [DOI] [PubMed] [Google Scholar]
- 11.Lemaire W, O’Brien JA, Burno M, Chaudhary AG, Dean DC, Williams PD, et al. Eur. J. Pharmacol. 2002;450:19. doi: 10.1016/s0014-2999(02)02048-4. [DOI] [PubMed] [Google Scholar]
- 12.Freidinger RM, Pettibone DJ. Med. Res. Rev. 1997;17:1. doi: 10.1002/(sici)1098-1128(199701)17:1<1::aid-med1>3.0.co;2-5. [DOI] [PubMed] [Google Scholar]
- 13.Dean DC, Ellsworth RL, Chen R, Staskiewicz SJ, Melillo DG. Synth. Appl. Isotopically Labelled Compd. 1994;1995:795. [Google Scholar]
- 14.Riss PJ, Aigbirhio FI. Chem. Commun. (Camb) 2011;47:11873. doi: 10.1039/c1cc15342k. [DOI] [PubMed] [Google Scholar]
- 15.Bao Q, Newport D, Chen M, Stout DB, Chatziioannou AF. J. Nucl. Med. 2009;50:401. doi: 10.2967/jnumed.108.056374. [DOI] [PMC free article] [PubMed] [Google Scholar]
- 16.Voll RJ, McConathy J, Waldrep MS, Crowe RJ, Goodman MM. Appl. Radiat. Isot. 2005;63:353. doi: 10.1016/j.apradiso.2005.04.008. [DOI] [PubMed] [Google Scholar]
- 17.Plisson C, Stehouwer JS, Voll RJ, Howell L, Votaw JR, Owens MJ, et al. J. Med. Chem. 2007;50:4553. doi: 10.1021/jm061303s. [DOI] [PubMed] [Google Scholar]
- 18.Insel TR, Gelhard R, Shapiro LE. Neuroscience. 1991;43:623. doi: 10.1016/0306-4522(91)90321-e. [DOI] [PubMed] [Google Scholar]
- 19.Wang ZX, Liu Y, Young LJ, Insel TR. Integr. Neurobiol. Affiliation. 1997;807:510. [Google Scholar]
- 20.Roth BL, Spitzer JA. Am. J. Physiol. 1987;252:E699. doi: 10.1152/ajpendo.1987.252.5.E699. [DOI] [PubMed] [Google Scholar]
- 21.Wilson AA, Houle SJ. Labelled Compd. Radiopharm. 1999;42:1277. [Google Scholar]
- 22.Williams PD, Bock MG, Evans BE, Freidinger RM, Gallicchio SN, Guidotti MT, et al. Bioorg. Med. Chem. Lett. 1999;9:1311. doi: 10.1016/s0960-894x(99)00181-x. [DOI] [PubMed] [Google Scholar]
- 23.Goodman MM, Kung MP, Kabalka GW, Kung HF, Switzer R. J. Med. Chem. 1994;37:1535. doi: 10.1021/jm00036a020. [DOI] [PubMed] [Google Scholar]
- 24.Lim MM, Murphy AZ, Young LJ. J. Comp. Neurol. 2004;468:555. doi: 10.1002/cne.10973. [DOI] [PubMed] [Google Scholar]
- 25.Freeman SM, Young LJ. Emory University; 2011. Unpublished Data. [Google Scholar]
- 26.Tavares AA, Jobson NK, Dewar D, Sutherland A, Pimlott SL. Nucl. Med. Biol. 2011;38:493. doi: 10.1016/j.nucmedbio.2010.11.011. [DOI] [PubMed] [Google Scholar]
- 27.Waterhouse RN. Mol. Imaging Biol. 2003;5:376. doi: 10.1016/j.mibio.2003.09.014. [DOI] [PubMed] [Google Scholar]
- 28.Leo A, Hansch C, Elkins D. Chem. Rev. 1971;71:525. [Google Scholar]
- 29.Pajouhesh H, Lenz GR. NeuroRx. 2005;2:541. doi: 10.1602/neurorx.2.4.541. [DOI] [PMC free article] [PubMed] [Google Scholar]
- 30.Lipinski CA, Lombardo F, Dominy BW, Feeney PJ. Adv. Drug Deliv. Rev. 2001;46:3. doi: 10.1016/s0169-409x(00)00129-0. [DOI] [PubMed] [Google Scholar]
- 31.Insel TR. Psychoneuroendocrinology. 1992;17:3. doi: 10.1016/0306-4530(92)90073-g. [DOI] [PubMed] [Google Scholar]
- 32.Sharom FJ. J. Membr. Biol. 1997;160:161. doi: 10.1007/s002329900305. [DOI] [PubMed] [Google Scholar]
- 33.Williams PD, Clineschmidt BV, Erb JM, Freidinger RM, Guidotti MT, Lis EV, et al. J. Med. Chem. 1995;38:4634. doi: 10.1021/jm00023a002. [DOI] [PubMed] [Google Scholar]
- 34.Carman AJ, Mills JH, Krenz A, Kim DG, Bynoe MS. J. Neurosci. 2011;31:13272. doi: 10.1523/JNEUROSCI.3337-11.2011. [DOI] [PMC free article] [PubMed] [Google Scholar]
- 35.Cosolo WC, Martinello P, Louis WJ, Christophidis N. Am. J. Physiol. 1989;256:R443. doi: 10.1152/ajpregu.1989.256.2.R443. [DOI] [PubMed] [Google Scholar]
- 36.McCarron JA, Pike VW. J. Labelled Compd. Radiopharm. 2003;46:1127. [Google Scholar]
Associated Data
This section collects any data citations, data availability statements, or supplementary materials included in this article.