Abstract
We previously determined that the predicted risk of radiogenic second cancer in the bladder and rectum after proton arc therapy (PAT) was less than or equal to that after volumetric modulated arc therapy (VMAT) with photons, but we did not consider the impact of margin size on that risk. The current study was thus conducted to evaluate margin size’s effect on the predicted risks of second cancer for the two modalities and the relative risk between them. Seven treatment plans with margins ranging from 0 mm in all directions to 6 mm posteriorly and 8 mm in all other directions were considered for both modalities. We performed risk analyses using three risk models with varying amounts of cell sterilization and calculated ratios of risk for the corresponding PAT and VMAT plans. We found that the change in risk with margin size depended on the risk model but that the relative risk remained nearly constant with margin size, regardless of the amount of cell sterilization modeled. We conclude that while margin size influences the predicted risk of a second cancer for a given modality, it appears to affect both modalities in roughly equal proportions so that the relative risk between PAT and VMAT is approximately equivalent.
Keywords: second cancer, second malignant neoplasm, volumetric modulated arc therapy, VMAT, proton arc therapy, proton therapy, prostate cancer, margin size
1. Introduction
Long-term cancer survivors who received radiotherapy are at an increased risk to develop a radiogenic second cancer (Friedman et al 2010). For prostate cancer patients, the risk of second cancer incidence is a public health concern because of the large population of survivors: 2.3 million in the United States in 2007 (SEER). Previous studies have reported a lower predicted risk of radiogenic second cancer after proton radiotherapy than after intensity-modulated radiotherapy for cancers at various anatomic sites (Miralbell et al 2002, Newhauser et al 2009, Taddei et al 2010), including the prostate (Schneider et al 2006, Schneider et al 2007, Fontenot et al 2009). The decreased predicted risk for proton therapy was persevered even when stray neutron dose was considered in the risk calculations (Fontenot et al 2009). Moreover, the advantage for proton therapy was shown to be independent of the uncertainty in the mean radiation weighting factor for neutrons (Newhauser et al 2009, Fontenot et al 2010).
Because of arc therapies’ potential for increased conformity and speed of delivery, interest in their use has increased in recent years. For example, proton arc therapy (PAT) has appeared in the literature (Isacsson et al 1997, Deasy et al 1997, Sandison et al 1997, Oelfke and Bortfeld 2000, Flynn et al 2007), and machines capable of delivery of PAT have been proposed (Caporaso et al 2008, Sengbusch et al 2009). Additionally, the rotational version of intensity-modulated radiotherapy, volumetric modulated arc therapy (VMAT), has become widely available since its proposal in 2008 (Otto 2008). Furthermore, several authors have reported on the use of VMAT for prostate cancer (Palma et al 2008, Zhang et al 2009, Wolff et al 2009, Kjaer-Kristoffersen et al 2009, Yoo et al 2010), and this technique is routinely used at many radiotherapy centers.
Advanced prostate radiotherapy techniques like proton therapy and VMAT often utilize image-guidance for setup. Image-guidance has facilitated a reduction in margins around the prostate. For example, Balter et al (1993) found that when setup errors exceed 1 cm, correction with portal imaging reduced the necessary margin by 6 mm. In one retrospective study, ultrasound guidance reduced the necessary margin to 4 mm or less (Keller et al 2004). In another retrospective study, prostate margins were reduced from 10 mm to 5 mm with ultrasound or CT alignment (Schaly et al 2005). While margin sizes are institution- and technique-specific, we expect that margins will generally continue to decrease as immobilization and image-guidance techniques evolve.
Recently, we compared the predicted risk of radiogenic second cancer incidence in the bladder and rectum after PAT for prostate cancer to that after 6-MV VMAT. We reported that the ratio of excess relative risk (RRR) between the two modalities (PAT:VMAT) was approximately 1 when predicted with the linear-non-threshold risk model and was significantly less than 1 (interval: 0.74–0.91) when predicted with the linear-exponential and linear-plateau risk models (Rechner et al 2012). However, the literature does not contain any reports of the effect of margin size on the risk of radiogenic second cancer following rotational radiotherapy with protons versus photons, and we did not investigate the effect of margin size in our previous work. As mentioned above, margin size is an important variable because margins are institution-specific and will most likely decrease with advances in imaging and patient immobilization.
Therefore, the aim of this work was to quantify the influence of margin size on the predicted RRR of radiogenic second cancer incidence in the bladder and rectum after PAT for prostate cancer versus 6-MV VMAT. To accomplish this goal, we created treatment plans using various margin sizes and then applied risk models from the literature to dosimetric data from the treatment planning system (TPS) and from Monte Carlo simulations.
2. Materials and Methods
2.1 Patient selection and contouring
This work was performed under an institutional review board-approved protocol for retrospective treatment planning studies. Dosimetric calculations and risk predictions were carried out on the simulation computed tomography (CT) dataset for a previously studied patient treated at our institution for prostate cancer. This patient, a 56 year old man with stage T2a adenocarcinoma of the prostate, was representative of the patients commonly seen in our clinic (Fontenot et al 2009, Rechner et al 2012). A water-filled balloon had been inserted into the patient’s rectum during simulation and treatment to provide localization, immobilization, and rectal sparing, and the balloon was visible on the simulation images. The CTV was defined as the prostate and proximal seminal vesicles.
For the current analysis, we created multiple planning target volumes (PTVs) by adding various margins to the CTV. The prevailing standard-of-care (SOC) at our institution was a 5-mm margin in the posterior direction and a 7-mm margin in all other directions. In this study, we investigated seven margin sizes, ranging from the theoretical limit of no margin (CTV=PTV) to margins slightly larger than our current SOC: 6 mm in the posterior direction and 8 mm in all other directions. A complete list of margin designs is presented in table 1.
Table 1.
CTV-to-PTV margins and their difference from the current SOC margins at our institution for each treatment plan studied.
| Plan Index | Posterior Margin (mm) | Other Margin (mm) | Posterior Difference from SOC (mm) | Other Difference from SOC (mm) | Comment Regarding Margin |
|---|---|---|---|---|---|
| 1 | 0 | 0 | −5 | −7 | Smallest |
| 2 | 0 | 2 | −5 | −5 | |
| 3 | 2 | 4 | −3 | −3 | |
| 4 | 3 | 5 | −2 | −2 | |
| 5 | 4 | 6 | −1 | −1 | |
| - | 5 | 7 | 0 | 0 | SOC |
| 6 | 6 | 8 | 1 | 1 | Largest |
2.2 Treatment planning and calculation of therapeutic and stray dose
Treatment plans were created for each PTV for proton and photon treatments using a commercial TPS (Eclipse, Varian Medical Systems, Palo Alto, CA; version 8.6.15 for VMAT and version 8.9.08 for proton therapy). The treatment planning method was consistent with that used in our previous study (Rechner et al 2012). For proton therapy, 16 static passively scattered beams were used to approximate arc delivery, which is similar to the approach used by Flynn et al (2007). The lateral, proximal, and distal proton beam margins were calculated for the SOC PTV with a method used clinically at our institution (Moyers et al 2001). Then, the differences between the new CTV-to-PTV margins and the SOC CTV-to-PTV margins (4th and 5th columns in table 1) were applied to the SOC lateral, proximal, and distal proton beam margins to produce high-dose regions that provided appropriate coverage for the new PTVs. For VMAT, each two-arc plan was created by applying all the same objectives in the inverse treatment planning process. Specifically, the same objective that was applied to the SOC PTV was applied to each new PTV. The aim of this treatment planning method was to produce comparable plans except for the volume of the high-dose region. For consistency and adequate target coverage, all treatment plans were prescribed a mean dose of 76 gray (Gy (RBE) [relative biological effectiveness] for protons (ICRU 2007)]) to the PTV, each normalized identically so that all plans provided for at least 99% of the PTV to receive the prescribed dose.
Both therapeutic and stray contributions to dose were considered. Therapeutic dose was obtained by exporting the differential dose volume histograms (DVHs) from the TPS for each organ and each treatment plan considered. Stray dose was calculated with Monte Carlo simulations according to our previous method (Newhauser et al 2007, Rechner et al 2012) for PAT. For VMAT, stray dose based on the treatment plan for the SOC PTV was estimated following the method of Howell et al (2010a, 2010b). While proton and photon doses reported in Gy (RBE) and Gy, respectively, are numerically equivalent to those reported in sieverts (Sv) (ICRP 1991, ICRU 2007), one must convert the neutron absorbed dose in Gy to an equivalent dose in Sv by applying a fluence-weighted average radiation weighting factor for neutrons (ICRP 2003, Fontenot et al 2008). The equivalent dose calculations were described in detail in our previous study (Rechner et al 2012).
2.3 Risk prediction
The quantity excess relative risk (ERR) was chosen to describe the predicted risk of radiogenic second cancer incidence in this study. Three general forms of risk models were applied to calculate the predicted ERR: the linear-non-threshold risk model (NRC 2006), the linear-exponential risk model (Fontenot et al 2010, Fontenot et al 2009), and the linear-plateau risk model (Fontenot et al 2010, Fontenot et al 2009). Additionally, for the linear-exponential and linear-plateau risk models, both low- and high-dose inflection points (which indicate the maximum risk for cancer induction) of 10 and 40 Sv, respectively, were investigated. The risk of radiogenic second cancers in the bladder wall and rectal wall were summed to yield the total ERR for the modality.
The ratio of excess relative risk (RRR) was calculated to compare the two modalities. Specifically, the ratio of ERR values was taken with VMAT as the reference:
| (1) |
Therefore, an RRR value less than unity would indicate an advantage for PAT, and an RRR value greater than unity would indicate an advantage for VMAT. A linear regression analysis was performed to quantify the potential relationship between risk and margin size.
3. Results
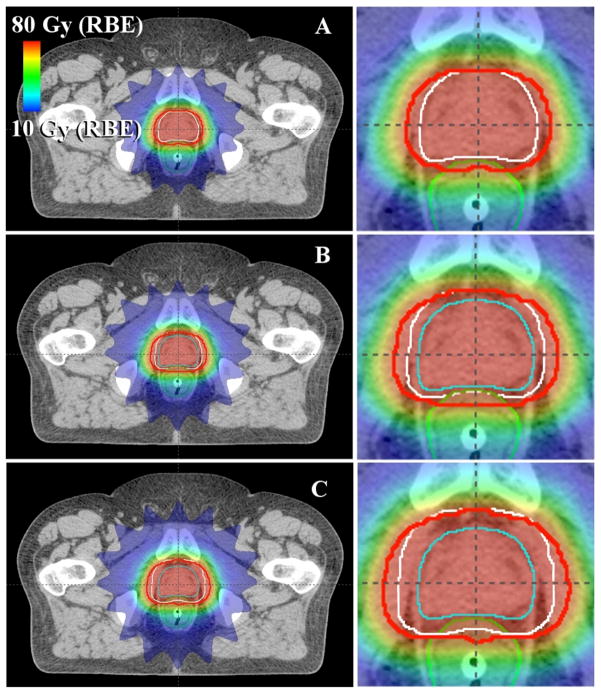
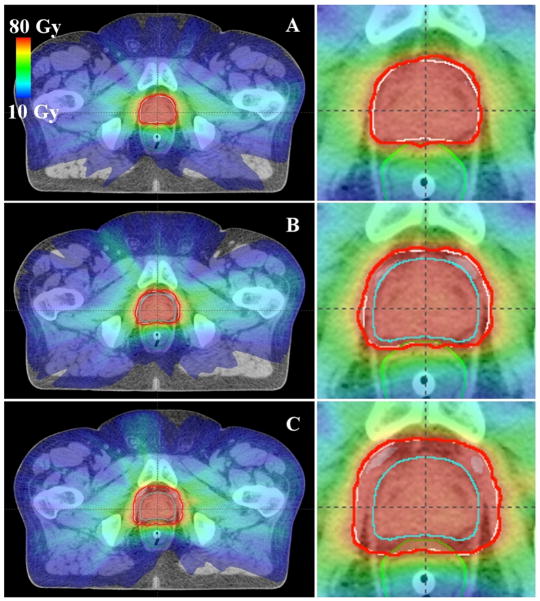
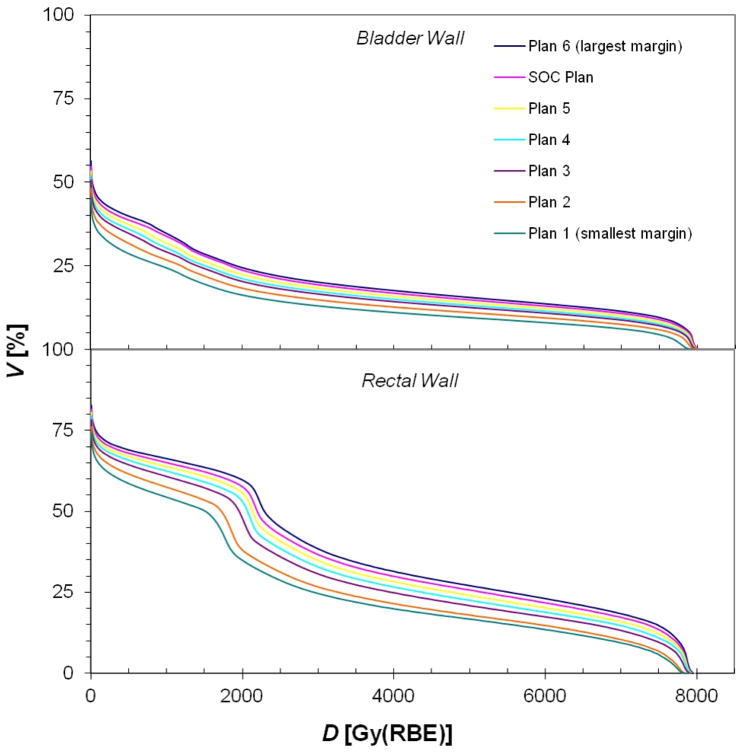
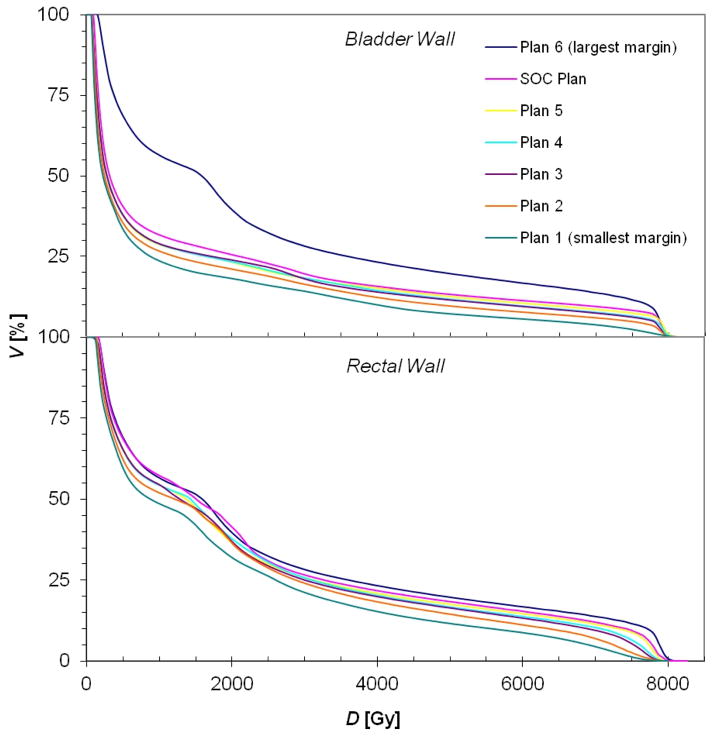
Sample treatment plans for PAT and VMAT are shown in figures 1 and 2, respectively. As anticipated, the distribution of low dose (i.e. 10 Gy (RBE) or Gy) was similar for each margin size for a given modality, while the volume of the high-dose region expanded as the CTV-to-PTV margin size increased. Because of the steep dose gradients in the bladder and rectal walls, the minimum and maximum doses to the bladder and rectal walls remained nearly constant. In contrast, the mean doses to the bladder and rectal walls increased as the gradient further overlapped these organs (tables 2 and 3). Furthermore, it can be seen in figures 3 and 4 that the volume that received any given dose generally increased with increasing margin size.
Figure 1.
Axial images showing sample PAT treatment plans with various CTV-to-PTV margins: (A) 0 mm in all directions, (B) 2 mm posteriorly and 4 mm in other directions, and (C) 6 mm posteriorly and 8 mm in other directions. The rectum is shown in green, the CTV in cyan, the PTV in white, and the prescribed isodose line (76 Gy (RBE)) in red.
Figure 2.
Axial images showing sample VMAT treatment plans with various CTV-to-PTV margins: (A) 0 mm in all directions, (B) 2 mm posteriorly and 4 mm in other directions, and (C) 6 mm posteriorly and 8 mm in other directions. The rectum is shown in green, the CTV in cyan, the PTV in white, and the prescribed isodose line (76 Gy) in red.
Table 2.
Minimum, mean, and maximum therapeutic doses (Dmin, Dmean, Dmax, respectively) in Gy (RBE) for each PAT treatment plan studied. Plan indices correspond to those in table 1.
| Volume | Statistic | PAT Therapeutic Dose (Gy (RBE))
|
||||||
|---|---|---|---|---|---|---|---|---|
| Plan 1 (smallest margin) | Plan 2 | Plan 3 | Plan 4 | Plan 5 | SOC Plan | Plan 6 (Largest Margin) | ||
| Bladder Wall | Dmin | 0.0 | 0.0 | 0.0 | 0.0 | 0.0 | 0.0 | 0.0 |
| Dmean | 10.5 | 11.9 | 13.4 | 14.0 | 14.8 | 15.6 | 16.2 | |
| Dmax | 79.4 | 79.9 | 80.0 | 80.0 | 80.1 | 80.2 | 80.3 | |
|
| ||||||||
| Rectal Wall | Dmin | 0.0 | 0.0 | 0.0 | 0.0 | 0.0 | 0.0 | 0.0 |
| Dmean | 20.8 | 22.4 | 25.2 | 26.6 | 27.8 | 29.1 | 30.3 | |
| Dmax | 78.9 | 79.2 | 79.6 | 79.7 | 79.8 | 79.8 | 79.9 | |
Table 3.
Minimum, mean, and maximum therapeutic doses (Dmin, Dmean, Dmax, respectively) in Gy for each VMAT treatment plan studied. Plan indices correspond to those in table 1.
| Volume | Statistic | VMAT Therapeutic Dose (Gy)
|
||||||
|---|---|---|---|---|---|---|---|---|
| Plan 1 (smallest margin) | Plan 2 | Plan 3 | Plan 4 | Plan 5 | SOC Plan | Plan 6 (Largest Margin) | ||
| Bladder Wall | Dmin | 0.7 | 0.7 | 0.8 | 0.9 | 0.9 | 0.9 | 1.0 |
| Dmean | 11.3 | 13.3 | 14.8 | 14.9 | 15.2 | 16.4 | 17.0 | |
| Dmax | 82.3 | 81.0 | 80.8 | 81.0 | 81.7 | 80.8 | 81.5 | |
|
| ||||||||
| Rectal Wall | Dmin | 1.1 | 1.2 | 1.3 | 1.3 | 1.4 | 1.5 | 1.5 |
| Dmean | 18.3 | 20.5 | 21.9 | 22.3 | 22.7 | 23.8 | 24.8 | |
| Dmax | 80.0 | 80.0 | 80.0 | 79.9 | 80.1 | 80.4 | 81.4 | |
Figure 3.
Cumulative DVHs (cumulative volume as a function of dose) for the bladder wall and rectal wall for all the PAT treatment plans created for this study, where the plan indices correspond to those in table 1 (plan 1 has the smallest margin and plan 6 the largest).
Figure 4.
Cumulative DVHs (cumulative volume as a function of dose) for the bladder wall and rectal wall for all the VMAT treatment plans created for this study, where the plan indices correspond to those in table 1 (plan 1 has the smallest margin and plan 6 the largest).
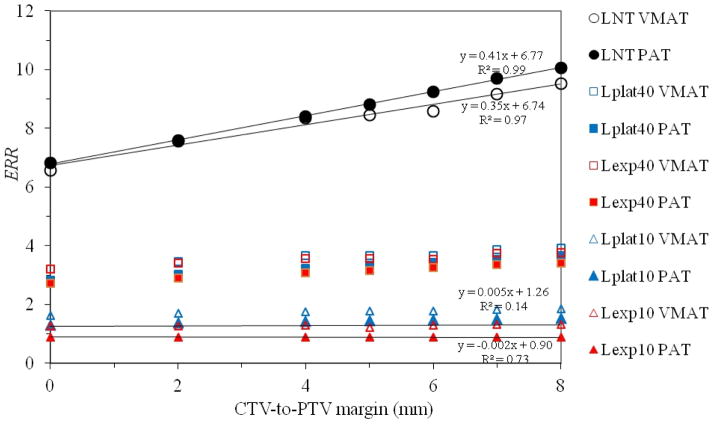
The increase in mean dose generally translated into an increase in risk, but the amount of increase depended on the risk model (figure 5). Unsurprisingly, the increase in ERR with margin size was greatest for the linear-non-threshold model and least for the risk models that accounted for cell killing. Specifically, when a linear regression was performed on risk from the linear-non-threshold model, the ERR increased approximately 0.41 (5.9%) and 0.35 (5.2%) per millimeter increase in margin for PAT and VMAT, respectively. The linear-exponential risk model with an inflection point at 10 Sv showed virtually no dependence on margin size, with a change of less than −0.5% per millimeter for both PAT and VMAT.
Figure 5.
Plot of ERR versus CTV-to-PTV margin size for VMAT and PAT for all risk models studied. A linear regression is shown for the most extreme cases to illustrate the range of slopes resulting from the various risk models. The positive slope is largest for the linear-non-threshold model, but slope declines to approximately zero for the linear-exponential model with an inflection point of 10 Gy. LNT, Lexp10, Lexp40, Lplat10, and Lplat40 denote the linear-non-threshold, linear-exponential and linear-plateau risk models with inflection points at 10 Sv and 40 Sv, respectively.
While the relationship between ERR and margin size depended on risk model, the RRR value did not appear to depend on margin size (figure 6) for any risk model considered. A linear regression analysis revealed the change in RRR per millimeter was within 1% or less per millimeter (interval: −0.004–0.009).
Figure 6.
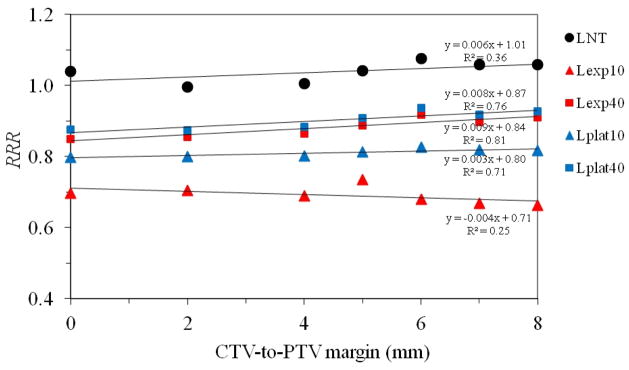
Plot of RRR versus CTV-to-PTV margin size for all risk models studied. A linear regression is shown for the most extreme cases to illustrate the range of slopes resulting from the various risk models. The positive slope is largest for the linear-non-threshold model, but the slope declines to approximately zero for the linear-exponential model with an inflection point of 10 Gy. LNT, Lexp10, Lexp40, Lplat10, and Lplat40 denote the linear-non-threshold, linear-exponential and linear-plateau risk models with inflection points at 10 Sv and 40 Sv, respectively.
4. Discussion
We examined the dependence of the predicted risk of radiogenic second cancer on the margin size around the CTV for PAT and VMAT for multiple risk models. We found that the relationship between ERR and margin size depended on the risk model, with the linear-non-threshold model predicting the largest increase in risk with increasing margin size. The RRR remained virtually constant with increasing margin, regardless of the risk model used.
Our results differ from those of Dasu et al (2011), who reported an approximately 50% relative decrease in total risk of a radiogenic second cancer in the bladder and rectum with decreasing margin size. However, in contrast with this work, their study used three-dimensional conformal radiotherapy and only two margin sizes: 10 mm posteriorly and 15 mm in all other anatomical directions and 4 mm posteriorly and 6 mm in all other anatomical directions. The larger margin investigated by Dasu et al is outside the range investigated in this study. Additionally, the risk model used in the work of Dasu et al assumed a maximum risk for cancer induction at approximately 4 Gy, whereas the risk models utilized in this work assumed a maximum risk for cancer induction at 10 Sv or 40 Sv (in the models that modeled cell sterilization) or no maximum (in the linear-non-threshold model). While we observed an increase in ERR with margin size for the linear-non-threshold risk model, the effect was lessened with increasing consideration of cell sterilization (that is, when using the linear-plateau and linear-exponential risk models), with virtually no change in ERR related to margin size for the risk model that accounted for the most cell sterilization (the linear-exponential risk model with an inflection point of 10 Sv). This trend implies that one could expect a decrease in predicted risk with increasing margin size when using a risk model that accounted for additional cell sterilization, such as the risk model utilized by Dasu et al Given the differences in the modalities, risk models, and margin sizes examined by the two studies, we do not consider the results of this study to conflict with those of Dasu et al.
The current results are significant because they clarify the robustness of the major finding of our previous study, which compared the risks of radiogenic second cancer after PAT and VMAT for prostate cancer (Rechner et al 2012). Specifically, we have now determined that RRR is insensitive to margin size. Therefore, the results of our comparative risk study will continue to be relevant if, in the future, margin sizes are decreased owing to anticipated future improvements in beam localization and patient immobilization.
A strength of this study was the high levels of clinical realism and physical completeness of by its intricate methodology, that is, the calculation of patient-specific therapeutic and stray dose calculations. Furthermore, we tested several plausible relationships between dose and risk of second cancer; the qualitative findings did not depend on the selection of risk model.
This work’s few limitations are, we believe, mitigated by its comparative nature. For example, we only calculated stray dose for the plans with the SOC margins and then assumed that stray dose would be the same for all other plans for that modality. However, since the same assumption was made for both modalities and a ratio of risks was calculated, we consider this limitation to be minor. Additionally, while we expect the results of this study to be applicable to similar comparative risk studies for prostate cancer, other sites may have drastically different relationships between the risk of a second cancer and margin size, depending on the nearby anatomy and the radiosensitivity of the organs at risk. Future studies to investigate the effect of margin size on comparative risk for second cancers at other treatment sites are clearly indicated.
Acknowledgments
We would like to acknowledge Drs. Dragan Mirkovic, Rajat Kudchadker, Lei Dong, Annelise Giebeler, and Phillip Taddei for helpful dialogue and Ms. K. Carnes for assistance in preparing and editing this manuscript. This work was funded in part by grants from the National Cancer Institute (awards 1 R01 CA131463-01A1), the National Institute of Health (award K07CA131505), and a Northern Illinois University (subcontract of Department of Defense award W81XWH-08-1-0205).
Footnotes
Conflict of Interest: None.
The authors do not report any conflicts of interest.
References
- Balter JM, Chen GT, Pelizzari CA, Krishnasamy S, Rubin S, Vijayakumar S. Online repositioning during treatment of the prostate: a study of potential limits and gains. Int J Radiat Oncol Biol Phys. 1993;27:137–43. doi: 10.1016/0360-3016(93)90431-t. [DOI] [PubMed] [Google Scholar]
- Caporaso GJ, Mackie TR, Sampayan S, Chen YJ, Blackfield D, Harris J, Hawkins S, Holmes C, Nelson S, Paul A, Poole B, Rhodes M, Sanders D, Sullivan J, Wang L, Watson J, Reckwerdt PJ, Schmidt R, Pearson D, Flynn RW, Matthews D, Purdy J. A compact linac for intensity modulated proton therapy based on a dielectric wall accelerator. Phys Med. 2008;24:98–101. doi: 10.1016/j.ejmp.2008.01.010. [DOI] [PubMed] [Google Scholar]
- Dasu A, Toma-Dasu I, Franzen L, Widmark A, Nilsson P. Secondary malignancies from prostate cancer radiation treatment: a risk analysis of the influence of target margins and fractionation patterns. Int J Radiat Oncol Biol Phys. 2011;79:738–46. doi: 10.1016/j.ijrobp.2009.12.004. [DOI] [PubMed] [Google Scholar]
- Deasy JO, Mackie TR, DeLuca PM. Method and Apparatus for Proton Therapy. US005668371A United States Patent. 1997
- Flynn RT, Barbee DL, Mackie TR, Jeraj R. Comparison of intensity modulated x-ray therapy and intensity modulated proton therapy for selective subvolume boosting: a phantom study. Phys Med Biol. 2007;52:6073–91. doi: 10.1088/0031-9155/52/20/001. [DOI] [PMC free article] [PubMed] [Google Scholar]
- Fontenot J, Taddei P, Zheng Y, Mirkovic D, Jordan T, Newhauser W. Equivalent dose and effective dose from stray radiation during passively scattered proton radiotherapy for prostate cancer. Phys Med Biol. 2008;53:1677–88. doi: 10.1088/0031-9155/53/6/012. [DOI] [PubMed] [Google Scholar]
- Fontenot JD, Bloch C, Followill D, Titt U, Newhauser WD. Estimate of the uncertainties in the relative risk of secondary malignant neoplasms following proton therapy and intensity-modulated photon therapy. Phys Med Biol. 2010;55:6987–98. doi: 10.1088/0031-9155/55/23/S02. [DOI] [PMC free article] [PubMed] [Google Scholar]
- Fontenot JD, Lee AK, Newhauser WD. Risk of secondary malignant neoplasms from proton therapy and intensity-modulated x-ray therapy for early-stage prostate cancer. Int J Radiat Oncol Biol Phys. 2009;74:616–22. doi: 10.1016/j.ijrobp.2009.01.001. [DOI] [PMC free article] [PubMed] [Google Scholar]
- Friedman DL, Whitton J, Leisenring W, Mertens AC, Hammond S, Stovall M, Donaldson SS, Meadows AT, Robison LL, Neglia JP. Subsequent neoplasms in 5-year survivors of childhood cancer: the Childhood Cancer Survivor Study. J Natl Cancer Inst. 2010;102:1083–95. doi: 10.1093/jnci/djq238. [DOI] [PMC free article] [PubMed] [Google Scholar]
- Howell RM, Scarboro SB, Kry SF, Yaldo DZ. Accuracy of out-of-field dose calculations by a commercial treatment planning system. Phys Med Biol. 2010a;55:6999–7008. doi: 10.1088/0031-9155/55/23/S03. [DOI] [PMC free article] [PubMed] [Google Scholar]
- Howell RM, Scarboro SB, Taddei PJ, Krishnan S, Kry SF, Newhauser WD. Methodology for determining doses to in-field, out-of-field and partially in-field organs for late effects studies in photon radiotherapy. Phys Med Biol. 2010b;55:7009–23. doi: 10.1088/0031-9155/55/23/S04. [DOI] [PMC free article] [PubMed] [Google Scholar]
- ICRP. Publication 60, 1990 Recommendations of the International Commission of Radiological Protection. Ann ICRP. 1991;21:1–201. [PubMed] [Google Scholar]
- ICRP. Relative biological effectiveness (RBE), quality factor (Q), and radiation weighting factor (w(R)). A report of the International Commission on Radiological Protection. Ann ICRP. 2003:33. doi: 10.1016/s0146-6453(03)00024-1. [DOI] [PubMed] [Google Scholar]
- ICRU. Report 78 Prescribing, Recording, and Reporting Proton-Beam Therapy. Journal of the ICRU: International Commission on Radiation Units and Measurements. 2007:7. [Google Scholar]
- Isacsson U, Hagberg H, Johansson K-A, Montelius A, Jung B, Glimelius B. Potential advantages of protons over conventional radiation beams for paraspinal tumours. Radiotherapy and Oncology. 1997;45:63–70. doi: 10.1016/s0167-8140(97)00097-2. [DOI] [PubMed] [Google Scholar]
- Keller H, Tome W, Ritter MA, Mackie TR. Design of adaptive treatment margins for non-negligible measurement uncertainty: application to ultrasound-guided prostate radiation therapy. Phys Med Biol. 2004;49:69–86. doi: 10.1088/0031-9155/49/1/005. [DOI] [PubMed] [Google Scholar]
- Kjaer-Kristoffersen F, Ohlhues L, Medin J, Korreman S. RapidArc volumetric modulated therapy planning for prostate cancer patients. Acta Oncol. 2009;48:227–32. doi: 10.1080/02841860802266748. [DOI] [PubMed] [Google Scholar]
- Miralbell R, Lomax A, Cella L, Schneider U. Potential reduction of the incidence of radiation-induced second cancers by using proton beams in the treatment of pediatric tumors. Int J Radiat Oncol Biol Phys. 2002;54:824–9. doi: 10.1016/s0360-3016(02)02982-6. [DOI] [PubMed] [Google Scholar]
- Moyers MF, Miller DW, Bush DA, Slater JD. Methodologies and tools for proton beam design for lung tumors. Int J Radiat Oncol Biol Phys. 2001;49:1429–38. doi: 10.1016/s0360-3016(00)01555-8. [DOI] [PubMed] [Google Scholar]
- Newhauser W, Fontenot J, Zheng Y, Polf J, Titt U, Koch N, Zhang X, Mohan R. Monte Carlo simulations for configuring and testing an analytical proton dose-calculation algorithm. Phys Med Biol. 2007;52:4569–84. doi: 10.1088/0031-9155/52/15/014. [DOI] [PubMed] [Google Scholar]
- Newhauser WD, Fontenot JD, Mahajan A, Kornguth D, Stovall M, Zheng Y, Taddei PJ, Mirkovic D, Mohan R, Cox JD, Woo S. The risk of developing a second cancer after receiving craniospinal proton irradiation. Phys Med Biol. 2009;54:2277–91. doi: 10.1088/0031-9155/54/8/002. [DOI] [PMC free article] [PubMed] [Google Scholar]
- NRC. National Research Council of the National Academies. Washington D.C: The National Academies Press; 2006. BEIR-VII Biological Effects of Ionizing Radiation VII Report. Health risks from exposure to low levels of ionizing radiation. [Google Scholar]
- Oelfke U, Bortfeld T. Intensity modulated radiotherapy with charged particle beams: studies of inverse treatment planning for rotation therapy. Med Phys. 2000;27:1246–57. doi: 10.1118/1.599002. [DOI] [PubMed] [Google Scholar]
- Otto K. Volumetric modulated arc therapy: IMRT in a single gantry arc. Med Phys. 2008;35:310–7. doi: 10.1118/1.2818738. [DOI] [PubMed] [Google Scholar]
- Palma D, Vollans E, James K, Nakano S, Moiseenko V, Shaffer R, McKenzie M, Morris J, Otto K. Volumetric modulated arc therapy for delivery of prostate radiotherapy: comparison with intensity-modulated radiotherapy and three-dimensional conformal radiotherapy. Int J Radiat Oncol Biol Phys. 2008;72:996–1001. doi: 10.1016/j.ijrobp.2008.02.047. [DOI] [PubMed] [Google Scholar]
- Rechner LA, Howell RM, Zhang R, Etzel C, Lee AK, Newhauser WD. Risk of radiogenic second cancers following volumetric modulated arc therapy and proton arc therapy for prostate cancer. Phys Med Biol. 2012 doi: 10.1088/0031-9155/57/21/7117. submitted. [DOI] [PMC free article] [PubMed] [Google Scholar]
- Sandison GA, Papiez E, Bloch C, Morphis J. Phantom assessment of lung dose from proton arc therapy. Int J Radiat Oncol Biol Phys. 1997;38:891–7. doi: 10.1016/s0360-3016(97)00059-x. [DOI] [PubMed] [Google Scholar]
- Schaly B, Bauman GS, Song W, Battista JJ, Van Dyk J. Dosimetric impact of image-guided 3D conformal radiation therapy of prostate cancer. Phys Med Biol. 2005;50:3083–101. doi: 10.1088/0031-9155/50/13/008. [DOI] [PubMed] [Google Scholar]
- Schneider U, Lomax A, Besserer J, Pemler P, Lombriser N, Kaser-Hotz B. The impact of dose escalation on secondary cancer risk after radiotherapy of prostate cancer. Int J Radiat Oncol Biol Phys. 2007;68:892–7. doi: 10.1016/j.ijrobp.2007.02.029. [DOI] [PubMed] [Google Scholar]
- Schneider U, Lomax A, Pemler P, Besserer J, Ross D, Lombriser N, Kaser-Hotz B. The impact of IMRT and proton radiotherapy on secondary cancer incidence. Strahlenther Onkol. 2006;182:647–52. doi: 10.1007/s00066-006-1534-8. [DOI] [PubMed] [Google Scholar]
- SEER. Surveillance Epidemiology and End Results. 2007. [Google Scholar]
- Sengbusch E, Perez-Andujar A, DeLuca PM, Jr, Mackie TR. Maximum proton kinetic energy and patient-generated neutron fluence considerations in proton beam arc delivery radiation therapy. Med Phys. 2009;36:364–72. doi: 10.1118/1.3049787. [DOI] [PMC free article] [PubMed] [Google Scholar]
- Taddei PJ, Howell RM, Krishnan S, Scarboro SB, Mirkovic D, Newhauser WD. Risk of second malignant neoplasm following proton versus intensity-modulated photon radiotherapies for hepatocellular carcinoma. Phys Med Biol. 2010;55:7055–65. doi: 10.1088/0031-9155/55/23/S07. [DOI] [PMC free article] [PubMed] [Google Scholar]
- Wolff D, Stieler F, Welzel G, Lorenz F, Abo-Madyan Y, Mai S, Herskind C, Polednik M, Steil V, Wenz F, Lohr F. Volumetric modulated arc therapy (VMAT) vs. serial tomotherapy, step-and-shoot IMRT and 3D-conformal RT for treatment of prostate cancer. Radiother Oncol. 2009;93:226–33. doi: 10.1016/j.radonc.2009.08.011. [DOI] [PubMed] [Google Scholar]
- Yoo S, Wu QJ, Lee WR, Yin FF. Radiotherapy treatment plans with RapidArc for prostate cancer involving seminal vesicles and lymph nodes. Int J Radiat Oncol Biol Phys. 2010;76:935–42. doi: 10.1016/j.ijrobp.2009.07.1677. [DOI] [PubMed] [Google Scholar]
- Zhang P, Happersett L, Hunt M, Jackson A, Zelefsky M, Mageras G. Volumetric Modulated Arc Therapy: Planning and Evaluation for Prostate Cancer Cases. Int J Radiat Oncol Biol Phys. 2009 doi: 10.1016/j.ijrobp.2009.03.033. [DOI] [PubMed] [Google Scholar]


