

Abstract
Rationale:
Chorioamnionitis induces preterm delivery and acute involution of the fetal thymus which is associated with postnatal inflammatory disorders. We studied the immune response, cell composition, and architecture of the fetal thymus following intraamniotic lipopolysaccharide (LPS) exposure.
Methods:
Time-mated ewes received an intraamniotic injection of LPS 5, 12, or 24 hours or 2, 4, 8, or 15 days before delivery at 125 days gestational age (term = 150 days).
Results:
The LPS exposure resulted in decreased blood lymphocytes within 5 hours and decreased thymic corticomedullary ratio within 24 hours. Thymic interleukin 6 (IL6) and IL17 messenger RNA (mRNA) increased 5-fold 24 hours post-LPS exposure. Increased toll-like receptor 4 (TLR4) mRNA and nuclear factor κB positive cells at 24 hours after LPS delivery demonstrated acute thymic activation. Both TLR4 and IL1 mRNA increased by 5-fold and the number of Foxp3-positive cells (Foxp3+ cells) decreased 15 days after exposure.
Conclusion:
Intraamniotic LPS exposure caused a proinflammatory response, involution, and a persistent depletion of thymic Foxp3+ cells indicating disturbance of the fetal immune homeostasis.
Keywords: fetal inflammatory response syndrome, prematurity, immune modulation, thymic involution
Introduction
Chorioamnionitis, an intraamniotic inflammation of the chorioamniotic membranes documented by histologic findings or culture, is commonly associated with preterm birth and adverse neonatal outcomes.1,2 Clinical chorioamnionitis can manifest itself with maternal fever, uterine tenderness, and maternal and fetal tachycardia.3,4 However, chorioamnionitis is often a clinically silent infection without maternal symptoms referred to as histological chorioamnionitis.5 By histological examination of the placenta, the diagnosis of chorioamnionitis can be subdivided into acute or chronic depending on the infiltration of neutrophils or lymphocytes, respectively.6,7
Intrauterine exposure to infection or inflammation can have profound effects on fetal lung, gut, and brain development, thereby increasing the risk of respiratory, gastrointestinal, and neurodevelopmental complications.8–11 Therefore, chorioamnionitis has been characterized as a “multiorgan disease of the fetus.”12
Although the systemic inflammatory response of the fetus after intrauterine inflammation has been the focus of ongoing studies, the effects on the inflammatory organs such as the thymus, spleen, and lymph nodes have barely been studied. Clinically, chorioamnionitis is however associated with a decreased thymus size in very low-birth weight preterm infants.13,14 De Felice et al demonstrated that preterm neonates exposed to subclinical chorioamnionitis had smaller thymuses at birth on chest radiographs than preterm neonates without chorioamnionitis.15 Histological examination at autopsy showed severe morphological changes in the fetal thymus with a reduced corticomedullary (CM) ratio and low thymocytes count when fetuses were exposed to intrauterine infection.16 However, these severe changes may not represent the thymic changes that occur in the majority of surviving fetuses exposed to chorioamnionitis.
A small thymus size in preterm infants is a strong indicator of other adverse outcomes such as bronchopulmonary dysplasia17–19 and fetal inflammatory response syndrome.20 Thymic involution in preterm infants is associated with a higher risk for the development of cerebral white matter damage, the major antecedent of cerebral palsy.21 Moreover, a small thymus size at birth can lead to a smaller T-cell repertoire and lower thymic output leading to enhanced vulnerability to infections in later life.22,23 Thymic involution also correlated with the frequency of infections in preterm infants admitted to the neonatal intensive care unit,24,25 with the grade of thymic involution being related to the duration of the illness.26 Although there is a growing body of clinical evidence suggesting that intrauterine infection has profound effects on the fetal and neonatal immune system and the thymus in particular, little is known about the mechanisms by which exposure to in utero infection/inflammation affects the fetal thymus and the consequences of these changes on the function and maturation of the immune system.
Therefore, we characterized the cellular and structural changes in the fetal thymus after exposure to intraamniotic inflammation. We used a preterm lamb model to evaluate the changes in the fetal thymus in a time-related manner after intraamniotic lipopolysaccharide (LPS) injection.27
Materials and Methods
Animal Study
All studies were approved by the Animal Ethics Committees at The University of Western Australia and Cincinnati Children’s Hospital Medical Center. Time-mated ewes with singleton fetuses received a single intraamniotic injection of 10 mg LPS (bolus of 10 mg Escherichia coli 055: B5, Sigma Chemical, St Louis, Missouri, dissolved in saline) resulting in an inflammatory response of the chorioamniotic membranes and systemic inflammation of the fetus,28 5 hours, 12 hours, 24 hours, 2 days, 4 days, 8 days, or 15 days before preterm delivery (n = 6-8; Table 1). No differences were observed between control animals that received saline injections at different time points before delivery and were therefore combined in 1 control group. All lambs were delivered by cesarean section at 125 days gestational age (GA; term = 150 days GA) which corresponds to 28 to 32 weeks in humans,29 a critical period of late development when most preterm infants are born with serious complications. Preterm lambs were euthanized after birth. Cord blood was used for white blood cell counts to measure systemic inflammation. Total white blood cell counts were performed with correction for nucleated red blood cells and differential counts were performed by a single blinded observer. The thymus was collected and tissue was snap frozen or fixed in 10% buffered formalin for 24 hours.
Table 1.
Differential Cell Counts in the Cord Blood.a
| Control (n = 8) | 5 h (n = 6) | 12 h (n = 7) | 24 h (n = 7) | 2 d (n = 6) | 4 d (n = 6) | 8 d (n = 7) | 15 d (n = 7) | |
|---|---|---|---|---|---|---|---|---|
| Lymphocytes, ×109/L | 2.6 ± 0.2 | 1.4 ± 0.2b | 1.4 ± 0.2b | 1.1 ± 0.1b | 1.7 ± 0.3 | 2.9 ± 0.5 | 3.1 ± 0.1 | 2.1 ± 0.2 |
| Neutrophils, ×108/L | 4.1 ± 0.3 | 4.4 ± 0.8 | 3.2 ± 1.1 | 1.6 ± 0.4 | 1.6 ± 0.5 | 9.1 ± 1.4 | 20.1 ± 5.0b | 10.6 ± 4.9 |
| Monocytes, ×108/L | 1.5 ± 0.3 | 0.7 ± 0.3 | 1.3 ± 0.2 | 0.4 ± 0.1 | 1.2 ± 0.5 | 4.1 ± 0.7b | 3.2 ± 0.8 | 2.6 ± 0.9 |
a Data expressed as mean ± SEM.
b P < .05 versus controls.
Immunohistochemistry
Paraffin-embedded thymic sections (4 µm, transverse) were stained for CD3 (A0452, DAKO, Glostrup, Denmark), Foxp3 (14-7979, eBiosciences, San Diego, California), cleaved caspase 3 (Asp175, #9661S, Cell Signaling Technology, Boston, Massachusetts), Ki67 (M7240, DAKO), and RelB (component of nuclear factor κB [NF-κB], sc-266, Santa Cruz Biotechnology, Santa Cruz, California). The sections were deparaffinized and rehydrated in ethanol. Endogenous peroxidase activity was blocked by incubating the sections with 0.3% H2O2 in phosphate-buffered saline (pH 7.4; for CD3 and Foxp3) or in methanol (for cleaved caspase 3, Ki67, and RelB). Antigen retrieval was performed by incubating the sections in heated citrate buffer (10 mmol/L, pH 6.0) for 30 minutes. Nonspecific binding was prevented by incubating the slides for 30 minutes with 5% bovine serum albumin (CD3), 20% normal goat serum (NGS; Foxp3 and RelB), or 5% NGS (Ki67). This step was omitted for cleaved caspase 3. Slides were incubated overnight at 4°C with the diluted primary antibody (CD3 1:200, Foxp3 1:30, cleaved caspase-3 1:200, Ki67 1:50, RelB 1:2000) followed by 1 hour incubation at room temperature with the appropriate secondary biotin-labeled antibody (swine-α-rabbit 1:500, E0353; goat-α-mouse 1:500, E0433, DAKO). The immunostaining was enhanced with Vectastain ABC peroxidase Elite kit (PK-6200, Vector Laboratories, Burlingame, California) followed by nickel sulfate-diaminobenzidine. Sections were counterstained with 0.1% Nuclear Fast Red.
Evaluation was performed by light microscopy (Axioskop 40, Zeiss, Oberkochen, Germany) with LeicaQWin Pro v.3.4.0 software (Leica Microsystems, Wetzlar, Germany). Three images in different lobes of the thymus which were representative for the CD3 and Ki67 staining were taken at ×200 magnification. The percentage of area with CD3 and Ki67 positive staining was measured in these images using Image J software (Rasband, W.S., Image J US National Institutes of Health, Bethesda, Maryland). For the Foxp3, cleaved caspase 3 and RelB staining, positive cells were counted and the average numbers of 3 different high-power fields of different lobes at a ×200 magnification were given.
The morphology of the thymus was evaluated by light microscopy after hematoxylin and eosin staining. The CM ratio was quantified in 3 representative sections at ×2.5 magnification using Image J software.
RNA Extraction and Quantitative Real-Time PCR
Quantitative real-time polymerase chain reaction (PCR) was performed to measure messenger RNA (mRNA) levels of toll-like receptor (TLR)2 and 4 which are the main recognition receptors for Gram-positive and -negative bacteria, interleukin (IL)1, IL6, IL10, IL17, and interferon gamma (IFNγ) which are important cytokines produced in response to inflammation.30 Total RNA was isolated from thymic tissue by Trizol/chloroform extraction and treated with RQ1 DNase (M610A, Promega, Madison, Wisconsin). The digestion of genomic DNA was confirmed by PCR using specific glyceraldehyde-3-phosphate dehydrogenase primers. For the analysis of gene expression, RNA was converted into complementary DNA (cDNA) with the Transcription First Strand cDNA synthesis kit (Roche-Applied, Mannheim, Germany) according to manufacturer’s instructions using anchored oligoprimers. The reverse-transcriptase PCR (RT-PCR) reactions were performed in duplicate with the LightCycler 480 SYBR Green I Master mix (Roche-Applied) on a LightCycler 480 Instrument according to the manufacturer’s instructions with primers based on ovine-specific sequences (Table 2). The RT-PCR results were normalized to ovine 40S ribosomal protein S15 (ovRPS15) and mean fold changes in mRNA expression were calculated by the ΔΔCt method.31
Table 2.
Primers Used for RT-PCR.
| Gene | Sequence (5′-3′) | Amplicon Size | T m | |
|---|---|---|---|---|
| TLR2 | Fw | GGCTGTAATCAGCGTGTTCA | 160 bp | 64°C |
| Rv | GATCTCGTTGTCGGACAGGT | |||
| TLR4 | Fw | GAGAAGACTCAGAAAAGCCTTGCT | 200 bp | 65°C |
| Rv | GCGGGTTGGTTTCTGCAT | |||
| IL1 | Fw | CACTGCCAGAAAATAAGCTGAAAC | 79 bp | 63°C |
| Rv | TGATCAAGCAAATCGCCTGAT | |||
| IL6 | Fw | ACATCGTCGACAAAATCTCTGCAA | 90 bp | 65°C |
| Rv | GCCAGTGTCTCCTTGCTGTTT | |||
| IL10 | Fw | CATGGGCCTGACATCAAGGA | 102 bp | 64°C |
| Rv | CGGAGGGTCTTCAGCTTCTC | |||
| IL17 | Fw | TGTGAGGGTCAACCTGAACAT | 110 bp | 62°C |
| Rv | TGATAATCGGTGGGCCTTCTG | |||
| IFNγ | Fw | TCAAGCAAGACATGTTTCAGAAGTTCT | 65 bp | 60°C |
| Rv | CCGGAATTTGAATCAGCCTTTTGAA | |||
| ovRPS15 | Fw | CGAGATGGTGGGCAGCAT | 93 bp | 60°C |
| Rv | GCTTGATTTCCACCTGGTTGA |
Abbreviations: bp, base pair; Fw, forward; IFN, interferon; IL, interleukin; RT-PCR, reverse-transcriptase polymerase chain reaction; Rv, reverse; TLR, toll-like receptor.
Data Analysis
Results are given as means ± standard error of the means. Groups were compared using 1-way analysis of variance with Dunnett for post hoc analysis or by a nonparametric Kruskal-Wallis test as appropriate. Statistical analysis was performed by GraphPad Prism v5.0. Significance was accepted at P < .05.
Results
Systemic Inflammation
The percentage of neutrophils and monocytes increased significantly in cord blood at 8 days and 4 days after intraamniotic LPS exposure, respectively (Table 1). The percentage of lymphocytes in cord blood decreased within 5 hours after LPS exposure and remained low until 2 days post LPS exposure.
Thymic CM Ratio
Representative images for the thymic CM ratio for controls (Figure 1A) and 8-day LPS-exposed animals are shown in Figure 1B. The CM ratio decreased significantly 24 hours and 8 days after LPS exposure compared to controls (Figure 1C).
Figure 1.

Corticomedullary (CM) ratio.The CM ratio of the thymus was analyzed in hematoxylin and eosin (H&E) sections. Representative images of controls (A) and 8-day lipopolysaccharide (LPS)-exposed animals (B). The CM ratio decreased after 24 hours and 8 days of LPS exposure compared to controls (C). *P < .05 versus controls.
Proliferation and Apoptosis in the Fetal Thymus
Cellular apoptosis and proliferation in the fetal thymus were assessed by immunohistochemical analysis for cleaved caspase 3 and Ki67 in the thymic cortex. The number of cleaved caspase 3 positive cells significantly increased 12 hours after LPS exposure (27 ± 2 positive cells) compared to controls (12 ± 2 positive cells; Figure 2A) indicating increased apoptosis in the fetal thymus. Representative images for controls (Figure 2B) and 12-hour LPS-exposed animals are shown in Figure 2C. The percentage of Ki67-positive cells was decreased 4 days after exposure to LPS (0.2% ± 0.1%) compared to controls (4.1% ± 1%) indicating a decrease in proliferation (Figure 2D). Representative images for controls (Figure 2E) and 4-day LPS-exposed animals are shown in Figure 2F.
Figure 2.

Ki67 and cleaved caspase 3 expression in the fetal thymus.The number of cleaved caspase 3 expressing cells increased in the cortex of the thymus 12 hours after the exposure to LPS compared to controls (A). Representative images of cleaved caspase 3 expression in the thymus for controls (B) and 12-hour LPS-exposed animals (C). The percentage of Ki67-positive cells decreased in the cortex of the thymus 4 days after the exposure to LPS compared to controls (D). Representative images for Ki67 expression in the thymus are shown for controls (E) and 4-day LPS-exposed animals (F). *P < .05 versus controls.
Accumulation of CD3-Positive Thymic T cells
Representative images for CD3-stained thymus tissue for controls, 5-hour LPS-exposed animals, and 8-day LPS-exposed animals are shown in Figure 3A, B, and C, respectively. The percentages of CD3-positive cells in the medulla of the thymus were significantly increased 5 hours (32.48% ± 9.43%), 2 days (26.5% ± 4.61%), and 8 days (26.10% ± 3.60%) after LPS exposure compared to controls (4.22% ± 1.04%; Figure 3D).
Figure 3.

Increased CD3-positive cells in the thymus. The percentage of CD3-positive cells in the medulla of the thymus was evaluated by immunohistochemistry. Representative images of controls (A), 5 hours LPS exposure (B), and 8 days LPS exposure (C). The percentage of CD3-positive cells increased in the medulla of the thymus 5 hours, 2 days, and 8 days after LPS exposure (D). *P < .05 versus controls.
Reduced Foxp3-Positive Cells in Response to LPS
The Foxp3-positive cells (Foxp3+ cells) were primarily detected in the inner medulla of the thymus and are shown for controls (Figure 4A), 4-day LPS-exposed animals (Figure 4B), and 15-day LPS-exposed animals (Figure 4C). These cells significantly decreased 4 days after LPS exposure (2 ± 1 positive cells) when compared to controls (21 ± 4 positive cells; Figure 4D). After normalization at 8 days, Foxp3+ cells decreased 15 days after exposure to LPS (6 ± 3 positive cells).
Figure 4.

Decreased Foxp3-positive cells after LPS exposure. Representative images of Foxp3 expression in the thymus for controls (A), 4 days LPS exposure (B), and 15 days LPS exposure (C). The number of Foxp3-positive cells decreased in the medulla 4 and 15 days after LPS exposure compared to controls (D). *P < .05 versus controls.
Thymic Cytokine mRNA Levels in Response to Intraamniotic LPS
Interleukin 1 mRNA levels increased within 24 hours after LPS exposure and remained elevated until 15 days post LPS treatment, with the highest increase of 10-fold detected 4 days after LPS treatment (Figure 5A). The IL6 mRNA levels were increased 9-fold at 12 hours, 24 hours, 2 days, and 15 days after intraamniotic LPS exposure (Figure 5B). This IL6 increase was paralleled by increased IL17 mRNA levels at 12 hours, 24 hours, 4 days, and 8 days post LPS exposure (Figure 5C). A 4-fold increase in IFNγ mRNA levels was detected at 4, 8, and 15 days (Figure 5D) whereas IL10 mRNA levels were significantly decreased by half-fold in the 5-hour and 2-day LPS groups (Figure 5E).
Figure 5.

Cytokine messenger RNA (mRNA) profile. Interleukin 1 (IL1) mRNA levels (A) increased from 24 hours up to 15 days after the exposure to LPS. The mRNA levels of IL6 (B) increased significantly 12 hours, 24 hours, 2 days, and 15 days after the LPS exposure compared to controls. The IL17 mRNA levels (C) were increased 6-fold at time points 12 hours, 24 hours, 4 days, and 8 days. The interferon γ (IFNγ) mRNA (D) increased up to 5-fold 4, 8, and 15 days after LPS exposure whereas IL10 mRNA levels decreased 5 hours and 2 days after the exposure. *P < .05 versus controls.
Toll-Like Receptor mRNA Levels in the Fetal Thymus
The mRNA levels of TLR2 (Figure 6A) and TLR4 (Figure 6B) in the thymus were analyzed by RT-PCR. The TLR2 mRNA levels were increased at 12 hours after LPS exposure when compared to controls. The mRNA levels of TLR4 almost doubled 24 hours after LPS exposure but decreased to control levels after 2 days of LPS exposure. A second significant increase in TLR4 mRNA levels in the fetal thymus was detected 8 and 15 days after LPS exposure.
Figure 6.
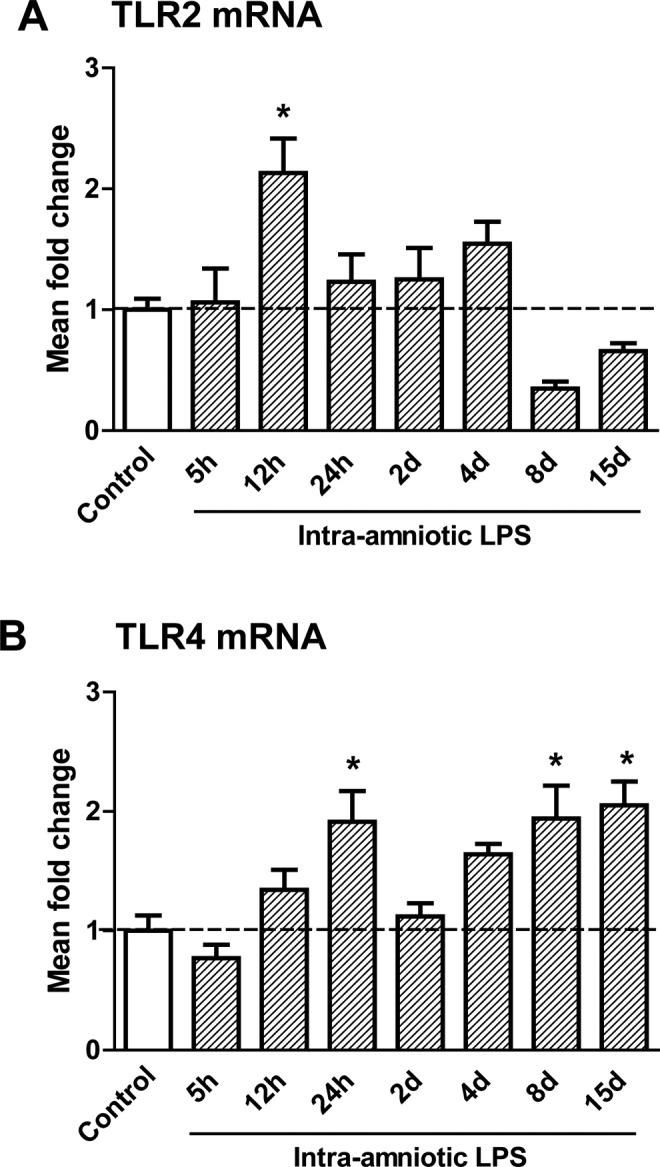
Messenger RNA (mRNA) levels of toll-like receptors (TLR)2 and 4 in the fetal thymus.The TLR2 (A) mRNA increased 12 hours after lipopolysaccharide (LPS) exposure compared to controls. The TLR4 (B) mRNA was increased 2 hours, 8 days, and 15 days after LPS exposure in the fetal thymus. *P < .05 versus controls.
Increased Numbers of NF-κB Positive Cells After LPS Exposure
The NF-κB expression was visualized in thymus sections with immunohistochemistry, as shown for controls (Figure 7A) and 8-day LPS-exposed animals (Figure 7B). Exposure to intraamniotic LPS increased the number of NF-κB positive cells in the medulla of the thymus from 3 ± 1 positive cells in control animals to 33 ± 3 positive cells in the animals exposed to LPS 24 hours before delivery (Figure 7C). The number of NF-κB positive cells increased again to 28 ± 3 positive cells at 8 days.
Figure 7.

Increased number of NF)-κB positive cells increased after LPS exposure.Representative images of NF-κB expression in the thymus are shown for controls (A) and 8-day LPS-exposed animals (B).The number of NF-κB positive cells in the medulla of the thymus increased 24 hours and 8 days after the exposure to intraamniotic lipopolysaccharide (LPS; C). *P < .05 versus controls.
Discussion
We investigated the time interval effects of intraamniotic LPS exposure on the fetal thymus. In preterm fetal sheep, we found that intraamniotic exposure to LPS induced a complex response of time-dependent acute activation and involution of the fetal thymus, with persistent changes of the thymic T-cell composition and cytokine profiles.
Thymic responses to intraamniotic LPS exposure were detected as early as 5 hours after the injection. Acute thymic involution was evident with a decrease in the percentage of blood lymphocytes and CM ratio without large changes in the proliferation or apoptosis rate of the thymocytes. These results of acute thymic involution further refine the findings of Kunzmann et al which showed an early reduction in thymus/body weight of the ovine thymus 2 days after intraamniotic LPS exposure.32 We found significant apoptosis at 12 hours and a decreased CM ratio at 24 hours after exposure. We further identified early increases in mature, CD3-positive T cells and a shift in mRNA cytokine and TLR levels to a proinflammatory microenvironment which is supported by an increase in NF-κB expression. The TLR4 is the main recognition receptor for LPS. Binding of LPS to TLR4 results in induction of the MyD88-dependent pathway, which involves the early phase of NF-κB activation and subsequent production of proinflammatory cytokines which in turn can further stimulate NF-κB activation. In addition, TLR4 activates the MyD88-independent pathway which is known to result in the late phase of NF-κB signaling.30
Intrauterine inflammation can have both acute and long-term effect on thymic T-cell composition.33–35 Melville et al showed that intraamniotic LPS exposure decreased fetal thymic CD8+ and MHC class II cells at 7 days after intraamniotic injection in sheep.35 When sheep were repetitively exposed to intraamniotic LPS at 90, 100, and 110 days of gestation, thymic CD4+ cells increased at term and CD8+ cells decreased in the thymus of animals at 7 weeks of age.33 In the current study, changes in both the cytokine profile and cell composition of the thymus were detectable up to 15 days after LPS exposure. As cytokines play a major role in directing thymic T-cell composition,36 persistent changes in the cytokine profile may explain the altered T-cell subsets in the thymus after intraamniotic LPS exposure. Recently, our group reported that exposure to intraamniotic LPS 7 days before preterm birth altered thymic Sonic Hedgehog (Shh) and bone morphogenetic protein (BMP)4 expression.37 The Shh and BMP4 pathways are crucial to the development of immature thymocytes into mature T cells.38,39 Cytokines such as IL10 can modulate the expression of Shh and BMP4 during this process. Conversely, Shh signaling can regulate the thymic cytokine profile, demonstrating a close interplay between morphogenesis and cytokines on one hand and thymic T-cell development on the other.40–42 Taken together, these data demonstrate that intraamniotic exposure to LPS alters the thymic microenvironment, which should have profound effects on thymic T-cell development and subsequent immune function.
In this model, Foxp3 expression, which is a marker of immunosuppressive regulatory T cells,43 decreased in response to intraamniotic LPS exposure. As the thymus is the major site for regulatory T-cell development,44 depletion of these cells can cause an imbalance in the immune system toward a persistent proinflammatory status. Long-term depletion of Foxp3+ cells may therefore contribute to the inflammatory responses after chorioamnionitis.45–48 Wolfs et al recently showed that in the fetal gut IL-1-induced intrauterine inflammation caused depletion of Foxp3+ cells and an increase in CD4-expressing cells, indicating an imbalance between effector and regulatory T-cells.49 Under the influence of proinflammatory stimuli such as IL6, regulatory T-cells can lose their Foxp3 expression and convert to Th17 cells, which produce IL17 as a potent proinflammatory cytokine.50–52 Since thymic IL6 and IL17 mRNA levels increased after intraamniotic LPS exposure, it is tempting to speculate that an IL6-driven phenotype change in regulatory T cells into Th17 cells might be an important process for the observed depletion of regulatory T cells in the thymus.
In summary, intraamniotic LPS induced acute thymic involution, structural changes, and inflammation of the thymus. Although most changes were reversible, exposure to LPS induced a prolonged increase in proinflammatory cytokines and a depletion of Foxp3+ cells in the fetal thymus, which may alter the response of the fetal immune system in other organ systems such as the lung, gut, and brain. Although the long-term effects of the changes in cell composition and activation of the fetal thymus remain to be further determined, this report highlights the dynamics of the fetal immune response to intrauterine inflammation. These acute changes contribute to a better understanding of how fetal immune regulation could contribute to postnatal diseases as suggested by clinical studies of surviving preterm babies.
Acknowledgments
We would like to thank Richard Stolle, Masatoshi Saito, Shaofu Li, Jennifer Henderson, and Manuel Noben for excellent technical support.
Footnotes
Declaration of Conflicting Interests: The author(s) declared no potential conflicts of interest with respect to the research, authorship, and/or publication of this article.
Funding: The author(s) disclosed receipt of the following financial support for the research, authorship, and/or publication of this article: NIH HD-57869 (SGK) from the National Institute of Health (NIH), USA, the National Health and Medical Research Council of Australia, the Women and Infants Research Foundation, Western Australia, Veni BWK 016.096.141 from the Dutch Scientific Research Organization and the Research School for Oncology and Developmental Biology (GROW), Maastricht University. The funders had no role in study design, data collection and analysis, decision to publish, or preparation of the manuscript.
References
- 1. Goldenberg RL, Hauth JC, Andrews WW. Intrauterine infection and preterm delivery. N Engl J Med. 2000;342(20):1500–1507. [DOI] [PubMed] [Google Scholar]
- 2. Goldenberg RL, Culhane JF, Iams JD, Romero R. Epidemiology and causes of preterm birth. Lancet. 2008(9606);371:75–84. [DOI] [PMC free article] [PubMed] [Google Scholar]
- 3. Redline RW. Placental inflammation. Semin Neonatol. 2004;9(4):265–274. [DOI] [PubMed] [Google Scholar]
- 4. Hagberg H, Wennerholm UB, Savman K. Sequelae of chorioamnionitis. Curr Opin Infect Dis. 2002;15(3):301–306. [DOI] [PubMed] [Google Scholar]
- 5. Goldenberg RL, Hauth JC, Andrews WW. Intrauterine infection and preterm delivery. N Engl J Med. 2000;342(20):1500–1507. [DOI] [PubMed] [Google Scholar]
- 6. Kim CJ, Romero R, Kusanovic JP, et al. The frequency, clinical significance, and pathological features of chronic chorioamnionitis: a lesion associated with spontaneous preterm birth. Mod Pathol. 2010;23(7):1000–1011. [DOI] [PMC free article] [PubMed] [Google Scholar]
- 7. Lee J, Romero R, Xu Y, et al. A signature of maternal anti-fetal rejection in spontaneous preterm birth: chronic chorioamnionitis, anti-human leukocyte antigen antibodies, and C4d. PloS one. 2011;6(2):e16806. [DOI] [PMC free article] [PubMed] [Google Scholar]
- 8. Hartling L, Liang Y, Lacaze-Masmonteil T. Chorioamnionitis as a risk factor for bronchopulmonary dysplasia: a systematic review and meta-analysis. Arch Dis Child Fetal Neonatal Ed. 2012;97(1):F8–F17. [DOI] [PubMed] [Google Scholar]
- 9. Been JV, Lievense S, Zimmermann LJ, Kramer BW, Wolfs TG. Chorioamnionitis as a risk factor for necrotizing enterocolitis: a systematic review and meta-analysis [published online August 21, 2012]. J Pediatr. 2012. [DOI] [PubMed] [Google Scholar]
- 10. Okogbule-Wonodi AC, Gross GW, Sun CC, et al. Necrotizing enterocolitis is associated with ureaplasma colonization in preterm infants. Pediatr Res. 2011;69(5):442–447. [DOI] [PMC free article] [PubMed] [Google Scholar]
- 11. Shatrov JG, Birch SC, Lam LT, Quinlivan JA, McIntyre S, Mendz GL. Chorioamnionitis and cerebral palsy: a meta-analysis. Obstet Gynecol. 2010;116(2):387–392. [DOI] [PubMed] [Google Scholar]
- 12. Gantert M, Been JV, Gavilanes AW, Garnier Y, Zimmermann LJ, Kramer BW. Chorioamnionitis: a multiorgan disease of the fetus? J Perinatol. 2010;30(suppl):S21–S30. [DOI] [PubMed] [Google Scholar]
- 13. Di Naro E, Cromi A, Ghezzi F, et al. Fetal thymic involution: a sonographic marker of the fetal inflammatory response syndrome. Am J Obstet Gynecol. 2006;194(1):153–159. [DOI] [PubMed] [Google Scholar]
- 14. Yinon Y, Zalel Y, Weisz B, et al. Fetal thymus size as a predictor of chorioamnionitis in women with preterm premature rupture of membranes. Ultrasound Obstet Gynecol. 2007;29(6):639–643. [DOI] [PubMed] [Google Scholar]
- 15. De Felice C, Toti P, Santopietro R, Stumpo M, Pecciarini L, Bagnoli F. Small thymus in very low birth weight infants born to mothers with subclinical chorioamnionitis. J Pediatr. 1999;135(3):384–386. [DOI] [PubMed] [Google Scholar]
- 16. Toti P, De Felice C, Stumpo M, et al. Acute thymic involution in fetuses and neonates with chorioamnionitis. Hum Pathol. 2000;31(9):1121–1128. [DOI] [PubMed] [Google Scholar]
- 17. Rosen D, Lee JH, Cuttitta F, Rafiqi F, Degan S, Sunday ME. Accelerated thymic maturation and autoreactive T cells in bronchopulmonary dysplasia. Am J Respir Crit Care Med. 2006;174(1):75–83. [DOI] [PMC free article] [PubMed] [Google Scholar]
- 18. Chen CM, Yu KY, Lin HC, Yeh GC, Hsu HH. Thymus size and its relationship to perinatal events. Acta Paediatr. 2000;89(8):975–978. [DOI] [PubMed] [Google Scholar]
- 19. De Felice C, Latini G, Del Vecchio A, Toti P, Bagnoli F, Petraglia F. Small thymus at birth: a predictive radiographic sign of bronchopulmonary dysplasia. Pediatrics. 2002;110(2):386–388. [DOI] [PubMed] [Google Scholar]
- 20. El-Haieg DO, Zidan AA, El-Nemr MM. The relationship between sonographic fetal thymus size and the components of the systemic fetal inflammatory response syndrome in women with preterm prelabour rupture of membranes. BJOG. 2008;115(7):836–841. [DOI] [PubMed] [Google Scholar]
- 21. Kuban JD, Allred EN, Leviton A. Thymus involution and cerebral white matter damage in extremely low gestational age neonates. Biol Neonate. 2006;90(4):252–257. [DOI] [PubMed] [Google Scholar]
- 22. Aaby P, Marx C, Trautner S, et al. Thymus size at birth is associated with infant mortality: a community study from Guinea-Bissau. Acta Paediatr. 2002;91(6):698–703. [DOI] [PubMed] [Google Scholar]
- 23. Garly ML, Trautner SL, Marx C, et al. Thymus size at 6 months of age and subsequent child mortality. J Pediatr. 2008;153(5):683–688. [DOI] [PubMed] [Google Scholar]
- 24. Jeppesen DL, Ersboll AK, Nielsen SD, Hoppe TU, Valerius NH. Low thymic size in preterm infants in the neonatal intensive care unit, a possible marker of infection? A prospective study from birth to 1 year of age. Acta Paediatr. 2011;100(10):1319–1325. [DOI] [PubMed] [Google Scholar]
- 25. Jeppesen DL, Hasselbalch H, Nielsen SD, et al. Thymic size in preterm neonates: a sonographic study. Acta Paediatr. 2003;92(7):817–822. [PubMed] [Google Scholar]
- 26. Glavina-Durdov M, Springer O, Capkun V, Saratlija-Novakovic Z, Rozic D, Barle M. The grade of acute thymus involution in neonates correlates with the duration of acute illness and with the percentage of lymphocytes in peripheral blood smear. Pathological study. Biol Neonate. 2003;83(4):229–234. [DOI] [PubMed] [Google Scholar]
- 27. Kallapur SG, Willet KE, Jobe AH, Ikegami M, Bachurski CJ. Intra-amniotic endotoxin: chorioamnionitis precedes lung maturation in preterm lambs. Am J Physiol Lung Cell Mol Physiol. 2001;280(3):L527–L536. [DOI] [PubMed] [Google Scholar]
- 28. Kramer BW, Moss TJ, Willet KE, et al. Dose and time response after intraamniotic endotoxin in preterm lambs. Am J Respir Crit Care Med. 2001;164(6):982–988. [DOI] [PubMed] [Google Scholar]
- 29. Wolfs TG, Jellema RK, Turrisi G, Becucci E, Buonocore G, Kramer BW. Inflammation-induced immune suppression of the fetus: a potential link between chorioamnionitis and postnatal early onset sepsis. J Matern Fetal Neonatal Med. 2012;25(suppl 1):8–11. [DOI] [PubMed] [Google Scholar]
- 30. Akira S, Takeda K. Toll-like receptor signalling. Nat Rev Immunol. 2004;4(7):499–511. [DOI] [PubMed] [Google Scholar]
- 31. Livak KJ, Schmittgen TD. Analysis of relative gene expression data using real-time quantitative PCR and the 2(-Delta Delta C(T)) method. Methods. 2001;25(4):402–408. [DOI] [PubMed] [Google Scholar]
- 32. Kunzmann S, Glogger K, Been JV, et al. Thymic changes after chorioamnionitis induced by intraamniotic lipopolysaccharide in fetal sheep. Am J Obstet Gynecol. 2010;202(5):476–485. [DOI] [PMC free article] [PubMed] [Google Scholar]
- 33. Lee AJ, Lambermont VA, Pillow JJ, et al. Fetal responses to lipopolysaccharide-induced chorioamnionitis alter immune and airway responses in 7-week-old sheep. Am J Obstet Gynecol. 2011;204(4):364 e317–e324. [DOI] [PubMed] [Google Scholar]
- 34. Kramer BW, Kallapur SG, Moss TJ, et al. Modulation of fetal inflammatory response on exposure to lipopolysaccharide by chorioamnion, lung, or gut in sheep. Am J Obstet Gynecol. 2011;202(1):77 e71–e79. [DOI] [PMC free article] [PubMed] [Google Scholar]
- 35. Melville JM, Bischof RJ, Meeusen EN, Westover AJ, Moss TJ. Changes in fetal thymic immune cell populations in a sheep model of intrauterine inflammation. Reprod Sci. 2012;19(7):740–747. [DOI] [PubMed] [Google Scholar]
- 36. Sprent J. Burnet oration. T-cell survival and the role of cytokines. Immunol Cell Biol. 2001;79(3):199–206. [DOI] [PubMed] [Google Scholar]
- 37. Kuypers E, Collins JJ, Jellema RK, et al. Ovine fetal thymus response to lipopolysaccharide-induced chorioamnionitis and antenatal corticosteroids. PLoS One. 2012;7(5):e38257. [DOI] [PMC free article] [PubMed] [Google Scholar]
- 38. Sacedon R, Varas A, Hernandez-Lopez C, et al. Expression of hedgehog proteins in the human thymus. J Histochem Cytochem. 2003;51(11):1557–1566. [DOI] [PMC free article] [PubMed] [Google Scholar]
- 39. Hager-Theodorides AL, Outram SV, Shah DK, et al. Bone morphogenetic protein 2/4 signaling regulates early thymocyte differentiation. J Immunol. 2002;169(10):5496–5504. [DOI] [PubMed] [Google Scholar]
- 40. Varas A, Sacedon R, Hidalgo L, et al. Interplay between BMP4 and IL-7 in human intrathymic precursor cells. Cell Cycle. 2009;8(24):4119–4126. [DOI] [PubMed] [Google Scholar]
- 41. Gutierrez-Frias C, Sacedon R, Hernandez-Lopez C, et al. Sonic hedgehog regulates early human thymocyte differentiation by counteracting the IL-7-induced development of CD34+ precursor cells. J Immunol. 2004;173(8):5046–5053. [DOI] [PubMed] [Google Scholar]
- 42. Stewart GA, Lowrey JA, Wakelin SJ, et al. Sonic hedgehog signaling modulates activation of and cytokine production by human peripheral CD4+ T cells. J Immunol. 2002;169(10):5451–5457. [DOI] [PubMed] [Google Scholar]
- 43. Hori S, Nomura T, Sakaguchi S. Control of regulatory T cell development by the transcription factor Foxp3. Science. 2003;299(5609):1057–1061. [DOI] [PubMed] [Google Scholar]
- 44. Bluestone JA, Abbas AK. Natural versus adaptive regulatory T cells. Nat Rev Immunol. 2003;3(3):253–257. [DOI] [PubMed] [Google Scholar]
- 45. Kramer BW, Kramer S, Ikegami M, Jobe AH. Injury, inflammation, and remodeling in fetal sheep lung after intra-amniotic endotoxin. Am J Physiol Lung Cell Mol Physiol. 2002;283(2):L452–L459. [DOI] [PubMed] [Google Scholar]
- 46. Kuypers E, Collins JJ, Kramer BW, et al. Intra-amniotic LPS and antenatal betamethasone: inflammation and maturation in preterm lamb lungs. Am J Physiol Lung Cell Mol Physiol. 2012;302:L380–L389. [DOI] [PMC free article] [PubMed] [Google Scholar]
- 47. Wolfs TG, Buurman WA, Zoer B, et al. Endotoxin induced chorioamnionitis prevents intestinal development during gestation in fetal sheep. PLoS One. 2009;4(6):e5837. [DOI] [PMC free article] [PubMed] [Google Scholar]
- 48. Kemp MW, Saito M, Nitsos I, Jobe AH, Kallapur SG, Newnham JP. Exposure to in utero lipopolysaccharide induces inflammation in the fetal ovine skin. Reprod Sci. 2011;18(1):88–98. [DOI] [PMC free article] [PubMed] [Google Scholar]
- 49. Wolfs TG, Kallapur SG, Polglase GR, et al. IL-1alpha mediated chorioamnionitis induces depletion of FoxP3+ cells and ileal inflammation in the ovine fetal gut. PLoS One. 2011;6(3):e18355. [DOI] [PMC free article] [PubMed] [Google Scholar]
- 50. Bettelli E, Carrier Y, Gao W, et al. Reciprocal developmental pathways for the generation of pathogenic effector TH17 and regulatory T cells. Nature. 2006;441(7090):235–238. [DOI] [PubMed] [Google Scholar]
- 51. Awasthi A, Kuchroo VK. Th17 cells: from precursors to players in inflammation and infection. Int Immunol. 2009;21(5):489–498. [DOI] [PMC free article] [PubMed] [Google Scholar]
- 52. Korn T, Mitsdoerffer M, Croxford AL, et al. IL-6 controls Th17 immunity in vivo by inhibiting the conversion of conventional T cells into Foxp3+ regulatory T cells. Proc Natl Acad Sci U S A. 2008;105(47):18460–18465. [DOI] [PMC free article] [PubMed] [Google Scholar]