

Abstract
The parametric ntPET model (p-ntPET) estimates the kinetics of neurotransmitter release from dynamic PET data with receptor-ligand radiotracers. Here we introduce a linearization (lp-ntPET) that is computationally efficient and can be applied to single-scan data. lp-ntPET employs a non-invasive reference region input function and extends the LSRRM of Alpert et al. (2003) using basis functions to characterize the time course of neurotransmitter activation. In simulation studies, the temporal precision of neurotransmitter profiles estimated by lp-ntPET was similar to that of p-ntPET (standard deviation ~3 min for responses early in the scan) while computation time was reduced by several orders of magnitude. Violations of model assumptions such as activation-induced changes in regional blood flow or specific binding in the reference tissue have negligible effects on lp-ntPET performance. Application of the lp-ntPET method is demonstrated on [11C]raclopride data acquired in rats receiving methamphetamine, which yielded estimated response functions that were in good agreement with simultaneous microdialysis measurements of extracellular dopamine concentration. These results demonstrate that lp-ntPET is a computationally efficient, linear variant of ntPET that can be applied to PET data from single or multiple scan designs to estimate the time course of neurotransmitter activation.
Keywords: basis functions, compartmental modeling, dopamine, neurotransmitter, PET, reference region, tracer kinetics
Introduction
Neurotransmission is central to synaptic signaling in the brain. Acute fluctuations of specific neurotransmitters have been demonstrated in normal motor and cognitive function (Koepp et al., 1998; Badgaiyan et al., 2003; Aalto et al., 2005; Christian et al., 2006), whereas dysregulation of phasic release has been implicated in schizophrenia (Breier et al., 1997; Abi-Dargham et al., 1998; Laruelle et al., 1999), substance abuse (Volkow et al., 1997; Martinez et al., 2005, 2007; Cox et al., 2009; Busto et al., 2009), stress (Oswald et al., 2005, 2007; Wand et al., 2007), and subpopulations of Parkinson's disease patients (de la Fuente-Fernández et al., 2004; Evans et al., 2006; Steeves et al., 2009). Investigators have postulated that the magnitude and temporal kinetics of changes in neurotransmitter concentration represent distinct aspects of the response with differential implications in health, disease, and treatment (Volkow et al., 1995, 1996, 1999; Fried et al., 2001; Olive et al., 2002; Volkow et al., 2002; Volkow and Swanson, 2003; Spencer et al., 2006; Parasrampuria et al., 2007).
PET and SPECT have been applied to image neurotransmitter release using receptor-ligand tracers whose binding is sensitive to the concentration of endogenous neurotransmitter. Data are often analyzed using change in binding potential (ΔBPND; Innis et al., 2007), which reflects an alteration in the number of available receptors between baseline and activation scan conditions. It has been shown that the timing and magnitude of neurotransmitter release are conflated in measures of ΔBPND (Endres and Carson, 1998; Yoder et al., 2004). More sophisticated experiment designs and data analysis techniques have been described (Friston et al., 1997; Aston et al., 2000; Watabe et al., 2000; Pappata et al., 2002; Alpert et al., 2003; Zhou et al., 2006; Ikoma et al., 2009), but these methods either fail to incorporate the dynamic nature of neurotransmitter release or else prescribe the temporal kinetics a priori. Hence these approaches focus on the detection of neurotransmitter release rather than its characterization. It has been suggested that the limited temporal information extracted from in vivo molecular imaging studies has yielded results – and consequently, new hypotheses – that emphasize static aberrations and discount dynamic dysregulation of neurotransmission which may underly certain disease phenotypes (Sarter et al., 2007).
To address the limitations of existing methodologies, we have developed data analysis techniques collectively termed ntPET (for `neurotransmitter PET') which estimate the time course of neurotransmitter release from dynamic PET data with displaceable radiotracers. We have previously described two variants, one that is model-based or “parametric” (p-ntPET; Morris et al., 2005) and another that is data-driven or “non-parametric” (np-ntPET; Constantinescu et al., 2007). Estimating the eleven parameters of the p-ntPET model is computationally intensive. The model-independent np-ntPET method can recover response patterns of arbitrary shape and analyze data more rapidly. However, without an underlying model structure the solutions provided by this method can be more difficult to interpret or constrain to a particular form. Both p-ntPET and np-ntPET require data from two PET sessions, one at the baseline condition and the other during activation (i.e., neurotransmitter-releasing challenge). Analysis methods which require only one scan session (e.g., Friston et al., 1997; Carson et al., 1997; Endres et al., 1997; Pappata et al., 2002; Alpert et al., 2003; Zhou et al., 2006; Ikoma et al., 2009) are desireable to minimize cost, radiation dose, and physiological variation.
Thus, we seek an ntPET method that is computationally efficient and can be applied to data from a single scan session. Here, we extend the LSRRM analysis technique (Alpert et al., 2003) using a basis function approach to obtain a new model-based variant of ntPET, which we call lp-ntPET (`linear parametric ntPET'). By analyzing realistic simulated data we show that the lp-ntPET method performs similarly to p-ntPET, is computationally efficient, is insensitive to plausible violations of model assumptions, and can be used to analyze data from experiments with single or paired scan sessions. We also demonstrate application of the technique to analyze [11C]raclopride data acquired in rats with a dopamine-releasing pharmacological challenge and compare the estimated response profiles to extracellular dopamine concentration measured simultaneously by microdialysis.
Materials and methods
Theory
The lp-ntPET model extends the LSRRM (Alpert et al., 2003) using basis functions to estimate the time course of neurotransmitter activation. The LSRRM is, in turn, a linear extension of the simplified reference tissue model (SRTM; Lammertsma and Hume, 1996). Integration of the SRTM equations yields a formulation that is linear in its parameters,
| (1) |
where CT and CR are concentration of tracer in the target and reference regions, respectively, and the coefficients describe the kinetics of tracer uptake and retention in the tissue. (This integral expression was derived independently by Ichise et al. (2003) and termed the multilinear reference tissue model, or MRTM.) Alpert et al. generalized this model with time-varying parameters that reflect transient changes in radiotracer influx, clearance, and binding. The fluctuations of the parameters during the activation state were described by the time course of the function h(t),
| (2) |
Extending the logic applied previously for exogenous pharmacological competition with a radioligand (Friston et al., 1997) Alpert recognized that k2a, the tracer efflux rate from the collapsed tissue compartment to plasma, was sensitive to radiotracer displacement caused by endogenous neurotransmitter release. The effect of neurotransmission being of primary interest, the impact of changes in tracer delivery and clearance were evaluated separately with a reduced model having one time-varying parameter k2a(t) of the form k2a + γh(t), where k2a is the baseline washout rate constant, h(t) represents the time course of activation and γ encodes the magnitude of its effect on the apparent tissue efflux rate. Provided h(t) is defined in advance, the model can still be expressed in terms of linear parameters:
| (3) |
Alpert et al. set h(t) = e−τ(t−T)u(t − T) where u(t) is the unit step function and T is the time at which the activation is initiated, an expression used previously by Endres and Carson (1998) to model dopamine release elicited by intravenous administration of amphetamine. This mathematical formulation applies to a neurotransmitter response that becomes maximal instantaneously at the onset of the challenge and decays exponentially to baseline thereafter. With the temporal qualities of the response predetermined, applications of LSRRM (Badgaiyan et al., 2003; Christian et al., 2006; Badgaiyan et al., 2007, 2008) have focused on detection of neurotransmitter release by testing whether γ, the response magnitude, was statistically different than zero.
We have extended LSRRM using a basis function approach for the dual purposes of detection and characterization of neurotransmitter responses that may have greater complexity than a single exponential functions. We refer to this model as linear parametric ntPET (lp-ntPET). The basis functions are of the form
| (4) |
where the constituent functions, hi(t), comprise a predefined catalog of candidate response profiles. Because each basis function is constructed from the same measured time activity curve, CT(t), every Bi(t) is affiliated with a unique response function. The operational equation for lp-ntPET is
| (5) |
This relationship can be expressed compactly in standard matrix notation of the form y = Ax. The corresponding linear algebraic equation for analysis of single-scan data is
| (6) |
For analysis of dual-scan data the relevant formula is
| (7) |
where the the superscripts a and b designate PET data from activation and baseline sessions, respectively.
For each basis function the overdetermined system of equations can be solved rapidly using standard algorithms to obtain the weighted least squares estimate of model parameters , where W is the weighting matrix having diagonal elements inversely proportional to the variance of the PET measurement CT contained in the matching row of the matrix equation. The optimal model parameters and activation pattern are identified from the basis function that yields the best model fit to the data. This approach is not unlike the basis function implementation of SRTM (Gunn et al., 1997). However, instead of constructing basis functions that map to different binding potential values (the parameter of interest in SRTM), we employ basis functions that map to distinct neurotransmitter response curves (the vector of interest in lp-ntPET).
In the same manner that Gunn et al. (1997) created basis functions by discretizing the direct search parameter over a physiologically relevant range, the curves included in the family hi(t) were chosen to restrict the search to plausible response functions. As was done previously with p-ntPET, the response profiles were parameterized by gamma variate functions. Here, we have used the formulation of Madsen (1992),
| (8) |
where u(t) is the unit step function and the variables tD (the delay time at which the response starts relative to start of scan), tP (the peak time of maximal response magnitude), and α (the “sharpness” of the function) are incremented over finite intervals. Here we used the following values to discretize the parameters, where tend designates the time at which the scan ended: α equal 0.25, 1, or 4; tD equal −5 to (tend − 10) in increments of 2.5 min; tP equal (tD + 1.25) to (tend − 5) in increments of 2.5 min. Note that the lower limit of tP is conditioned on the value of tD as it is not sensible for a response to peak before it begins, and the limits of both tD and tP are restricted so that only responses which occur during the PET session are evaluated. The permutations of the discretized parameter values yield at total of 897 distinct functions.
A subset of the functions included in the response catalog are plotted in Figure 1A for a fixed onset time. These functions have a variety of shapes and peak times, and resemble neurotransmitter time courses that we might anticipate in response to drug administration or a behavioral task. We note that the model could readily accommodate curves of any arbitrary form if additional information were available to guide the choice of response profiles. Figure 1B depicts the basis functions generated according to Eq (4) using the subset of response functions and a noiseless simulated tissue curve. Note from the operational equation (5) that the basis functions represent the sensitivity curves dCT(t)/dγ for each hi(t), and their distinct shapes distinguish one from another during the optimization process.
Figure 1. Example response and basis functions.
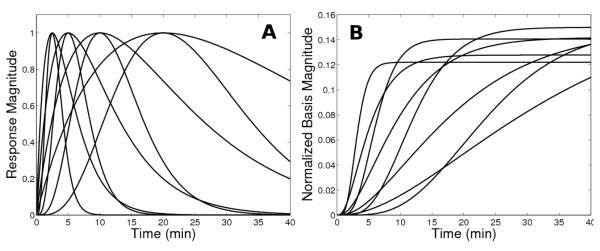
(A) Family of activation responses and (B) basis functions generated from them. To aid visualization, a small subset of functions is displayed and the basis functions are normalized by the integral of the corresponding response function in order to yield bases of a similar scale. Also note that the response curves in this subset all have the same onset time (t=0), whereas the entire set of functions includes profiles with a variety of start times.
The lp-ntPET model has four explicit parameters (R1, k2, k2a, γ) that describe tracer kinetics and response magnitude, and three implicit parameters encoded by the basis functions (tD, tP, α) that describe the time course of the response. This formulation represents a simplification of p-ntPET which relies on the eleven-parameter enhanced receptor model (Morris et al., 1995; Endres et al., 1997) which is an extension of the two-tissue compartment model (Mintun et al., 1984) that explicitly accounts for competition between the tracer and the endogenous neurotransmitter at the receptor sites.
Simulated PET data
Dual-scan data
Realistic simulated PET data with kinetics chosen to resemble [11C]raclopride were generated as previously described (Normandin and Morris, 2008). Briefly, three types of noisy data sets were created: (i) data without model violations, (ii) data with imperfect reference regions biased by specific binding, and (iii) data with activation-induced changes in blood flow. As in Normandin and Morris (2008), changes in regional blood flow were simulated by 10% changes in K1 and k2 starting at the time of activation onset and lasting through the end of the scan. In the target region the parameters were increased and in the reference region were constant or decreased, in order to mimic changes in blood flow previously observed after ethanol administration (Volkow et al., 1988). Each simulated data set consisted of four time activity curves (TACs), corresponding to target and reference region curves during baseline and activation sessions. All cases were replicated for neurotransmitter responses commencing between 0 and 45 minutes in 5 minute increments, the only exception being data with changes in blood flow for which activation always occurred at 15 minutes. Each neurotransmitter response peaked 10 minutes after take-off. “Null” data sets also consisted of four TACs, but neurotransmitter levels were constant during both rest and activation conditions. For each case at a given response start time, 1000 data sets with unique random noise realizations were generated. This approach parallels the tests performed to characterize p-ntPET with reference region-derived input functions (Normandin and Morris, 2008).
It should be noted that lp-ntPET relies on a simplification of the two-tissue compartment model that collapses the free and bound tracer states into a single compartment, but the simulated data were generated using the complete enhanced receptor model (Morris et al., 1995; Endres et al., 1997) with parameters derived from experimental data. Furthermore, none of the response functions in the hi(t) catalog shared the same temporal profile as the neurotransmitter concentration curve used to generate simulated data with the enhanced receptor model.
Single-scan data
Data were created in the same manner as for dual-scan sets as described above, but only TACs from the activation scan were generated and analyzed. All curves were noisy but unbiased. The impact of specific binding in the reference tissue or alteration of blood flow parameters was not assessed for the single-scan paradigm.
Parameter estimation
Optimization algorithms
The lp-ntPET model was fitted to data using linear least squares estimation. Two optimization variants were evaluated. Weighted least squares (WLS) was applied with each weighting factor set inversely proportional to the variance of the corresponding target region PET datum, as is customary in PET analysis (Landaw and DiStefano, 1984; Mazoyer et al., 1986). The WLS solution is unique and can be obtained efficiently using standard algorithms. Because WLS can estimate positive or negative values for gamma, response profiles reflecting increases or decreases in neurotransmitter level can be estimated. Non-negative least squares (NNLS) was also applied with residuals weighted in the same manner. The imposition of a non-negativity constraint necessitates iterative fitting and allows only positive response profiles to be estimated. In p-ntPET estimations reported previously (Morris et al., 2005; Normandin and Morris, 2006, 2008; Morris et al., 2008), we set a lower bound of zero for the scaling factor of the neurotransmitter profile. Therefore, lp-ntPET with NNLS most closely resembles the p-ntPET method.
Use of prior information to constrain fits
The response functions to be evaluated during estimation are chosen at the discretion of the investigator. If information were known about the experiment, for example when the challenge was initiated, one could incorporate that knowledge into the lp-ntPET framework through the exclusion of certain components in the response catalog (i.e., the set of functions hi(t)). For these simulation experiments we selected candidate functions in two ways: (i) using the full catalog of response functions without constraints on response start time, or (ii) by excluding responses starting more than five minutes before the true neurotransmitter response as a way of constraining responses based on prior information (e.g., the experimentally known challenge initiation time). We have previously applied p-ntPET with (Morris, Normandin and Schiffer, 2008) or without (Morris et al., 2005; Normandin and Morris, 2006, 2008) constraints on time of response onset.
Significance testing
Each data set was fitted with both MRTM (1) and lp-ntPET (5). MRTM is a nested model, identical to lp-ntPET absent the activation term. The significance of the responses estimated by lp-ntPET was assessed using model selection criteria and statistical testing on γ, the estimated response magnitude.
For each data set a one-sample location test of the t statistic (Gosset [Student], 1908; Fisher, 1925a) was used to assess whether or not γ was statistically different than zero, indicative of a significant response. For a given fit, the t statistic is the ratio of the estimated parameter to its standard error. The parameter variance for an individual fit was obtained from the Fisher information matrix. This estimate of the variance is often called the Cramér-Rao lower bound (Rao, 1945; Cramér, 1946) and represents the minimum variance achievable by an unbiased estimator. Because the true parameter variance is generally greater than the Cramér-Rao bound, the t statistic calculated using this approximation may be artificially inflated. We therefore calculated “uncorrected” t values using the Cramér-Rao lower bound and “corrected” t values using a Monte Carlo-based estimate of the variance for γ as observed across the 1000 replicate data sets for each simulation case.
Alternatively, a likelihood ratio test was performed using the F statistic (Fisher, 1925b) to compare the goodness of fit of MRTM and lp-ntPET for each data set. Comparing two models where model 1 is nested within (i.e., is a degenerate form of) model 2, the F statistic is given by
| (9) |
where WRS S is the weighted residual sum of squares, p is the number of model parameters, n is the number of data points, and the subscripts designate whether the quantity applies to model 1 or 2. In our application, model 1 is MRTM and model 2 is lp-ntPET. When only two models are considered and an unbiased estimator is used, the F statistic is equal to the the square of the t statistic. In line with our treatment of the t statistic, we calculated the “uncorrected” F statistic according to (9) and the “corrected” F value normalized to reflect the difference between the Cramér-Rao lower bound and the variance determined by Monte Carlo estimation.
Similarly, the Akaike (AIC; Akaike, 1974) and Bayesian (BIC; Schwarz, 1978) information criteria were calculated for MRTM and lp-ntPET fits to each data set. The AIC is given by
| (10) |
and the BIC by
| (11) |
The model with the lowest AIC or BIC is generally considered best. The structure of Akaike weights (Akaike, 1978; Burnham and Anderson, 1998) was used to assign a probability to a given model being best. Briefly, for each model we define Δi = AICi − AICmin, where AICmin is the minimum AIC of all candidate models and the subscript i indexes the M candidate models. Here, we used M=2 to compare MRTM and lp-ntPET with the optimal basis function. For each model the Akaike weight is obtained by
| (12) |
and represents the likelihood that the model is the best among those evaluated. The same procedure can be applied to derive probabilities from the calculated BIC values. In this manner, the AIC and BIC values from MRTM and lp-ntPET fits to each data set were used to test whether the response estimated by lp-ntPET was significant.
For all of the above tests we considered lp-ntPET to have seven parameters. Although only four parameters (R1, k2, k2a, and γ) are explicitly estimated, the basis function search implicitly incorporates the response onset time (tD), peak time (tP), and sharpness (α) into the model.
Experimental PET data
Animal experiments were approved by the Brookhaven National Laboratory Institutional Animal Care and Use Committee. Dynamic PET and microdialysis were performed simultaneously as previously described (Morris, Normandin and Schiffer, 2008). Briefly, dynamic PET data were acquired from rats using a microPET R4 scanner (Concorde Microsystems, Inc., Knoxville, TN) after a bolus administration of [11C]raclopride. Microdialysis was performed simultaneously to assay extracellular dopamine concentration. During the PET acquisition, methamphetamine was infused unilaterally through the microdialysis probe into the right striatum. A control animal underwent the PET-microdialysis experiment but did not receive the drug.
PET images were reconstructed by Fourier rebinning followed by filtered back-projection. Time activity curves were extracted from regions of interest delineated on the left (untreated) and right (cannulated) striata, as well as the cerebellum. As was done previously with p-ntPET (Morris, Normandin and Schiffer, 2008), lp-ntPET was applied using the left striatal data as the rest condition and right striatal data as the activation condition. The cerebellum was used as the reference region.
Results
Analysis of simulated dual-scan data without model violations
Unconstrained fitting
The characterization of neurotransmitter profiles by lp-ntPET was similar using either WLS or NNLS optimization. When prior information was not applied to constrain the timing of estimated profiles, the delay (tD) and peak (tP) time parameters estimated from data with neurotransmitter release starting before 25 min had small biases (< 3 min) and moderate standard deviations (σ = 3 – 6 min). Figure 2A shows the average response estimated using lp-ntPET with NNLS from 1000 data sets having responses starting at 10 min; Figure 2D shows the same for data sets analyzed using WLS optimization. Although temporal resolution deteriorated for later activation, the estimated profiles still clearly resembled the true neurotransmitter curves as depicted in Figure 2B,E for responses starting at 35 min. Timing parameters estimated from null data sets lacking a neurotransmitter response were highly variable (σ ~20 min) and the response profiles had no discernable pattern, as seen in Figure 2C,F.
Figure 2. Unconstrained fits of dual-scan data.

Responses estimated using non-negative (NNLS; panels A–C) or weighted (WLS; panels D–F) least squares from dual-scan data with early (A,D), late (B,E), or no (C,F) NT response. Data were generated without model violations. Solid red curve: average of the estimated responses from 1000 simulated data sets expressed as percentage of the estimated baseline k2a. Dashed red curves: envelope of ±1 standard deviation about the mean. Black curve: true neurotransmitter response. Agreement between true and estimated responses for late activation is good, but degraded compared to data sets with early activation. Responses estimated from null data sets lacking activation are temporally incoherent with the zero magnitude level enclosed within the ±1 s.d. interval.
Constrained fitting
Incorporation of prior information improved the accuracy and precision of neurotransmitter timing parameters. Performance was best for responses starting before 25 min, with small biases (≤ 2 min) and standard deviations (σ = 3 – 4 min) in estimates of both tD and tP. Bias of delay time remained stable for responses occurring throughout the scan duration whereas precision degraded slightly as true response delay time increased, reaching σ = 5 min at tD = 45 min. Later activations led to slightly larger biases (up to ~4.5 min) and variability (σ up to ~6.5 min) in tP. The biases and standard deviations of timing parameters for neurotransmitter responses starting at 15 or 35 min are reported in Table 1. Average responses estimated from data with activation at 35 min are shown in Figure 3A. Analyses of null data yielded responses that lacked temporal coherence, as shown in Figure 3B for challenge without neurotransmitter release at 35 min (that is, null data analyzed with constraint tD ≥ 30 min). Throughout the remainder of this manuscript we report results from the application of lp-ntPET with constrained timing parameters unless otherwise noted.
Table 1.
Bias and precision of estimated timing parameters.
| single-scan | dual-scan | dual-scan (non-ideal ref. region) | dual-scan (task-induced change in blood flow) | |||
|---|---|---|---|---|---|---|
|
|
||||||
| tD = 15 min | WLS | t D | −1.26 (3.53) | 0.77 (3.48) | −0.20 (3.49) | 0.65 (3.41) |
| t P | 1.23 (2.72) | 2.01 (3.19) | 2.14 (3.20) | 1.69 (3.04) | ||
|
| ||||||
| NNLS | t D | −1.78 (3.53) | 1.17 (3.52) | −0.01 (3.54) | 1.09 (3.39) | |
| t P | 1.43 (2.70) | 1.93 (3.21) | 2.12 (3.50) | 1.58 (3.14) | ||
|
| ||||||
| tD = 35 min | WLS | t D | −0.70 (4.23) | 0.46 (4.65) | 0.43 (4.96) | N/A |
| t P | 4.00 (6.62) | 4.02 (6.43) | 4.92 (6.63) | N/A | ||
|
| ||||||
| NNLS | t D | −0.69 (4.33) | 0.75 (4.76) | 0.97 (5.16) | N/A | |
| t P | 3.97 (6.55) | 4.03 (6.05) | 4.87 (6.22) | N/A | ||
Bias and standard deviation (in parentheses) of delay and peak time estimates across 1000 simulated data sets, in units of minutes.
N/A: not applicable.
Figure 3. Constrained fits of single- and dual-scan data.

Comparison of responses estimated by lp-ntPET with WLS from dual-scan (A,B) or single-scan (C,D) data sets for late activation task. Data in upper panels include neurotransmitter release, while those in lower panels are null data sets. Responses were constrained to begin no earlier than five minutes before the challenge initiation. Results are presented as described in Figure 2. Note the strong correspondence between true and estimated responses, and between the performance of the model applied to dual-scan versus single-scan data sets.
True and false positive classification rates for activation at 15 and 35 min are given in Table 2. All significance tests consistently detected true neurotransmitter responses early in the scan using either NNLS or WLS estimation. Model selection criteria (AIC and BIC) and “uncorrected” statistical tests indicated strong significance for activations having start times ranging throughout most of the scan duration. “Corrected” statistical tests (t and F values modified to reflect the observed variance of γ using Monte Carlo-based estimates) consistently designated the estimated responses as significant for early activation. Responses starting later than 25 min were detected with lower sensitivity. False positive rates estimated from null data were high for model selection criteria and uncorrected statistical tests, particularly for data with early responses analyzed using the WLS optimization algorithm. Corrected t and F tests generally had better specificity when WLS was used. False discovery rates from corrected t tests remained high with NNLS estimation.
Table 2.
Sensitivity and specificity of neurotransmitter response detection.
| single-scan | dual-scan | dual-scan (biased input) | dual-scan (task-induced change in blood flow) | |||
|---|---|---|---|---|---|---|
|
|
||||||
| tD = 15 min | WLS | AIC | 0.99 (0.11) | 1.00 (0.38) | 1.00 (0.38) | 1.00 (0.41) |
| BIC | 0.93 (0.02) | 1.00 (0.22) | 1.00 (0.20) | 1.00 (0.23) | ||
| t CR | 1.00 (0.73) | 1.00 (0.76) | 1.00 (0.77) | 1.00 (0.78) | ||
| t MC | 0.50 (0.00) | 1.00 (0.01) | 1.00 (0.01) | 1.00 (0.01) | ||
| F CR | 1.00 (0.17) | 1.00 (0.45) | 1.00 (0.46) | 1.00 (0.48) | ||
| F MC | 0.01 (0.00) | 0.98 (0.00) | 0.99 (0.00) | 0.99 (0.00) | ||
|
| ||||||
| NNLS | AIC | 0.99 (0.12) | 1.00 (0.16) | 1.00 (0.19) | 1.00 (0.23) | |
| BIC | 0.91 (0.02) | 1.00 (0.08) | 1.00 (0.10) | 1.00 (0.12) | ||
| t CR | 1.00 (0.71) | 1.00 (0.37) | 1.00 (0.37) | 1.00 (0.45) | ||
| t MC | 0.89 (0.16) | 1.00 (0.15) | 1.00 (0.14) | 1.00 (0.17) | ||
| F CR | 0.99 (0.19) | 1.00 (0.20) | 1.00 (0.21) | 1.00 (0.27) | ||
| F MC | 0.25 (0.01) | 0.98 (0.05) | 1.00 (0.04) | 0.99 (0.05) | ||
|
| ||||||
| tD = 35 min | WLS | AIC | 1.00 (0.03) | 1.00 (0.22) | 1.00 (0.25) | N/A |
| BIC | 0.97 (0.01) | 0.98 (0.10) | 0.98 (0.11) | N/A | ||
| t CR | 1.00 (0.44) | 1.00 (0.61) | 1.00 (0.63) | N/A | ||
| t MC | 0.01 (0.00) | 0.03 (0.01) | 0.03 (0.01) | N/A | ||
| F CR | 1.00 (0.05) | 1.00 (0.29) | 1.00 (0.32) | N/A | ||
| F MC | 0.00 (0.00) | 0.00 (0.00) | 0.00 (0.00) | N/A | ||
|
| ||||||
| NNLS | AIC | 1.00 (0.03) | 0.99 (0.13) | 0.99 (0.11) | N/A | |
| BIC | 0.97 (0.01) | 0.97 (0.05) | 0.97 (0.04) | N/A | ||
| t CR | 1.00 (0.36) | 1.00 (0.33) | 1.00 (0.27) | N/A | ||
| t MC | 0.01 (0.11) | 0.04 (0.14) | 0.01 (0.09) | N/A | ||
| F CR | 1.00 (0.05) | 0.99 (0.17) | 0.99 (0.10) | N/A | ||
| F MC | 0.00 (0.01) | 0.00 (0.04) | 0.00 (0.02) | N/A | ||
True and false (in parentheses) positive rates for response detection tests with α = 0.01.
AIC: Akaike information criterion. BIC: Bayesian information criterion, t: t test. F: F test. cr: parameter variance from Craméer-Rao bound. mc: parameter variance from Monte Carlo analysis.
Analysis of simulated dual-scan data with non-ideal reference region
The presence of receptors in the reference region had little impact on the performance of lp-ntPET. Estimation of timing parameters was largely insensitive to specific binding in the reference region. Using a non-ideal reference tissue having receptor density equal to 40% of that in the target region, biases and standard deviations of the timing parameters were typically within one minute of those from unbiased data (refer to Table 1). Table 2 highlights classification results obtained using the same biased (reference region) input function. Performance was very similar to the case with an ideal reference region.
Analysis of simulated dual-scan data with change in blood flow during activation
Activation-induced alteration of blood flow resembling changes elicited by ethanol administration had negligible impact on the performance of lp-ntPET. The estimated responses shown in Figure 4 correspond to data having increased blood flow to the target region and decreased blood flow to the reference region during activation (based on [15O]water PET studies (Volkow et al., 1988)). These response profiles are nearly identical to those estimated from data without activation-induced alteration of blood flow. The biases and precision of estimated timing parameters were insensitive to this model violation (Table 1). Sensitivity and specificity of response detection were similar to comparable simulation cases without blood flow changes, although false positive rates were elevated by approximately 50% with NNLS optimization (see Table 2).
Figure 4. Activation-induced change in blood flow.

Responses estimated from dual-scan data with concomitant increased blood flow in the target region and decreased blood flow in reference region during activation. Data shown in upper panels include neurotransmitter release, while those in lower panels are null data sets. Results are presented as described in Figure 2. Changes in blood flow had little impact on the performance of lp-ntPET (compare to results in Figure 2 and Table 1). Outcomes with decreased flow in the reference region (and no effect on the target region) were similar.
Analysis of simulated single-scan data
The temporal characteristics of responses extracted from single-scan data sets (i.e., without a separate baseline session) compared favorably to the profiles estimated from analogous dual-scan data sets, as evidenced by the similarity of estimated responses shown in Figure 3 for dual- vs. single-scan data with activation at 35 min. Timing parameters obtained from single-scan analyses were inaccurate and inconsistent if responses occurred very early in the scan (before 15 min), but converged to performance as good as dual-scan analysis for responses starting at 15–20 min or later (Table 1). Estimated responses were consistently classified as significant across all statistical tests for responses starting at 20 – 25 min, however the sensitivity of corrected statistical tests diminished progressively thereafter. Model selection tests exhibited better specificity with single-scan analyses as compared to analogous dual-scan analyses (Table 2).
Analysis of experimental data
The activation profiles estimated by lp-ntPET with NNLS are compared in Figure 5 to the extracellular dopamine levels measured in the striatum by microdialysis. Panels A–C show the measured data and lp-ntPET results obtained from an animal that received intracranial infusion of methamphetamine. The lp-ntPET fit was statistically better than MRTM (p < 10−7 in all significance tests) and yielded a response profile that was in good temporal agreement with dopamine concentration measured by microdialysis (Figure 5C). The results obtained from a control animal that did not receive drug treatment are shown in Figure 5D–F. The response estimated by lp-ntPET was not statistically significant (p > 0.98 in all significance tests). MRTM, which contains no neurotransmitter response term, provided satisfactory fits when applied simultaneously to baseline and sham data in the control experiment (Figure 5D,E), but was unable to reconcile the rest and activation data in the drug condition (Figure 5A,B).
Figure 5. Simultaneous PET-microdialysis experiments.

Measured data and modeling results obtained from a rat that received intra-cranial infusion of methamphetamine (upper panels, A–C) and a control animal that received a sham infusion (lower panels, D–F). Baseline PET data from left striatum are shown in left panels (A,D) and activation data from right striatum are shown in middle column (B,E). Open circles: striatal PET data. Filled black circles: cerebellar PET data. Solid black curve: model fit obtained by lp-ntPET with WLS optimization. Dashed black curve: MRTM model fit. Neurotransmitter responses measured by microdialysis (left vertical axis) and estimated by lp-ntPET (right vertical axis) are plotted in the right panels (C,F). Filled gray circles: measured microdialysis data. Dashed gray curves: gamma variate function fitted to microdialysis data. Solid black curve: responses estimated by lp-ntPET. In the control animal, lp-ntPET and MRTM provide nearly identical fits (D,E); the response (F) estimated by lp-ntPET is not significant (p > 0.98 in all tests). In the animal that received drug, the fit from the MRTM model (no activation term) is poor while lp-ntPET provides a good fit to the data (A,B); the response estimated by lp-ntPET is significant (p < 10−7 in all tests) and in good agreement with microdialysis measurements of dopamine (C).
Discussion
lp-ntPET was constructed as a basis function augmentation of the linear extension of the simplified reference region model (LSRRM; Alpert et al., 2003). LSRRM incorporated a temporal variation in neurotransmission, which is absent from conventional analysis techniques that typically estimate change in binding potential (ΔBPND). However, the inclusion of temporal qualities was limited because the model used a canonical response function. LSRRM was introduced to address the binary question of whether or not the prescribed response existed in the data. A noteworthy consequence of this limitation was that the onset of the neurotransmitter response needed to be known in advance and, in practice, was fixed to the time of task initiation. The lp-ntPET model is free of this restriction and can therefore estimate the full time course of neurotransmitter release. Our analysis methods may also have alternative applications for characterizing time-varying receptor occupancy by exogenous drugs.
Performance of lp-ntPET: Comparison to p-ntPET
The lp-ntPET model was devised to address the limitations of LSRRM in order to provide a computationally e cient alternative to p-ntPET. We have examined lp-ntPET using the same simulation tests applied previously to characterize the reference region formulation of the p-ntPET model (Normandin and Morris, 2008). When data were noisy but without model violations, both p-ntPET and lp-ntPET exhibited good precision in estimated timing parameters (standard deviation approximately 3–4 min for neurotransmitter responses that starting earlier than 25 min post-injection). p-ntPET was previously tested on responses starting as late as 30 min, and a slight degradation in its temporal precision was observed for later responses. Here, lp-ntPET was evaluated using responses initiated as late as 45 min; a similar trend of reduced precision for later responses was observed.
p-ntPET and lp-ntPET exhibited comparable behavior when applied to data with model violations. The presence of receptors in the reference region, which biases the model input function, caused underestimation of binding potential but did not compromise the ability of either technique to estimate neurotransmitter timing parameters with accuracy and precision. This raises the possibility of using non-ideal reference tissues to improve the signal-to-noise properties of the input function if it can be assumed that neurotransmitter fluctations in the reference region are negligible during the scan and accurate estimation of BPND is not required. These assumptions should be considered and appropriately validated on a case by case basis. The impact of changes in blood flow (alteration of both K1 and k2 coincident with activation) was also negligible for both methods. Changes in K1 alone were detrimental to the performance of both models, affecting sensitivity to neurotransmitter responses and obscuring their timing (data not shown). We note that changes in K1 decoupled from changes in k2 are physiologically implausible for tracers whose transport between blood and tissue is governed by passive diffusion. If such effects did occur they would adversely affect conventional analysis methods as well, as shown previously for ΔBPND (Normandin and Morris, 2008).
Constraints based on prior information
Although the structures of the p-ntPET and lp-ntPET models differ, analogous adaptations can be made to restrict parameters to fixed values or within reasonable bounds based on knowledge of physiology or experimental conditions. Prior information has been used in p-ntPET to constrain the peak time and baseline binding potential (Normandin and Morris, 2008; Morris et al., 2008). Said constraints were imposed via penalty functions, terms added to the objective function which promote solutions having particular qualities (e.g., responses that peak during scan period). We can also incorporate prior information into the optimization of lp-ntPET. For instance, the member functions hi(t) of the response catalog were chosen to exclude responses whose maximum occured after the end of the scan. Similarly, it is possible to use an independent measurement of binding potential at rest to substitute for either k2 or k2a to reduce the number of estimated parameters. (In MRTM, BPND is given by (k2/k2a) − 1, which also holds in lp-ntPET for the binding potential of baseline data.) Thus the p-ntPET and lp-ntPET models are similar not only in their performance but also in their abilities to accommodate prior information.
Magnitude of estimated responses
Like SRTM, lp-ntPET is based on a one-tissue compartment model. Neurotransmitter concentration is incorporated implicitly via time-varying change in k2a, the rate of tracer efflux from the tissue compartment. In our simulations, which are based on an enhanced model that explicitly includes neurotransmitter concentration, the maximum receptor occupancy by released neurotransmitter was less than 30%. If we assume that neurotransmitter binding to receptors is instantaneous, the resulting increase in occupancy translates to an increase in apparent washout rate of 26%. This is in excellent agreement with the estimated peak values of k2a(t) at ~30% above baseline (see Figures 2–4).
We further note that the magnitude of neurotransmitter release examined in our simulations in physiologically plausible. Consider microdialysis findings following i.v. amphetamine administered to rhesus monkeys reported in Endres et al. (1997). Peak receptor occupancies by dopamine were estimated to be 52% and 62% following amphetamine doses of 0.2 mg/kg and 0.4 mg/kg, respectively. By comparison, we can classify our simulations based on 30% peak occupancy and ΔBPND less than 20% (Normandin and Morris, 2008) as conservative.
Statistical detection of responses
Another difference between lp-ntPET and p-ntPET is the manner by which significant responses are detected. The p-ntPET model utilizes a threshold on the peak height of the estimated response to determine its significance. Here, we have evaluated a battery of statistical tests and model selection criteria to assess the significance of responses estimated by lp-ntPET. The p-ntPET model accurately classified responses for activation starting as late as 30 min (Normandin and Morris, 2008). Using model selection criteria and “uncorrected” statistical tests, lp-ntPET reliably detected true neurotransmitter responses starting as late as 35 to 40 min into the scan. “Corrected” statistical tests using Monte Carlo estimates of parameter variance were less sensitive to responses after 25 min (see Table 2). All detection methods showed high false discovery rates, particularly for dual-scan analyses with WLS optimization.
The false positive rates obtained for single-scan data sets also tended to be high but were in better agreement with the anticipated specificity based on the selected significance level (α = 0.01 in the simulation studies presented here). However, the responses estimated from single-scan null data deviated from ideal behavior. The average magnitude across repeated simulations was biased toward positive values (Figure 3D). While this was not a surprising finding for NNLS optimization, where decreases in neurotransmitter below baseline levels were not permitted, the behavior was not expected with WLS estimation. The same skewness toward positive γ values was not seen in analogous dual-scan data sets (see Figures 2C,F and 3B), suggesting that the etiology of the phenomenon lies in the experiment design and not intrinsic model deficiencies. We hypothesize that without a complete rest scan the model cannot unambiguously distinguish tracer washout from neurotransmitter release. The use of a bolus-plus-infusion protocol to achieve steady-state might eliminate such transient confounds. The bolus-plus-infusion protocol could also provide a more uniform signal-to-noise ratio over the scan duration, reducing the time-dependence of sensitivity and specificity. Although we found activation-induced changes in blood flow to have minimal impact on the performance of lp-ntPET, the use of a bolus-plus-infusion protocol should further mitigate its impact (Carson et al., 1997). Bolus-plus-infusion administration of tracer for both rest and activation sessions might also increase the reliability of dual-scan analyses.
Application of lp-ntPET relies on significance testing to establish that γ is non-zero (i.e., fits are statistically better with a time-varying activation term than without). Each of the tests evaluated here has limitations in this application. One limitation is that the γ values estimated from null data sets do not conform to an unbiased Gaussian distribution. With WLS the model always invokes a non-zero response to reduce the sum of squares. With NNLS the non-negativity constraint imposes a positive bias. Hence uncorrected t and F tests are not for the analysis of null data and tend to exaggerate the significance of estimated responses. Corrected t and F tests using a Monte Carlo-derived estimate of parameter error do not correct the distribution of γ and cannot be readily applied to the analysis of experimental data sets. On the other hand, AIC and BIC rely on the quality of the model fit to the data. Results from these measures were in better agreement with theoretical expectations, although AIC and BIC still exhibited relatively high false positive rates (see Table 2). We posit that lp-ntPET sometimes invoked small responses to compensate for partial inadequacy of the underlying simplfied model, as evidenced by WLS fits to null data which yield average estimated responses that are insubstantial but not identically zero (Figures 2F and 3B,D). Of the significance tests investigated here, BIC showed the best combination of sensitivity and specificity. We therefore advise using BIC with lp-ntPET. The NNLS optimization method generally had lower false positive rates using model selection tests than the WLS algorithm. NNLS is appropriate if it is known a priori whether neurotransmitter changes will increase or decrease. If such information is known in advance and the increased computation time (discussed in next section) is acceptable, NNLS is recommended as a more selective algorithm than WLS.
The generally unsatisfying performance of statistical tests for discrimination of significant responses warrants further examination. A hybrid analysis approach might utilize lp-ntPET to estimate neurotransmitter kinetics in combination with more conventional analysis methods such as binding potential for assessment of response significance. ΔBPND is frequently used to detect changes in neurotransmitter levels between baseline and activation scan sessions. Although this method has known deficiencies for temporally variable responses in paired bolus experiments (Yoder et al., 2004), ΔBPND is proportional to the integral of the neurotransmitter release profile in equilibrium studies (Endres and Carson, 1998). In addition to yielding steady-state conditions, bolus-plus-infusion tracer adminstration permits measurement of ΔBPND in single-scan studies (Carson et al., 1997; Endres et al., 1997; Endres and Carson, 1998). Thus, ΔBPND or other standard analyses could potentially be used to screen or mask data sets for detection of significant activation profiles estimated by lp-ntPET, even in single-scan experiments.
Computational efficiency
The most noteworthy difference between p-ntPET and lp-ntPET is in computational burden. p-ntPET relies on a compartmental model characterized by eleven parameters. Estimation of these parameters requires iterative, non-linear fitting. Because the fits exhibited some sensitivity to initial parameter guess, we fit each data set fifty times with different initial parameter values. The entire procedure takes approximately 60 to 90 minutes for a typical data set using the Levenberg-Marquardt algorithm on a standard computer workstation. lp-ntPET is based on a simplified compartmental model and has just four explicit parameters, all of which occur as linear coefficients in the operational equation. Although the model must be fitted to the data multiple times (once per basis function), each fit is very fast and requires iteration only if NNLS is used. Analysis of a typical dual-scan data set with a full catalog of response functions took less than 1.5 seconds using NNLS and less than 0.1 seconds using WLS. This represents a reduction in computation time of several orders of magnitude over p-ntPET with otherwise very similar performance.
The efficiency of lp-ntPET makes it practical to perform voxel-by-voxel analysis of the whole brain, an intractible task for p-ntPET. The resulting parametric images of γ could be processed using the well established framework of statistical parametric mapping (SPM; Friston et al., 1995) for detection of significant responses. In addition to facilitating statistical testing, the ability to perform parametric analysis with lp-ntPET would permit investigation of spatially and functionally heterogeneous responses or localized activation patterns that might be diluted using pre-defined regions of interest. Voxelwise analysis with lp-ntPET could produce informative visualizations, including 4D (3D in space, 1D in time) neurotransmitter “movies” or parametric images of key response parameters (e.g., time of peak neurotransmitter response), such as those generated from fMRI data (Marota et al., 2000) and recently demonstrated using results from non-parametric ntPET (Morris et al., 2010). These possibilities motivate ongoing work to evaluate the efficacy of denoising techniques (e.g., Zhou et al., 2003; Alpert et al., 2006; Joshi et al., 2008; Christian et al., 2010) and develop adaptations of lp-ntPET (such as constraining baseline ΔBPND as described above, or using a global clearance rate for the reference region as in SRTM2 (Wu and Carson, 2002) and MRTM2 (Ichise et al., 2003)) to promote robust performance on noisy voxel-level data.
Conclusion
The lp-ntPET technique presented here is a basis function augmentation of the LSRRM method. LSRRM assumes that the time course of activation is known, and in particular, that the response onset coincides with task initiation. Our extension is more flexible. It permits temporal characterization of neurotransmitter fluctuations, including estimation of the response onset, peak time, and sharpness. Analysis of realistic simulated data demonstrated that the performance of lp-ntPET is similar to that of p-ntPET, which relies on an elaborate compartmental model to estimate the time course of neurotransmitter release. Computation time was several orders of magnitude faster using lp-ntPET. Simulation studies revealed that lp-ntPET is insensitive to anticipated model violations and may be applied to single-scan paradigms. Activation profiles estimated from PET data acquired in rats receiving methamphetamine were in good agreement with simultaneous microdialysis measurements of dopamine concentration. These results support the use of lp-ntPET as an efficient and practical technique for estimation of neurotransmitter dynamics from PET data.
Research Highlights
-
➢
A basis function model estimates neurotransmitter kinetics from PET data.
-
➢
Estimated neurotransmitter profiles have temporal precision of ~3 min.
-
➢
The model can analyze single-scan data and is insensitive to model violations.
-
➢
Dopamine responses estimated from rats agree with simultaneous microdialysis.
-
➢
Performance is similar to an alternative method, but orders of magnitude faster.
Acknowledgments
M.D. Normandin acknowledges the support of the L.A. Geddes Fellowship and the Society of Nuclear Medicine Student Fellowship. E.D. Morris acknowledges the support of NIH grant R21 AA015077 and the Whitaker Foundation grants RG 02-0126 and TF 04-0034.
Footnotes
Publisher's Disclaimer: This is a PDF file of an unedited manuscript that has been accepted for publication. As a service to our customers we are providing this early version of the manuscript. The manuscript will undergo copyediting, typesetting, and review of the resulting proof before it is published in its final citable form. Please note that during the production process errors may be discovered which could affect the content, and all legal disclaimers that apply to the journal pertain.
References
- Aalto S, Brück A, Laine M, Någren K, Rinne JO. Frontal and temporal dopamine release during working memory and attention tasks in healthy humans: a positron emission tomography study using the high-affinity dopamine D2 receptor ligand [11C]FLB 457. The Journal of Neuroscience. 2005;25:2471–7. doi: 10.1523/JNEUROSCI.2097-04.2005. [DOI] [PMC free article] [PubMed] [Google Scholar]
- Abi-Dargham A, Gil R, Krystal J, Baldwin RM, Seibyl JP, Bowers M, Van Dyck CH, Charney DS, Innis RB, Laruelle M. Increased Striatal Dopamine Transmission in Schizophrenia: Confirmation in a Second Cohort. Am. J. Psychiatry. 1998;155:761–767. doi: 10.1176/ajp.155.6.761. [DOI] [PubMed] [Google Scholar]
- Akaike H. A New Look at the Statistical Model Identification. IEEE Trans Automatic Control. 1974;19:716–23. [Google Scholar]
- Akaike H. A Bayesian analysis of the minimum AIC procedure. Ann Inst Stat Math. 1978;30:9–14. [Google Scholar]
- Alpert NM, Badgaiyan RD, Livni E, Fischman AJ. A novel method for noninvasive detection of neuromodulatory changes in specific neurotransmitter systems. NeuroImage. 2003;19:1049–60. doi: 10.1016/s1053-8119(03)00186-1. [DOI] [PubMed] [Google Scholar]
- Alpert NM, Reilhac A, Chio TC, Selesnick I. Optimization of dynamic measurement of receptor kinetics by wavelet denoising. NeuroImage. 2006;30:444–51. doi: 10.1016/j.neuroimage.2005.09.031. [DOI] [PubMed] [Google Scholar]
- Aston JA, Gunn RN, Worsley KJ, Ma Y, Evans AC, Dagher A. A Statistical Method for the Analysis of Positron Emission Tomography Neuroreceptor Ligand Data. NeuroImage. 2000;12:245–256. doi: 10.1006/nimg.2000.0620. [DOI] [PubMed] [Google Scholar]
- Badgaiyan RD, Fischman AJ, Alpert NM. Striatal dopamine release during unrewarded motor task in human volunteers. NeuroReport. 2003;14:1421–4. doi: 10.1097/00001756-200308060-00003. [DOI] [PubMed] [Google Scholar]
- Badgaiyan RD, Fischman AJ, Alpert NM. Striatal dopamine release in sequential learning. NeuroImage. 2007;38:549–56. doi: 10.1016/j.neuroimage.2007.07.052. [DOI] [PMC free article] [PubMed] [Google Scholar]
- Badgaiyan RD, Fischman AJ, Alpert NM. Explicit motor memory activates the striatal dopamine system. NeuroReport. 2008;19:409–12. doi: 10.1097/WNR.0b013e3282f6435f. [DOI] [PubMed] [Google Scholar]
- Breier A, Su TP, Saunders R, Carson RE, Kolachana BS, de Bartolomeis A, Weinberger DR, Weisenfeld N, Malhotra AK, Eckelman WC, Pickar D. Schizophrenia is associated with elevated amphetamine-induced synaptic dopamine concentrations: Evidence from a novel positron emission tomography method. Proceedings of the National Academy of Sciences. 1997;94:2569–74. doi: 10.1073/pnas.94.6.2569. [DOI] [PMC free article] [PubMed] [Google Scholar]
- Burnham KP, Anderson DR. Model Selection and Inference: A Practical Information-Theoretic Approach. Springer-Verlag; New York: 1998. [Google Scholar]
- Busto UE, Redden L, Mayberg H, Kapur S, Houle S, Zawertailo LA. Dopaminergic activity in depressed smokers: a positron emission tomography study. Synapse. 2009;63:681–9. doi: 10.1002/syn.20646. [DOI] [PMC free article] [PubMed] [Google Scholar]
- Carson RE, Breier A, de Bartolomeis A, Saunders RC, Su TP, Schmall B, Der MG, Pickar D, Eckelman WC. Quantification of amphetamine-induced changes in [11C]raclopride binding with continuous infusion. J Cereb Blood Flow Metab. 1997;17:437–47. doi: 10.1097/00004647-199704000-00009. [DOI] [PubMed] [Google Scholar]
- Christian BT, Lehrer DS, Shi B, Narayanan TK, Strohmeyer PS, Buchsbaum MS, Mantil JC. Measuring dopamine neuromodulation in the thalamus: Using [F-18]fallypride PET to study dopamine release during a spatial attention task. NeuroImage. 2006;31:139–152. doi: 10.1016/j.neuroimage.2005.11.052. [DOI] [PubMed] [Google Scholar]
- Christian BT, Vandehey NT, Floberg JM, Mistretta CA. Dynamic PET Denoising with HYPR Processing. Journal of Nuclear Medicine. 2010;51:1147–1154. doi: 10.2967/jnumed.109.073999. [DOI] [PMC free article] [PubMed] [Google Scholar]
- Constantinescu CC, Bouman C, Morris ED. Nonparametric extraction of transient changes in neurotransmitter concentration from dynamic PET data. IEEE Transactions on Medical Imaging. 2007;26:359–73. doi: 10.1109/TMI.2006.891501. [DOI] [PubMed] [Google Scholar]
- Cox SML, Benkelfat C, Dagher A, Delaney JS, Durand F, McKenzie SA, Kolivakis T, Casey KF, Leyton M. Striatal dopamine responses to intranasal cocaine self-administration in humans. Biological Psychiatry. 2009;65:846–50. doi: 10.1016/j.biopsych.2009.01.021. [DOI] [PubMed] [Google Scholar]
- Cramér H. Mathematical Method of Statistics. Princeton University Press; 1946. [Google Scholar]
- Endres CJ, Carson RE. Assessment of dynamic neurotransmitter changes with bolus or infusion delivery of neuroreceptor ligands. J Cereb Blood Flow Metab. 1998;18:1196–210. doi: 10.1097/00004647-199811000-00006. [DOI] [PubMed] [Google Scholar]
- Endres CJ, Kolachana BS, Saunders RC, Su T, Weinberger D, Breier A, Eckelman WC, Carson RE. Kinetic modeling of [11C]raclopride: combined PET-microdialysis studies. J Cereb Bloob Flow Metab. 1997;17:932–942. doi: 10.1097/00004647-199709000-00002. [DOI] [PubMed] [Google Scholar]
- Evans AH, Pavese N, Lawrence AD, Tai YF, Appel S, Doder M, Brooks DJ, Lees AJ, Piccini P. Compulsive drug use linked to sensitized ventral striatal dopamine transmission. Annals of Neurology. 2006;59:852–8. doi: 10.1002/ana.20822. [DOI] [PubMed] [Google Scholar]
- Fisher RA. Applications of “Student's” distribution. Metron. 1925a;5:90–104. [Google Scholar]
- Fisher RA. Statistical Methods for Research Workers. Oliver and Boyd; Edinburgh: 1925b. [Google Scholar]
- Fried I, Wilson CL, Morrow JW, Cameron KA, Behnke ED, Ackerson LC, Maidment NT. Increased dopamine release in the human amygdala during performance of cognitive tasks. Nature neuroscience. 2001;4:201–6. doi: 10.1038/84041. [DOI] [PubMed] [Google Scholar]
- Friston K, Malizia A, Wilson S, Cunningham V, Jones T, Nutt D. Analysis of dynamic radioligand displacement or “activation” studies. J Cereb Blood Flow Metab. 1997;17:80–93. doi: 10.1097/00004647-199701000-00011. [DOI] [PubMed] [Google Scholar]
- Friston KJ, Holmes AP, Worsley KJ, Poline JP, Frith CD, Frackowiak RSJ. Statistical parametric maps in functional imaging: A general linear approach. Human Brain Mapping. 1995;2:189–210. [Google Scholar]
- de la Fuente-Fernández R, Sossi V, Huang Z, Furtado S, Lu JQ, Calne DB, Ruth TJ, Stoessl a.J. Levodopa-induced changes in synaptic dopamine levels increase with progression of Parkinson's disease: implications for dyskinesias. Brain. 2004;127:2747–54. doi: 10.1093/brain/awh290. [DOI] [PubMed] [Google Scholar]
- Gosset WS., Student The probable error of a mean. Biometrika. 1908;6:1–25. [Google Scholar]
- Gunn RN, Lammertsma AA, Hume SP, Cunningham VJ. Parametric imaging of ligand-receptor binding in PET using a simplified reference region model. Neuroimage. 1997;6:279–87. doi: 10.1006/nimg.1997.0303. [DOI] [PubMed] [Google Scholar]
- Ichise M, Liow JS, Lu JQ, Takano A, Model K, Toyama H, Suhara T, Suzuki K, Innis RB, Carson RE. Linearized reference tissue parametric imaging methods: Application to [11C]DASB positron emission tomography studies of the serotonin transporter in human brain. J Cereb Blood Flow Metab. 2003;23:1096–112. doi: 10.1097/01.WCB.0000085441.37552.CA. [DOI] [PubMed] [Google Scholar]
- Ikoma Y, Watabe H, Hayashi T, Miyake Y, Teramoto N, Minato K, Iida H. Quantitative evaluation of changes in binding potential with a simplified reference tissue model and multiple injections of [11C]raclopride. NeuroImage. 2009;47:1639–48. doi: 10.1016/j.neuroimage.2009.05.099. [DOI] [PubMed] [Google Scholar]
- Innis RB, Cunningham VJ, Delforge J, Fujita M, Gjedde A, Gunn RN, Holden J, Houle S, Huang SC, Ichise M, Iida H, Ito H, Kimura Y, Koeppe RA, Knudsen GM, Knuuti J, Lammertsma AA, Laruelle M, Logan J, Maguire RP, Mintun MA, Morris ED, Parsey R, Price JC, Slifstein M, Sossi V, Suhara T, Votaw JR, Wong DF, Carson RE. Consensus nomenclature for in vivo imaging of reversibly binding radioligands. J Cereb Blood Flow Metab. 2007;27:1533–9. doi: 10.1038/sj.jcbfm.9600493. [DOI] [PubMed] [Google Scholar]
- Joshi A, Fessler JA, Koeppe RA. Improving PET receptor binding estimates from Logan plots using principal component analysis. Journal of Cerebral Blood Flow and Metabolism. 2008;28:852–65. doi: 10.1038/sj.jcbfm.9600584. [DOI] [PMC free article] [PubMed] [Google Scholar]
- Koepp MJ, Gunn RN, Lawrence AD, Cunningham VJ, Dagher A, Jones T, Brooks DJ, Bench CJ, Grasby PM. Evidence for striatal dopamine release during a video game. Nature. 1998;393:266–268. doi: 10.1038/30498. [DOI] [PubMed] [Google Scholar]
- Lammertsma AA, Hume SP. Simplified reference tissue model for PET receptor studies. NeuroImage. 1996;4:153–8. doi: 10.1006/nimg.1996.0066. [DOI] [PubMed] [Google Scholar]
- Landaw EM, DiStefano JJ. Multiexponential, multicompartmental, and non-compartmental modeling. II. Data analysis and statistical considerations. Am J Physiol. 1984;246:R665–77. doi: 10.1152/ajpregu.1984.246.5.R665. [DOI] [PubMed] [Google Scholar]
- Laruelle M, Abi-dargham A, Gil R, Kegeles L, Innis R. Increased dopamine transmission in schizophrenia: relationship to illness phases. Biological Psychiatry. 1999;46:56–72. doi: 10.1016/s0006-3223(99)00067-0. [DOI] [PubMed] [Google Scholar]
- Madsen MT. A simplified formulation of the gamma variate function. Physics in Medicine and Biology. 1992;37:1597–1600. [Google Scholar]
- Marota JJ, Mandeville JB, Weissko RM, Moskowitz M.a., Rosen BR, Kosofsky BE. Cocaine activation discriminates dopaminergic projections by temporal response: an fMRI study in Rat. NeuroImage. 2000;11:13–23. doi: 10.1006/nimg.1999.0520. [DOI] [PubMed] [Google Scholar]
- Martinez D, Gil R, Slifstein M, Hwang DR, Huang Y, Perez A, Kegeles L, Talbot P, Evans S, Krystal J, Laruelle M, Abi-Dargham A. Alcohol dependence is associated with blunted dopamine transmission in the ventral striatum. Biological psychiatry. 2005;58:779–86. doi: 10.1016/j.biopsych.2005.04.044. [DOI] [PubMed] [Google Scholar]
- Martinez D, Narendran R, Foltin RW, Slifstein M, Hwang DR, Broft A, Huang Y, Cooper TB, Fischman MW, Kleber HD, Laruelle M. Amphetamine-induced dopamine release: markedly blunted in cocaine dependence and predictive of the choice to self-administer cocaine. The American journal of psychiatry. 2007;164:622–9. doi: 10.1176/ajp.2007.164.4.622. [DOI] [PubMed] [Google Scholar]
- Mazoyer BM, Huesman RH, Budinger TF, Knittel BL. Dynamic PET data analysis. J Comput Assist Tomogr. 1986;10:645–653. doi: 10.1097/00004728-198607000-00020. [DOI] [PubMed] [Google Scholar]
- Mintun MA, Raichle ME, Kilbourn MR, Wooten GF, Welch MJ. A quantitative model for the in vivo assessment of drug binding sites with positron emission tomography. Ann Neurol. 1984;15:217–27. doi: 10.1002/ana.410150302. [DOI] [PubMed] [Google Scholar]
- Morris ED, Constantinescu CC, Sullivan JM, Normandin MD, Christopher LA. Noninvasive visualization of human dopamine dynamics from PET images. NeuroImage. 2010;51:135–144. doi: 10.1016/j.neuroimage.2009.12.082. [DOI] [PMC free article] [PubMed] [Google Scholar]
- Morris ED, Fisher RE, Alpert NM, Rauch S, Fischman AJ. In vivo imaging of neuromodulation using positron emission tomography: Optimal ligand characteristics and task length for detection of activation. Human Brain Mapping. 1995;3:35–55. [Google Scholar]
- Morris ED, Normandin MD, Schiffer WK. Initial comparison of ntPET with microdialysis measurements of methamphetamine-induced dopamine release in rats: support for estimation of dopamine curves from PET data. Mol Imaging Biol. 2008;10:67–73. doi: 10.1007/s11307-007-0124-1. [DOI] [PubMed] [Google Scholar]
- Morris ED, Yoder KK, Wang C, Normandin MD, Zheng QH, Mock B, Muzic RF, Jr, Froehlich JC. ntPET: a new application of PET imaging for characterizing the kinetics of endogenous neurotransmitter release. Mol Imaging. 2005;4:473–89. doi: 10.2310/7290.2005.05130. [DOI] [PubMed] [Google Scholar]
- Normandin MD, Morris ED. Temporal resolution of ntPET using either arterial or reference region-derived plasma input functions. Conf Proc IEEE Eng Med Biol Soc. 2006;1:2005–8. doi: 10.1109/IEMBS.2006.259716. [DOI] [PubMed] [Google Scholar]
- Normandin MD, Morris ED. Estimating neurotransmitter kinetics with nt-PET: a simulation study of temporal precision and effects of biased data. NeuroImage. 2008;39:1162–79. doi: 10.1016/j.neuroimage.2007.09.046. [DOI] [PMC free article] [PubMed] [Google Scholar]
- Olive MF, Nannini MA, Ou CJ, Koenig HN, Hodge CW. Effects of acute acamprosate and homotaurine on ethanol intake and ethanol-stimulated mesolimbic dopamine release. European Journal of Pharmacology. 2002;437:55–61. doi: 10.1016/s0014-2999(02)01272-4. [DOI] [PubMed] [Google Scholar]
- Oswald LM, Wong DF, McCaul M, Zhou Y, Kuwabara H, Choi L, Brasic J, Wand GS. Relationships among ventral striatal dopamine release, cortisol secretion, and subjective responses to amphetamine. Neuropsychopharmacology. 2005;30:821–32. doi: 10.1038/sj.npp.1300667. [DOI] [PubMed] [Google Scholar]
- Oswald LM, Wong DF, Zhou Y, Kumar A, Brasic J, Alexander M, Ye W, Kuwabara H, Hilton J, Wand GS. Impulsivity and chronic stress are associated with amphetamine-induced striatal dopamine release. NeuroImage. 2007;36:153–66. doi: 10.1016/j.neuroimage.2007.01.055. [DOI] [PubMed] [Google Scholar]
- Pappata S, Dehaene S, Poline JB, Gregoire MC, Jobert A, Delforge J, Frouin V, Bottlaender M, Dolle F, Di Giamberardino L, Syrota A. In vivo detection of striatal dopamine release during reward: a PET study with [11C]raclopride and a single dynamic scan approach. NeuroImage. 2002;16:1015–27. doi: 10.1006/nimg.2002.1121. [DOI] [PubMed] [Google Scholar]
- Parasrampuria DA, Schoedel KA, Schuller R, Gu J, Ciccone P, Silber SA, Sellers EM. Assessment of pharmacokinetics and pharmacodynamic effects related to abuse potential of a unique oral osmotic-controlled extended-release methylphenidate formulation in humans. Journal of Clinical Pharmacology. 2007;47:1476–88. doi: 10.1177/0091270007308615. [DOI] [PubMed] [Google Scholar]
- Rao C. Information and the accuracy attainable in the estimation of statistical parameters. Bull Calcutta Math Soc. 1945;37:81–9. [Google Scholar]
- Sarter M, Bruno J, Parikh V. Abnormal neurotransmitter release in behavioral and cognitive disorders: toward concepts of dynamic and function-specific dysregulation. Neuropsychopharmacology. 2007;32:1452–1461. doi: 10.1038/sj.npp.1301285. [DOI] [PubMed] [Google Scholar]
- Schwarz G. Estimating the dimension of a model. Annals of Statistics. 1978;6:461–4. [Google Scholar]
- Spencer TJ, Biederman J, Ciccone PE, Madras BK, Dougherty DD, Bonab AA, Livni E, Parasrampuria DA, Fischman AJ. PET study examining pharmacokinetics, detection and likeability, and dopamine transporter receptor occupancy of short- and long-acting oral methylphenidate. American Journal of Psychiatry. 2006;163:387–95. doi: 10.1176/appi.ajp.163.3.387. [DOI] [PubMed] [Google Scholar]
- Steeves TDL, Miyasaki J, Zurowski M, Lang AE, Pelleccia G, Van Eimeren T, Rusjan P, Houle S, Strafella AP. Increased striatal dopamine release in Parkinsonian patients with pathological gambling: a [11C]raclopride PET study. Brain. 2009;132:1376–1385. doi: 10.1093/brain/awp054. [DOI] [PMC free article] [PubMed] [Google Scholar]
- Volkow ND, Ding YS, Fowler JS, Wang GJ. Cocaine addiction: hypothesis derived from imaging studies with PET. Journal of Addictive Diseases. 1996;15:55–71. doi: 10.1300/J069v15n04_04. [DOI] [PubMed] [Google Scholar]
- Volkow ND, Ding YS, Fowler JS, Wang GJ, Logan J, Gatley JS, Dewey S, Ashby C, Liebermann J, Hitzemann R, Wolf AP. Is Methylphenidate Like Cocaine? Studies on Their Pharmacokinetics and Distribution in the Human Brain. Archives of General Psychiatry. 1995:456–463. doi: 10.1001/archpsyc.1995.03950180042006. [DOI] [PubMed] [Google Scholar]
- Volkow ND, Fowler JS, Wang GJ, Ding YS, Gatley SJ. Role of dopamine in the therapeutic and reinforcing effects of methylphenidate in humans: results from imaging studies. European neuropsychopharmacology : the journal of the European College of Neuropsychopharmacology. 2002;12:557–66. doi: 10.1016/s0924-977x(02)00104-9. [DOI] [PubMed] [Google Scholar]
- Volkow ND, Mullani N, Gould L, Adler SS, Guynn RW, Overall JE, Dewey S. Effects Flow of Acute Measured Alcohol Intoxication With PET on Cerebral Blood. New York. 1988;24:201–209. doi: 10.1016/0165-1781(88)90063-7. [DOI] [PubMed] [Google Scholar]
- Volkow ND, Swanson JM. Variables That Affect the Clinical Use and Abuse of Methylphenidate in the Treatment of ADHD. American Journal of Psychiatry. 2003;160:1909–1918. doi: 10.1176/appi.ajp.160.11.1909. [DOI] [PubMed] [Google Scholar]
- Volkow ND, Wang GJ, Fowler JS, Fischman M, Foltin R, Abumrad NN, Gatley SJ, Logan J, Wong C, Gifford A, Ding YS, Hitzemann R, Pappas N. Methylphenidate and cocaine have a similar in vivo potency to block dopamine transporters in the human brain. Life Sciences. 1999;65:PL7–PL12. doi: 10.1016/s0024-3205(99)00225-8. [DOI] [PubMed] [Google Scholar]
- Volkow ND, Wang GJ, Fowler JS, Logan J, Gatley SJ, Hitzemann R, Chen AD, Dewey SL, Pappas N. Decreased striatal dopaminergic responsiveness in detoxified cocaine-dependent subjects. Nature. 1997;386:830–833. doi: 10.1038/386830a0. [DOI] [PubMed] [Google Scholar]
- Wand GS, Oswald LM, McCaul ME, Wong DF, Johnson E, Zhou Y, Kuwabara H, Kumar A. Association of amphetamine-induced striatal dopamine release and cortisol responses to psychological stress. Neuropsychopharmacology. 2007;32:2310–20. doi: 10.1038/sj.npp.1301373. [DOI] [PubMed] [Google Scholar]
- Watabe H, Endres CJ, Breier A, Schmall B, Eckelman WC, Carson RE. Measurement of dopamine release with continuous infusion of [11C]raclopride: optimization and signal-to-noise considerations. J Nucl Med. 2000;41:522–30. [PubMed] [Google Scholar]
- Wu Y, Carson RE. Noise reduction in the simplified reference tissue model for neuroreceptor functional imaging. J Cereb Blood Flow Metab. 2002;22:1440–52. doi: 10.1097/01.WCB.0000033967.83623.34. [DOI] [PubMed] [Google Scholar]
- Yoder KK, Wang C, Morris ED. Change in binding potential as a quantitative index of neurotransmitter release is highly sensitive to relative timing and kinetics of the tracer and the endogenous ligand. J Nucl Med. 2004;45:903–11. [PubMed] [Google Scholar]
- Zhou Y, Chen MK, Endres CJ, Ye W, Brasic JR, Alexander M, Crabb AH, Guilarte TR, Wong DF. An extended simplified reference tissue model for the quantification of dynamic PET with amphetamine challenge. NeuroImage. 2006;33:550–63. doi: 10.1016/j.neuroimage.2006.06.038. [DOI] [PubMed] [Google Scholar]
- Zhou Y, Endres CJ, Brasic JR, Huang SC, Wong DF. Linear regression with spatial constraint to generate parametric images of ligand-receptor dynamic PET studies with a simplified reference tissue model. Neuroimage. 2003;18:975–89. doi: 10.1016/s1053-8119(03)00017-x. [DOI] [PubMed] [Google Scholar]