

Abstract
One of the major intracellular barriers to non-viral gene delivery is efficient endosomal escape. The incorporation of histidine residues into polymeric constructs has been found to increase endosomal escape via the proton sponge effect. Statistical and diblock copolymers of N-(2-hydroxypropyl)methacrylamide (HPMA), oligolysine, and oligohistidine were synthesized via reversible-addition fragmentation chain transfer (RAFT) polymerization, and tested for in vitro transfection efficiency, buffering ability, and polyplex uptake mechanism via the use of chemical endocytic inhibitors. Interestingly, histidine-containing statistical and diblock polymers exhibited increased buffer capacity in different endosomal pH ranges. Statistical copolymers transfected better than block copolymers that contained similar amounts of histidine. In addition, only the polymer containing the highest incorporation of oligohistidine residues led to increases in transfection efficiency over the HPMA-oligolysine base polymer. Thus, for these polymer architectures, high histidine incorporation may be required for efficient endosomal escape. Furthermore, uptake studies indicate that non-acidified caveolae-mediated endocytosis may be the primary route of transfection for these copolymers, suggesting that alternative approaches for increasing endosomal escape may be beneficial for enhancing transfection efficiency with these HPMA-oligolysine copolymers.
Keywords: non-viral gene delivery, endosomal buffering, RAFT polymerization, peptide-mediated delivery, brush copolymers
Introduction
Non-viral vectors, such as lipids and polymers, have been used frequently for the delivery of nucleic acids because of their ease of use in vitro and improved safety profiles in vivo over viral vectors1. However, transfection efficiencies from these systems are generally lower than their viral counterparts. Non-viral vectors have achieved limited success in gene delivery because of multiple intracellular barriers1,2. In particular, one of the major barriers to efficient non-viral gene delivery is trapping of internalized particles in endo/lysosomal compartments3,4. One proposed mechanism for endosomal release of polymers is the “proton sponge effect” whereby polymers that buffer within the pH range of 5–7 facilitate an osmotic swelling of endosomes that leads to content release5. A commonly used cationic polymer, branched polyethylenimine (bPEI), is composed of repeating monomers containing weakly basic amines to facilitate the proton sponge effect. PEI is hypothesized to achieve high transfection efficiencies due to its ability to escape endosomal compartments6.
Several reports have studied the use of histidine-based materials as gene carriers since the imidazole ring is a weak base with pKa ~67,8. These studies have shown that the incorporation of histidine into polymeric gene delivery vehicles increases the endosomal buffering capacity of the polymer, improving the efficiency of endosomal escape9,10. For example, poly(L-lysine) (PLL) grafted with 18-mer of poly(L-histidine) residues resulted in increased transfection efficiency over PLL alone11. Branched polymers consisting of a lysine core and lysine-histidine peptide branches also showed increased transfection efficiency with higher histidine content12. Other chemical gene delivery vectors modified with histidine or imidazole have been extensively reviewed elsewhere8.
We have previously shown that statistical copolymers of N-(2-hydroxypropyl)methacrylamide (HPMA), oligo(L-lysine), and oligo(L-histidine) can be synthesized via reversible addition-fragmentation chain transfer (RAFT) polymerization13. The use of living radical polymerization techniques, such as RAFT polymerization, has been gaining in popularity in gene transfer applications due to the ability to synthesize narrowly-disperse, well-defined polymers14,15. Recently, optimized formulations of HPMA-oligolysine copolymers showed transfection efficiencies almost as high as those of bPEI even though the HPMA copolymers did not contain a moiety for endosomal escape16.
Previous reports have demonstrated that various polymer architectures significantly affect transfection efficiency and cellular toxicity17–20. The objective of this study is to further improve the gene delivery ability of HPMA-oligolysine copolymers through the incorporation of histidine moieties. In this work, several statistical or block brush-like copolymers were synthesized with varying percentages of histidine-containing peptides. Evaluation of these materials included investigation of buffering capacity, mechanism of cellular uptake and transfection efficiency, and toxicity profiles to cultured cells.
Materials and Methods
Materials
N-(2-hydroxypropyl)methacrylamide (HPMA) was purchased from Polysciences (Warrington, PA). The initiator VA-044 was purchased from Wako Chemicals USA (Richmond, VA). Chain transfer agent ethyl cyanovaleric trithiocarbonate (ECT) was a generous gift from Dr. Anthony Convertine (University of Washington). Rink amide resin was purchased from Merck Chemical Int. (Darmstadt, Germany). HBTU, Fmoc-protected lysine, and Trt-protected histidine were purchased from Aapptec (Louisville, KY). All cell culture reagents were purchased from Cellgro/Mediatech (Fisher Scientific, Pittsburgh, PA). All other materials, including poly(ethylenimine) (PEI, 25,000 g/mol, branched), poly(L-lysine) (PLL, 12,000 – 24,000 g/mol), chlorpromazine hydrochloride, genistein (synthetic), amiloride hydrochloride, bafilomycin A1, and chloroquine disphosphate salt were reagent grade or better and were purchased from Sigma-Aldrich (St. Louis, MO) unless otherwise stated. Endotoxin-free plasmid pCMV-Luc2 was prepared by using the pGL4.10 vector (Promega, Madison, WI) and inserting the CMV promoter/intron region from the gWiz Luciferase (Aldevron, Madison, WI). The plasmid was isolated and produced with the Qiagen Plasmid Giga kit (Qiagen, Germany) according to the manufacturer’s instructions.
Synthesis of peptides and peptide monomers
Oligo(L-lysine) (K12 and K10) and oligo(L-histidine) (K6H5 and K5H5) peptide monomers were synthesized on a solid support of Rink amide resin (100–200 mesh) via standard Fmoc/tBu chemistry on an automated peptide synthesizer. Prior to cleavage, peptide monomers were modified with Fmoc-protected 1-aminohexanoic acid (Ahx) or Fmoc-protected cysteine. To provide methacrylamido functionality, peptides were capped with methacryloyl chloride21 or coupled with N-succinimidyl methacrylate. The solid support was then rinsed with DMF, DCM, and methanol, and allowed to dry overnight prior peptide cleavage. Methacrylamido-functionalized AhxK10, AhxK12, AhxK6H5, and AhxK5H5 peptides (termed MaAhxK10, MaAhxK12, MaAhxK6H5, and MaAhxK5H5, respectively) were cleaved off the resin by treating the solid support with TFA/triisopropylsilane (TIPS)/1,3 dimethoxybenzene (DMB) (9.25:2.5:5, v/v/v) for 3 h under gentle mixing. Cys-K5H5 (CK5H5) was cleaved from resin by treating the solid support with TFA/DMB/TIPS/EDT (90:5:2.5:2.5, v/v/v/v). Cleaved peptide monomers were precipitated in cold ether, dissolved in methanol, re-precipitated in cold ether, dissolved in water, and then lyophilized to obtain a fluffy, white solid. Peptide monomer purity and composition was determined via RP-HPLC and MALDI-TOF MS, respectively. Peptides were determined to be > 90% pure by RP-HPLC after peptide cleavage and used in polymerization reactions as is. MALDI-TOF MS was determined for the following peptides: MaAhxK12 (MH+) calculated 1736.54, found 1736.364; MaAhxK10 (MH+) calculated 1479.98, found 1480.026; MaAhxK6H5 (MH+) calculated 1653.20, found 1653.129; MaAhxK5H5 (MH+) calculated 1525.01, found 1525.351; CK5H5 (MH+) calculated 1446.81, found 1446.79.
Synthesis of statistical HPMA copolymers by RAFT polymerization
Copolymers of HPMA- co-AhxK12 (pSlo0), HPMA-co-AhxK12-co-AhxK6H5 (pSlo1 and pSlo2), HPMA-co-AhxK10 (pShi0), HPMA-co-AhxK10-co-AhxK5H5 (pShi1 and pShi2), or HPMA were synthesized via reversible-addition fragmentation chain transfer (RAFT) polymerization as previously described13, using ethyl cyanovaleric trithiocarbonate (ECT, MW 263.4 g/mol)22 as the chain transfer agent (CTA) and VA-044 as the initiator (I). The monomers were dissolved and sonicated in acetate buffer (1 M in dH2O, pH 5.1) such that the final monomer concentration was 1 M. For pSlo0, pSlo1, and pSlo2, 26.05 mg (10.66 μmol), 13.02 mg (5.33 μmol), and 19.54 mg (7.99 μmol) of MaAhxK12, respectively, and 0 mg, 12.40 mg (6.18 μmol), and 12.40 mg (6.18 μmol) of MaAhxK6H5, respectively, was used in the polymerization reaction. For pShi0, pShi1, and pShi2, 44.40 mg (21.45 μmol), 38.85 mg (18.77 μmol), and 22.20 mg (10.72 μmol) of MaAhxK10, respectively, and 0 mg, 11.44 mg (6.29 μmol), and 45.75 mg (25.14 μmol) of MaAhxK5H5, respectively, was used. The molar ratio of CTA/I was 10, and the DP used was 190. The reaction mixture was added to a 5 mL reaction vessel in the following order: ECT (100 mg/mL in DMSO), peptide monomer/HPMA mixture, and VA-044 (10 mg/mL in acetate buffer). The reaction vessels were then sealed with a rubber septum and purged with N2 gas for 10 min prior to incubation in an oil bath (44 °C) for 48 h. The copolymer solution was then dissolved in water, dialyzed against dH2O to remove unreacted monomers and buffer salts, lyophilized, and stored at −20 °C. The final yield after dialysis ranged from 58% to 86% of the theoretical yield.
Synthesis of oligohistidine-grafted diblock copolymers poly[(HPMA-g-CK5H5)-b-(HPMA-co-AhxK10)]
The synthesis and characterization of the macroCTA poly(HPMA-co-PDSMA) and diblock poly[(HPMA-co-PDSMA)-b-(HPMA-co-AhxK10)] (pB0) was carried out as previously described23. Peptide conjugation to the diblock copolymer to obtain poly[(HPMA-g-CK5H5)-b-(HPMA-co-AhxK10)] (pB1) was completed as previously reported, but with a few modifications23. In a 10 mL flame-dried pear-shaped flask, 25 mg (0.34 μmol polymer, 2.7 μmol PDS groups) of the diblock copolymer was dissolved in 0.9 mL saline buffer (0.5 M NaCl, 20 mM HEPES, pH 7.1). Afterwards, 9.4 mg (6.48 μmol, 2.3 equiv. relative to the diblock copolymer PDS groups) of Cys-K5H5, dissolved in 1.3 mL saline buffer, was added to the flask and allowed to stir under argon at room temperature overnight. The released 2-thio-pyridine was monitored by absorbance at λ343 nm to determine the extent of the conjugation reaction. The reaction mixture was passed through a PD-10 desalting column to remove unreacted species, and lyophilized.
Polymer characterization
Molecular weight analysis of the copolymers was carried out by gel permeation chromatography (GPC) as previously described, using a miniDAWN TREOS light scattering detector (Wyatt, Santa Barbara, CA) and an Optilab rEX refractive index detector (Wyatt). Absolute molecular weight averages (Mn and Mw) and dn/dc values were calculated using ASTRA software (Wyatt). The dn/dc value for each copolymer was 0.133 mL/g. The content of lysine- and histidine-containing peptides within the HPMA copolymers were determined by amino acid analysis, using 1-amino-2-propanol, lysine, and histidine as standards, as previously described16,23.
Acid-base titration
The buffering capacity of polymers was determined by acid-base titration. Polymer was dissolved in 15 mL dH2O to yield a 1 mM lysine concentration. For PEI, 1 mM total amine concentration was used. The pH of the solution was increased to 10.0 with 1 M NaOH, and then titrated with 0.1 N HCl. Buffer capacity, β, was calculated as previously described24, using the following equation:
where ΔAmol is the change of the moles of acid added. Values were calculated from interpolation with a 3rd-order polynomial from pH 5.1 to 7.4 (GraphPad Prism v.6).
Polyplex formulation and characterization
Stock solutions of polymers and peptides were prepared at 10 mg/mL in 0.1X phosphate buffered saline (PBS), and the pH was adjusted to 6.5 by adding 0.1 N HCl. To formulate polyplexes, pCMV-Luc2 plasmid DNA was diluted to 0.1 mg/mL in DNase/RNase-free H2O and mixed with an equal volume of polymer at desired lysine to DNA phosphate (N/P) ratios. Polyplexes were then allowed to incubate for 10 min at room temperature. For in vitro transfections, 20 μL of the polyplex solution (containing 1 μg DNA) was mixed with 180 μL of Opti-MEM medium (Invitrogen). The particle size of the polyplexes was determined by mixing 20 μL of the polyplex solution with either 20 μL of 0.2 μm-filtered dH2O or 20 μL of 2X PBS. The polyplex solutions were incubated for 15 min at room temperature prior to particle sizing by dynamic light scattering (DLS) (ZetaPlus, Brookhaven Instruments Corp., Novato, CA). Particle sizing measurements were performed at a wavelength of 659.0 nm with a detection angle of 90° at room temperature, and calculated using the viscosity (0.890 cP) and refractive index (1.330) of water at 25 °C. Particle sizes are expressed as effective diameters using a log-normal distribution. For ζ potential measurements, 20 μL of polyplexes were formulated with 1 μg DNA, incubated for 15 min, diluted with 180 μL dH2O, and 800 μL 10 mM NaCl. ζ potential was determined using a ZetaSizer Nano ZS (Malvern Instruments Inc., Southborough, MA) using the Smoluchowsky model for aqueous suspensions. Transmission electron microscopy was completed exactly as previously described23. The particle width, length, and aspect ratio (length/width) were measured and calculated using ImageJ.
Cell culture
Hela (human cervical carcinoma) and COS-7 (African green monkey kidney fibroblast) cells were grown in minimum essential medium (MEM) and Dulbecco’s modified eagle medium (DMEM), respectively, supplemented with 10% FBS and 100 IU penicillin, 100 μg/mL streptomycin, and 0.25 μg/mL amphotericin B. Cells were passaged when they reached ~80% confluency.
In vitro transfection
HeLa and COS-7 cells were seeded overnight in 24-well plates at a density of 3 × 10⁴ cells per well (1 mL/well) at 37 °C, 5% CO2. Polyplexes were formulated as described above. After the polyplexes were formed, 20 μL (containing 1 μg DNA) was mixed with 180 μL of Opti-MEM medium (Invitrogen). Seeded cells were washed once with PBS and then treated with 200 μL of polyplexes in Opti-MEM, which was added dropwise on top of the cells. After a 4 h incubation at 37 °C, 5% CO2 in a humidified environment, the cells were washed once again with PBS and incubated in 1 mL of fresh complete medium for an additional 44 h. Cells were harvested and assayed for luciferase expression at 48 h. This was done by washing cells once with PBS, adding of 200 μL reporter lysis buffer (Promega, Madison, WI), and then performing one freeze-thaw cycle to complete the lysis of cells. Lysates were collected and centrifuged at 14,000g for 15 min. Luminescence was carried out following the manufacturer’s instructions (Promega, Madison, WI). Luciferase activity is reported in relative light units (RLU) normalized by mg protein (RLU/mg), as measured by a microBCA Protein Assay Kit (Pierce).
In vitro transfection with chemical inhibitors
Stock solutions of genistein (5 mg/mL in DMSO), chlorpromazine (1 mg/mL in DMSO), amiloride (2.5 mg/mL), chloroquine (20 mM in water), bafilomycin A1 (0.1 mg/mL in DMSO) were further diluted to working concentrations in OptiMEM (genistein, 50 μg/mL, chlorpromazine, 10 μg/mL, amiloride, 25 μg/mL, chloroquine, 200 μM, bafilomycin A1, 150 nM), and sterile-filtered for transfections. For transfection with inhibitors, HeLa and COS-7 cells were seeded overnight in 24-well plates at a density of 3 × 10⁴ cells per well (1 mL/well) at 37 °C, 5% CO2. Polyplexes were formulated as described above. Cells were washed once with PBS and pre-treated with one of the chemical inhibitors (in OptiMEM) for 1 h at 37 °C, 5% CO2 prior to polyplex transfection. 20 μL of polyplexes were then added to the cells and incubated for an additional 2 h at 37 °C, 5% CO2. Cells were then washed once with PBS and incubated with fresh complete media for an additional 46 h. Cells were lysed and assayed for luciferase expression as described above.
Statistical analysis
The data are represented as the mean and standard deviations. Data were analyzed using the two-tailed Student’s t-test and a p-value of less than or equal to 0.05 was taken as significant.
Results and Discussion
Synthesis of HPMA-co-oligolysine-co-oligohistidine polymers
Three sets of HPMA copolymers with varying percentages of oligo(L-lysine) (K12 or K10) peptide and oligo(L-histidine)-containing peptide (K6H5 or K5H5) were synthesized via RAFT polymerization (Figure 1, Table 1). The pS polymers are statistical copolymers of HPMA, oligo(L-lysine) monomers, and oligo(L-histidine)-containing monomers (Figure 1A, molecule 1). The “lo” and “hi” subscripts refers to the peptide incorporation ratio, where “lo” polymers contain < 3.0 mmol lysine per g polymer and “hi” polymers contain ≥ 3.0 mmol lysine per g polymer. The pB polymers are block copolymers of the aforementioned monomers synthesized by copolymerizing HPMA and pyridyl disulfide methacrylamide (PDSMA) to form one block, and then chain-extending with HPMA and oligo(L-lysine) monomer to form the second block (pB0, Figure 1B, molecule 2). To synthesize pB1, cysteine-modified K5H5 was grafted onto the first block via disulfide exchange between the pyridyl disulfide moiety on the polymer and cysteine on the oligo(L-histidine)-containing peptide (Figure 1B, molecule 3). K12 and K6H5 peptides were used in pSlo copolymers as a follow-up to initial studies13; however, optimization of oligolysine peptide length in later studies16 prompted the synthesis of statistical and diblock HPMA copolymers with K10 and K5H5 peptides in the pShi and pB copolymers. Therefore, the pShi and pB polymer series will be the focus of this study.
Figure 1.

Schematic of statistical and diblock polymer synthesis. (A) RAFT polymerization of statistical HPMA polymers containing oligo(L-lysine) and oligo(L-histidine) peptides (pSlo and pShi series, Molecule 1). (B) RAFT polymerization of HPMA and PDSMA, and then chain-extension with HPMA and oligo(L-lysine) to form pB0 (Molecule 2). Disulfide exchange between the pyridyl disulfide on 2 and cysteine-functionalized oligo(L-histidine) peptides yields pB1 (Molecule 3).
Table 1.
Characterization of HPMA-oligolysine-oligohistidine brush polymers
| Polymer | Targeted Mn (kD) | Determined Mn (kD) | Mw/Mn | mol % K12*/K10** monomer | mol % K6H5*/K5H5** monomer | mmol K/g polymer | mmol H/g polymer |
|---|---|---|---|---|---|---|---|
| pSlo0* | 57.48 | 51.27 | 1.14 | 6.74 | 0 | 2.71 | 0 |
| pSlo1* | 56.69 | 48.71 | 1.20 | 5.80 | 0.98 | 2.46 | 0.206 |
| pS1o2* | 64.27 | 54.22 | 1.03 | 5.83 | 2.62 | 2.36 | 0.532 |
| pShi0** | 78.01 | 77.60 | 1.18 | 20.0 | 0 | 3.78 | 0 |
| pShi1** | 84.73 | 84.79 | 1.08 | 17.6 | 6.21 | 3.53 | 0.530 |
| pShi2** | 105.1 | 101.8 | 1.54 | 9.53 | 16.32 | 2.95 | 1.36 |
| pB0** | 78.0 | 74.0 | 1.2 | 17.0 | 0 | 3.61 | 0 |
| pB1** | - | 76.1 | 1.2 | 12.37 | 4.91 | 3.28 | 0.533 |
Polymers with “lo” lysine incorporation contain *K12 and K6H5 peptides, while polymers with “hi” lysine incorporation contain **K10 and K5H5 peptides.
RAFT polymerization of HPMA, oligolysine, and oligohistidine peptide monomers resulted in statistical copolymers with close to target molecular weights (within ~20% of target Mn) and low polydispersity (≤ 1.2), except for the polymer pShi2, which had a slightly higher polydispersity (PD = 1.54) (Supplemental Figure 1). The relatively high polydispersity of pShi2 may be due to the lower pKa of oligohistidine residues, which can lead to aminolysis of the trithiocarbonate chain transfer agent during the polymerization reaction25. Attempts to incorporate AhxH5 or more AhxK5H5 (> 1.4 mmol histidine per g polymer) into statistical polymers led to poor conversion (data not shown), further indicating that this phenomenon may be occurring. HPMA, lysine, and histidine concentration in the copolymers was determined by amino acid analysis; the lysine concentration was approximately 2.4–2.7 mmol lysine per g polymer for the pSlo series and 3.0–3.8 mmol lysine per g polymer for the pShi and pB series, while the histidine concentration ranged from 0.21–1.4 mmol histidine per g polymer.
Acid-base titration
Incorporation of histidine into polymers can increase the polymer’s ability to buffer in the endosomal pH range. This strategy allows for endosomal buffering when materials are used for intracellular delivery. The pShi and pB copolymers with higher lysine incorporation were evaluated for buffering capacity using acid-base titration (Figure 2A). Lysine-based polymers were diluted to equal molar lysine concentration (0.1 mM lysine), basified to pH 10 with 1 M NaOH, and subsequently titrated with 0.1 N HCl. In general, higher histidine incorporation resulted in greater buffering in the pH range of 5.1–7.4.
Figure 2.

Acid-base titration of HPMA-oligolysine-oligohistidine polymers. (A) Acid-base titration curves of diblock (pB0, pB1), statistical (pShi0, pShi1, pShi2), and standard polymers (PEI, PLL). Buffer capacity calculated from interpolation of acid-base titration curves of (B) pShi0, pShi1, pShi2, (C) pB0, pB1, and (D) PEI, PLL.
We also looked at buffer capacity, β, as a function of environmental pH. Data obtained from the acid-base titration were interpolated from pH 5.1 to 7.4 to generate Figures 2B–D. For the pShi statistical polymers, increasing histidine content only increased buffer capacity in the lower endosomal pH range (pH 5.1–6.6) (Figure 2B). In contrast, pB1 had higher buffer capacity in the upper endosomal pH range (pH 5.6–7.4) than pB0 (Figure 2C), similarly to PEI (Figure 2D). PLL exhibited increased buffer capacity near neutral pH. These results suggest that buffer capacity can be potentially modulated by varying the polymer architecture of oligohistidine polymers and raises the interesting possibility of more specifically directing location of endosomal release (e.g., early vs. late endosome) by selection of polymer carrier. Roufaï and Midoux reported that the acetylation of the α-amino group of histidine residues substituted on polylysine resulted in a shift of the pKa to pH 6.0 from pH 6.9 for the non-acetylated polymer, and that this may have led to decreased transfection efficiencies of the acetylated polymer26. In addition, the difference in buffer capacity may indicate that histidine residues in block architectures may be more accessible to protonation than those in statistical architectures.
Increases in buffer capacity at the lower endosomal pH range (pH 3.5–6) were also noted when increasing amounts of His3 was grafted onto PAMAM dendrimer derivatives27. Furthermore, Hashemi et. al. saw significant differences in transfection efficiency between various configurations of lysine-histidine peptides incorporated into 10 kD PEI10, indicating that varying the amino acid sequence can also potentiate the buffer capacity; however, these differences may be attributed to sequence similarity to naturally-occurring condensing motifs found in histones than differences in endosomal buffering28. Interestingly, Mason and coworkers showed that cationic amphipathic histidine-rich peptides transfected less efficiently if the peptide exhibited a low pKa value, which resulted in delayed and insufficient disruption of endocytic vesicles29. Thus, the peptide length and amino acid sequence may also influence the pKa of the histidine-containing polymers. Furthermore, since endosomal escape may be preferred earlier on during the gene transfection process due to the cytotoxicity of late endosomal/lysosomal proteases30, lower pKa values may reduce the ability of polymer to achieve endosomal escape in a timely manner. These results suggest that designing polymers that can buffer in the upper endosomal pH range (pH ~6–7.4) can enhance gene transfection efficiencies while reducing cytotoxicity.
Polyplex characterization
Polyplex size, surface charge, and morphology were characterized by dynamic light scattering (DLS), ζ potential, and transmission electron microscopy, respectively. For the pShi series, polymers with lower histidine content produced polyplexes of 170–200 nm in hydrodynamic diameter in water (Figure 3A). In contrast, pB1 did not form small particles in water (353–454 nm). All polymers formed stable complexes (< 300 nm) at N/P 5 in the presence of both neutral and acidic PBS (pH 7.4 and 5.5). All polyplexes (N/P 5) also demonstrated positive ζ potentials (11–23 mV) (Figure 3B). The increased ζ potential of pShi2 and pB1 over their non-histidylated analogues may be due to the increased display of histidine residues, which are protonated at lower pH, in the polymer architectures. Transmission electron micrographs showed that pShi polymers and pB0 formed heterogeneous populations of spherical, toroidal, and oblong polyplexes, ranging from 15–52 nm in width and 41–111 nm in length (Figure 4A–D, E–G), while pB1 formed more uniform, spherical polyplexes, 24–43 nm in width and 34–55 nm in length (Figure 4E–G). Overall, the polyplexes had aspect ratios greater than 1 (Figure 4H). The discrepancy between the DLS and TEM results of pB1 polyplexes may be due to particle aggregation that could occur with the block polymer architecture in water, resulting in larger hydrodynamic sizes, as evidenced by TEM.
Figure 3.

Polyplex characterization by dynamic light scattering and ζ potential. (A) Effective diameters of polyplexes formulated at N/P 5 in water (black bars), PBS, pH 7.4 (white bars), and PBS, pH 5.5 (grey bars). (B) ζ potential of polyplexes formulated at N/P 5 in water. Data are presented as mean ± S.D., n = 3.
Figure 4.
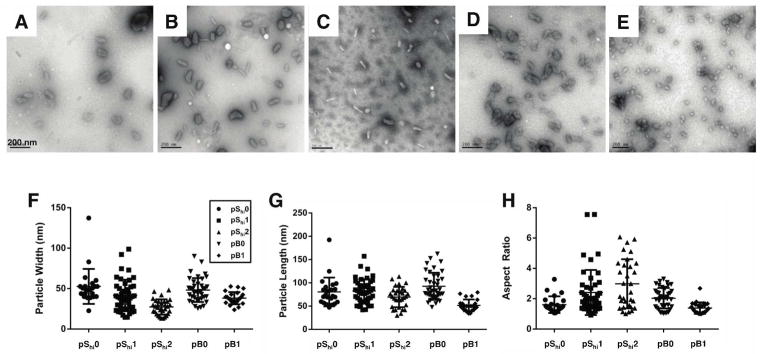
Transmission electron micrographs (TEM) of polyplexes in water. Representative TEM images of polyplexes (N/P 5) formulated with (A) pShi0, (B) pShi1, (C) pShi2, (D) pB0, and (E) pB1. The (F) particle width, (G) particle length, and (H) aspect ratio were calculated suing ImageJ. Data are presented as the mean ± S.D, with n = 23 for pShi0, n = 45 for pShi1, n = 31 for pShi2, n = 39 for pB0, and n = 24 for pB1. Scale bar = 200 nm.
Delivery of plasmid DNA to cultured cells
The ability of the HPMA-peptide copolymers to transfect cultured HeLa cells was assessed in comparison to PLL and PEI polyplexes in serum-free and 10% serum-containing conditions. Protein content, as measured by the BCA assay, was used as an indicator for polyplex cytotoxicity. Under serum-free conditions, we demonstrated that N/P 5 generally provided the highest transfection efficiency for our HPMA-peptide copolymers, and at higher N/P ratios (Supplemental Figure 2A), cytotoxicity was observed in some formulations (Supplemental Figure 2B). Overall transfection efficiency of the pSlo copolymers was low, although in general, higher incorporation of oligohistidine residues led to slight increases in transfection efficiency. Despite these trends, increases were not statistically significant. The pShi and pB copolymers, which contained higher lysine content, transfected better than the pSlo copolymers (Figure 5A) but were also more cytotoxic (Figure 5B). The incorporation of 0.53 mmol histidine per g polymer (pShi1 and pB1) did not significantly increase transfection efficiency over the corresponding base polymers, pShi0 and pB0. However, the statistical polymer with the highest oligohistidine content, pShi2, performed significantly better than pShi0, with a 3.0–4.6 fold increase in transfection efficiency. These results suggest that more than 0.53 mmol histidine per g polymer in these brush copolymers is necessary to achieve significant increases in transfection efficiency in the statistical polymer architecture compared to the non-histidylated polymer analogue. Alternatively, the increased ζ potential of pShi2 (Figure 3B) may also enhance cellular association and thereby transfection efficiency of the material. Interestingly, even though pShi1 and pB1 showed increased buffer capacity similarly to that of PEI (Figure 2B–D), a much greater buffer capacity, which was provided by the pShi2 polymer, was necessary to increase transfection efficiency closer to levels achieved by PEI. Overall, the polymers resulted in some reduced protein content, perhaps due to the large molecular weight of the materials16. In the presence of 10% serum, the transfection efficiencies of all polymer formulations were decreased and cytotoxicity was limited. In addition, the increase in transfection efficiency achieved by pShi2 over pShi0 was eliminated, indicating that serum proteins may nonspecifically bind to the cationic polyplexes and interfere were overall polyplex uptake31, thereby reducing the effective concentration of histidine necessary for increased transfection.
Figure 5.

Transfection of HPMA-oligolysine-oligohistidine polyplexes in HeLa cells. (A) Transfection efficiency and (B) protein content of HeLa cells transfected with polyplexes formulated with statistical (pShi0, pShi1, pShi2) or diblock (pB0, pB1) and DNA (1 μg) at N/P 5 under serum-free (white bars) or 10% serum-containing (black bars) conditions. Data are presented as the mean ± S.D., n = 3, and representative of two independent experiments. (*) p < 0.05, as determined by a two-tailed, unpaired Student’s t-test with unequal variance.
Previous reports have also indicated that high levels of histidylation may be needed to significantly impact transfection efficiency. Benns et. al. synthesized a histidylated version of PLL where 25% of the ε-amine groups on the PLL backbone was grafted with poly(L-histidine) that resulted in higher transfection efficiency compared to PLL alone11. Additionally, Midoux et. al. found optimal transfection efficiency when 38% of the ε-amines of PLL was substituted with histidyl residues32. Reports using polyhistidine peptides for gene delivery have also showed increased transfection efficiencies due to the incorporation of histidine33–35, but shorter peptides (DP 19) were not as efficient gene transfection agents as longer peptides (DP 190)35.
Delivery of plasmid DNA with bafilomycin A1 and chloroquine
To determine if the increase in transfection efficiency of pShi2 was a result of effective endosomal buffering, HeLa cells were treated with polyplexes in the presence of bafilomycin A1, an ATPase proton pump inhibitor36, or chloroquine, a lysosomotropic agent that buffers endosomal vesicles37. The transfection efficiencies of pShi0, pShi2, and pB0 in the presence of bafilomycin A1 decreased to 64.8%, 46.7%, and 68.4%, respectively, of the original transfection efficiency, indicating that polymer protonation does facilitate gene delivery (Figure 6A). As expected, the transfection efficiency of PEI was decreased to 9.4% of the original transfection efficiency, as previously reported6. The transfection efficiencies of all polymer formulations were increased 2.0- to 28.8-fold by the addition of chloroquine. These results suggest that further increases in transfection efficiency potentially can be achieved with enhanced endosomal buffering. Similar results were achieved with COS-7 cells (Figure 6C). Although inhibitor treatment increased cytotoxicity, the transfection efficiencies were normalized to account for the decreased protein content (Figure 6B, D). Additionally, previous reports have shown that buffering ability alone may not be sufficient to increase transfection efficiency38,39.
Figure 6.

Transfection of HPMA-oligolysine-oligohistidine polyplexes in HeLa and COS-7 cells with bafilomycin A1 or chloroquine. (A) Transfection efficiency and (B) protein content of HeLa cells, and (C) transfection efficiency and (D) cell viability of COS-7 cells transfected with polyplexes formulated with statistical (pShi0, pShi2) or diblock (pB0, pB1) and DNA (1 μg) at N/P 5 in the presence of 150 nM bafilomycin A1 or 200 μM chloroquine under serum-free conditions. Data are presented as the mean ± S.D., n = 4, and representative of three independent experiments. (*) p < 0.05, as determined by a two-tailed, unpaired Student’s t-test with unequal variance.
Delivery of plasmid DNA with endocytic uptake inhibitor treatment
Three major cellular uptake pathways have been implicated in polyplex uptake: clathrin-mediated endocytosis, caveolae-mediated endocytosis, and macropinocytosis40. Clathrin-mediated endocytosis involves the trafficking of endocytosed materials in increasingly acidified endosomal environments; in this case, the ability of endosomal buffering becomes beneficial as a potential method for endosomal escape. In caveolae-mediated endocytosis and macropinocytosis, endocytosed materials are not subjected to acidic environments. Therefore, the ability to buffer at endosomal pH may not be crucial for gene delivery. To determine if the HPMA-oligolysine copolymers preferred one of these endocytic pathways, transfection studies were conducted in cells treated with the following agents: chlorpromazine, an inhibitor of clathrin-mediated endocytosis41, genistein, an inhibitor of caveolae-mediated endocytosis42, and amiloride, an inhibitor of macropinocytosis43.
For transfections with chemical inhibitors, HeLa cells were treated with chlorpromazine, genistein, or amiloride for 1 h prior to transfection with polyplexes. Since polyplex uptake pathways are highly cell-dependent44, COS-7 cells were also tested since the cell line had also been previously used in inhibitor studies44,45. In HeLa cells, both pShi and pB polyplexes exhibited decreased transfection when the cells were pre-treated with genistein (Figure 7A). When HeLa cells were pre-treated with chlorpromazine, pShi2 and pB0 exhibited a 1.7- and 4.5-fold increase, respectively, in transfection efficiency. No significant differences in transfection efficiency were seen when cells were treated with amiloride. In COS-7 cells, pShi0, pShi2, and pB0 polymers exhibited 2.0-, 2.1-, and 2.4-fold increase, respectively, in transfection efficiency with chlorpromazine pre-treatment (Figure 7C). The increases in transfection efficiency observed with chlorpromazine treatment may indicate that compensatory uptake mechanisms are upregulated upon inhibition of clathrin-mediated endocytosis46. Decreased transfection efficiency was seen with pShi polyplexes with genistein pre-treatment. Again, inhibitor treatment slightly increased cytotoxicity and the transfection efficiencies were normalized to account for the reduced protein content (Figure 7B, D). While all three internalization routes may be used to varying extents, these results indicate that caveolae-mediated uptake is a significant method of HPMA-peptide copolymer internalization that leads to successful gene transfection. Other reports have demonstrated similar findings for other polymer systems. For example, van de Aa et al. demonstrated that pDMAEMA polyplexes had better transfection efficiencies when routed through the caveolar pathway45. Hanes and coworkers recently demonstrated that PEGylated polylysine (CK30) particles also trafficked via the non-degradative caveolar pathway, leading to efficient transfection47. They attribute the method of uptake in HeLa48 and human bronchial epithelial cells47 to the rod shape of CK30 particles; smaller (24 nm) nanoparticles were also taken up via a non-degradative pathway in HeLa cells49. A recent study by Herd et al. also demonstrated that particle geometry affected cellular uptake mechanism50, therefore emphasizing the need to further study the role of polyplex morphology on cellular uptake. Statistical polymers (pShi1 and pShi2) and pB0 were seen to have rod-shaped morphologies (Figure 4), which may contribute to uptake via caveolae. Reilly et al. also showed that PEI polyplexes containing histone-mimetic peptides achieved productive transfection when routed through caveolae instead of mainly clathrin-mediated endocytosis with PEI alone51. While the increased buffering capacity of pShi2 does enhance transfection efficiency, the increases in transfection efficiency with the incorporation of histidine residues are small (at most, only 4.6-fold), and thus, these structures may be attaining high levels of transfection efficiency through an alternative, non-acidifying pathway, such as the caveolar pathway. Thus, in order to improve the transfection efficiency of HPMA-oligolysine copolymers, methods other than improving endosomal buffering can be explored.
Figure 7.

Transfection of HPMA-oligolysine-oligohistidine polyplexes in HeLa and COS-7 cells with chlorpromazine, genistein, or amiloride. (A) Transfection efficiency and (B) protein content of HeLa cells, and (C) transfection efficiency and (D) cell viability of COS-7 cells transfected with polyplexes formulated with statistical (pShi0, pShi2) or diblock (pB0, pB1) and DNA (1 μg) at N/P 5 in the presence of 10 μg/mL chlorpromazine, 50 μg/mL genistein, or 25 μg/mL amiloride under serum-free conditions. Data are presented as the mean ± S.D., n = 4, and representative of four independent experiments. (*) p < 0.05, as determined by a two-tailed, unpaired Student’s t-test with unequal variance.
Conclusions
In summary, we describe the synthesis of statistical and diblock HPMA-oligolysine-oligohistidine copolymers via RAFT polymerization and evaluate these materials as gene delivery vehicles. The copolymers were characterized for buffering ability and polyplex formation, and evaluated for in vitro transfection efficiency. Statistical and diblock copolymers also showed increased, but differential buffering capability in the endosomal pH range. Nevertheless, only the statistical polymer containing the highest oligohistidine content resulted in higher transfection efficiencies than the non-histidylated analogue. Therefore, one possible explanation is that for these polymer architectures, higher histidine content may be required. In addition, endocytic inhibitor studies showed that these HPMA copolymers might achieve greater transfection when routed through the caveolar endocytic pathway, indicating that these polymers minimally benefit from enhanced endosomal buffering capabilities. Therefore, alternative approaches for vesicular escape that do not rely on acidification may further increase gene transfection efficiency for this class of polymers.
Supplementary Material
Acknowledgments
This work is supported by NIH/NINDS1R01 NS064404. JS is supported by the National Science Foundation Graduate Research Fellowship under Grant No. DGE-0718124 and the Howard Hughes Medical Institute/UW Molecular Medicine Graduate Student Scholarship. BC and JLC were supported by the Mary Gates Undergraduate Research Fellowship. EA was supported by the Amgen Summer Scholars Program. We thank Profs. Anthony Convertine and Patrick Stayton for the general donation of the ECT reagent, Prof. In-Kyu Park (Chonnam Medical University) and David Chu for helpful discussions, Prof. Shaoyi Jiang (University of Washington) for use of his Malvern Zetasizer, and Dr. Bobbie Schneider (Electron Microscopy Services at the Fred Hutchinson Cancer Research Center) for her help and assistance with TEM imaging.
Footnotes
Supporting Information. Supplementary figures including size exclusion chromatograms of pShi polymers and extended transfection data with polymer panels at N/P 3, 5, 7. This material is available free of charge via the Internet at http://pubs.acs.org.
References
- 1.Pack DW, Hoffman AS, Pun S, Stayton PS. Nat Rev Drug Discovery. 2005;4:581–593. doi: 10.1038/nrd1775. [DOI] [PubMed] [Google Scholar]
- 2.Ruponen M, Honkakoski P, Rönkkö S, Pelkonen J, Tammi M, Urtti A. J Controlled Release. 2003;93:213–217. doi: 10.1016/j.jconrel.2003.08.004. [DOI] [PubMed] [Google Scholar]
- 3.Suh J, Wirtz D, Hanes J. Proc Natl Acad Sci USA. 2003;100:3878–3882. doi: 10.1073/pnas.0636277100. [DOI] [PMC free article] [PubMed] [Google Scholar]
- 4.Varga CM, Tedford NC, Thomas M, Klibanov AM, Griffith LG, Lauffenburger DA. Gene Ther. 2005;12:1023–1032. doi: 10.1038/sj.gt.3302495. [DOI] [PubMed] [Google Scholar]
- 5.Behr JP. Chimia. 1997;51:34–36. [Google Scholar]
- 6.Akinc A, Thomas M, Klibanov AM, Langer R. J Gene Med. 2005;7:657–663. doi: 10.1002/jgm.696. [DOI] [PubMed] [Google Scholar]
- 7.Pichon C, Gonçalves C, Midoux P. Adv Drug Delivery Rev. 2001;53:75–94. doi: 10.1016/s0169-409x(01)00221-6. [DOI] [PubMed] [Google Scholar]
- 8.Midoux P, Pichon C, Yaouanc JJ, Jaffrès PA. Br J Pharmacol. 2009;157:166–178. doi: 10.1111/j.1476-5381.2009.00288.x. [DOI] [PMC free article] [PubMed] [Google Scholar]
- 9.Chang KL, Higuchi Y, Kawakami S, Yamashita F, Hashida M. Bioconjugate Chem. 2010;21:1087–1095. doi: 10.1021/bc1000609. [DOI] [PubMed] [Google Scholar]
- 10.Hashemi M, Parhiz BH, Hatefi A, Ramezani M. Cancer Gene Ther. 2011;18:12–19. doi: 10.1038/cgt.2010.57. [DOI] [PubMed] [Google Scholar]
- 11.Benns JM, Choi JS, Mahato RI, Park JS, Kim SW. Bioconjugate Chem. 2000;11:637–645. doi: 10.1021/bc0000177. [DOI] [PubMed] [Google Scholar]
- 12.Chen QR, Zhang L, Stass SA, Mixson AJ. Nucleic Acids Res. 2001;29:1334–1340. doi: 10.1093/nar/29.6.1334. [DOI] [PMC free article] [PubMed] [Google Scholar]
- 13.Johnson RN, Burke RS, Convertine AJ, Hoffman AS, Stayton PS, Pun SH. Biomacromolecules. 2010;11:3007–3013. doi: 10.1021/bm100806h. [DOI] [PMC free article] [PubMed] [Google Scholar]
- 14.Chu DSH, Schellinger JG, Shi J, Convertine AJ, Stayton PS, Pun SH. Acc Chem Res. 2012;45:1089–1099. doi: 10.1021/ar200242z. [DOI] [PMC free article] [PubMed] [Google Scholar]
- 15.Ahmed M, Narain R. Prog Polym Sci. 2012;38:767–90. [Google Scholar]
- 16.Johnson RN, Chu DSH, Shi J, Schellinger JG, Carlson PM, Pun SH. J Controlled Release. 2011;155:303–311. doi: 10.1016/j.jconrel.2011.07.009. [DOI] [PMC free article] [PubMed] [Google Scholar]
- 17.Parelkar SS, Chan-Seng D, Emrick T. Biomaterials. 2011;32:2432–2444. doi: 10.1016/j.biomaterials.2010.12.004. [DOI] [PubMed] [Google Scholar]
- 18.Ahmed M, Narain R. Biomaterials. 2011;32:5279–5290. doi: 10.1016/j.biomaterials.2011.03.082. [DOI] [PubMed] [Google Scholar]
- 19.Yin L, Song Z, Kim KH, Zheng N, Tang H, Lu H, Gabrielson N, Cheng J. Biomaterials. 2013;34:2340–2349. doi: 10.1016/j.biomaterials.2012.11.064. [DOI] [PMC free article] [PubMed] [Google Scholar]
- 20.Wei H, Volpatti LR, Sellers DL, Maris DO, Andrews IW, Hemphill AS, Chan LW, Chu DSH, Horner PJ, Pun SH. Angew Chem Int Ed Engl. 2013;52:5377–5381. doi: 10.1002/anie.201301896. [DOI] [PMC free article] [PubMed] [Google Scholar]
- 21.Burke RS, Pun SH. Bioconjugate Chem. 2010;21:140–150. doi: 10.1021/bc9003662. [DOI] [PMC free article] [PubMed] [Google Scholar]
- 22.Convertine AJ, Benoit DSW, Duvall CL, Hoffman AS, Stayton PS. J Controlled Release. 2009;133:221–229. doi: 10.1016/j.jconrel.2008.10.004. [DOI] [PMC free article] [PubMed] [Google Scholar]
- 23.Schellinger JG, Pahang JA, Johnson RN, Chu DSH, Sellers DL, Maris DO, Convertine AJ, Stayton PS, Horner PJ, Pun SH. Biomaterials. 2013;34:2318–2326. doi: 10.1016/j.biomaterials.2012.09.072. [DOI] [PMC free article] [PubMed] [Google Scholar]
- 24.Fischer D, von Harpe A, Kunath K, Petersen H, Li Y, Kissel T. Bioconjugate Chem. 2002;13:1124–1133. doi: 10.1021/bc025550w. [DOI] [PubMed] [Google Scholar]
- 25.McCormick CL, Lowe AB. Acc Chem Res. 2004;37:312–325. doi: 10.1021/ar0302484. [DOI] [PubMed] [Google Scholar]
- 26.Roufaï MB, Midoux P. Bioconjugate Chem. 2001;12:92–99. doi: 10.1021/bc0000738. [DOI] [PubMed] [Google Scholar]
- 27.Yu GS, Bae YM, Choi H, Kong B, Choi IS, Choi JS. Bioconjugate Chem. 2011;22:1046–1055. doi: 10.1021/bc100479t. [DOI] [PubMed] [Google Scholar]
- 28.Canine BF, Wang Y, Hatefi A. J Controlled Release. 2008;129:117–123. doi: 10.1016/j.jconrel.2008.04.012. [DOI] [PMC free article] [PubMed] [Google Scholar]
- 29.Iacobucci V, Di Giuseppe F, Bui TT, Vermeer LS, Patel J, Scherman D, Kichler A, Drake AF, Mason AJ. Biochim Biophys Acta. 2012;1818:1332–1341. doi: 10.1016/j.bbamem.2011.12.018. [DOI] [PMC free article] [PubMed] [Google Scholar]
- 30.Parhamifar L, Larsen AK, Hunter AC, Andresen TL, Moghimi SM. Soft Matter. 2010;6:4001–4009. [Google Scholar]
- 31.Burke RS, Pun SH. Bioconjugate Chem. 2008;19:693–704. doi: 10.1021/bc700388u. [DOI] [PubMed] [Google Scholar]
- 32.Midoux P, Monsigny M. Bioconjugate Chem. 1999;10:406–411. doi: 10.1021/bc9801070. [DOI] [PubMed] [Google Scholar]
- 33.Chamarthy SP, Kovacs JR, McClelland E, Gattens D, Meng WS. Mol Immunol. 2003;40:483–490. doi: 10.1016/j.molimm.2003.08.001. [DOI] [PubMed] [Google Scholar]
- 34.McKenzie DL, Smiley E, Kwok KY, Rice KG. Bioconjugate Chem. 2000;11:901–909. doi: 10.1021/bc000056i. [DOI] [PubMed] [Google Scholar]
- 35.Pichon C, Roufaï MB, Monsigny M, Midoux P. Nucleic Acids Res. 2000;28:504–512. doi: 10.1093/nar/28.2.504. [DOI] [PMC free article] [PubMed] [Google Scholar]
- 36.Bowman EJ, Siebers A, Altendorf K. Proc Natl Acad Sci USA. 1988;85:7972–7976. doi: 10.1073/pnas.85.21.7972. [DOI] [PMC free article] [PubMed] [Google Scholar]
- 37.Erbacher P, Roche AC, Monsigny M, Midoux P. Exp Cell Res. 1996;225:186–194. doi: 10.1006/excr.1996.0169. [DOI] [PubMed] [Google Scholar]
- 38.Funhoff AM, van Nostrum CF, Koning GA, Schuurmans-Nieuwenbroek NME, Crommelin DJA, Hennink WE. Biomacromolecules. 2004;5:32–39. doi: 10.1021/bm034041+. [DOI] [PubMed] [Google Scholar]
- 39.Jones RA, Poniris MH, Wilson MR. J Controlled Release. 2004;96:379–391. doi: 10.1016/j.jconrel.2004.02.011. [DOI] [PubMed] [Google Scholar]
- 40.Khalil IA, Kogure K, Akita H, Harashima H. Pharmacol Rev. 2006;58:32–45. doi: 10.1124/pr.58.1.8. [DOI] [PubMed] [Google Scholar]
- 41.Larkin JM, Brown MS, Goldstein JL, Anderson RG. Cell. 1983;33:273–285. doi: 10.1016/0092-8674(83)90356-2. [DOI] [PubMed] [Google Scholar]
- 42.Aoki T, Nomura R, Fujimoto T. Exp Cell Res. 1999;253:629–636. doi: 10.1006/excr.1999.4652. [DOI] [PubMed] [Google Scholar]
- 43.Koivusalo M, Welch C, Hayashi H, Scott CC, Kim M, Alexander T, Touret N, Hahn KM, Grinstein S. J Cell Biol. 2010;188:547–563. doi: 10.1083/jcb.200908086. [DOI] [PMC free article] [PubMed] [Google Scholar]
- 44.von Gersdorff K, Sanders NN, Vandenbroucke R, De Smedt SC, Wagner E, Ogris M. Mol Ther. 2006;14:745–753. doi: 10.1016/j.ymthe.2006.07.006. [DOI] [PubMed] [Google Scholar]
- 45.van der Aa MAEM, Huth US, Häfele SY, Schubert R, Oosting RS, Mastrobattista E, Hennink WE, Peschka-Süss R, Koning GA, Crommelin DJA. Pharm Res. 2007;24:1590–1598. doi: 10.1007/s11095-007-9287-3. [DOI] [PMC free article] [PubMed] [Google Scholar]
- 46.Vercauteren D, Vandenbroucke RE, Jones AT, Rejman J, Demeester J, De Smedt SC, Sanders NN, Braeckmans K. Mol Ther. 2010;18:561–569. doi: 10.1038/mt.2009.281. [DOI] [PMC free article] [PubMed] [Google Scholar]
- 47.Kim AJ, Boylan NJ, Suk JS, Lai SK, Hanes J. J Controlled Release. 2012;158:102–107. doi: 10.1016/j.jconrel.2011.10.031. [DOI] [PMC free article] [PubMed] [Google Scholar]
- 48.Chen X, Shank S, Davis PB, Ziady AG. Mol Ther. 2011;19:93–102. doi: 10.1038/mt.2010.214. [DOI] [PMC free article] [PubMed] [Google Scholar]
- 49.Lai SK, Hida K, Man ST, Chen C, Machamer C, Schroer TA, Hanes J. Biomaterials. 2007;28:2876–2884. doi: 10.1016/j.biomaterials.2007.02.021. [DOI] [PubMed] [Google Scholar]
- 50.Herd H, Daum N, Jones AT, Huwer H, Ghandehari H, Lehr CM. ACS Nano. 2013;7:1961–1973. doi: 10.1021/nn304439f. [DOI] [PMC free article] [PubMed] [Google Scholar]
- 51.Reilly MJ, Larsen JD, Sullivan MO. Mol Pharm. 2012;9:1280–1290. doi: 10.1021/mp200583d. [DOI] [PubMed] [Google Scholar]
Associated Data
This section collects any data citations, data availability statements, or supplementary materials included in this article.