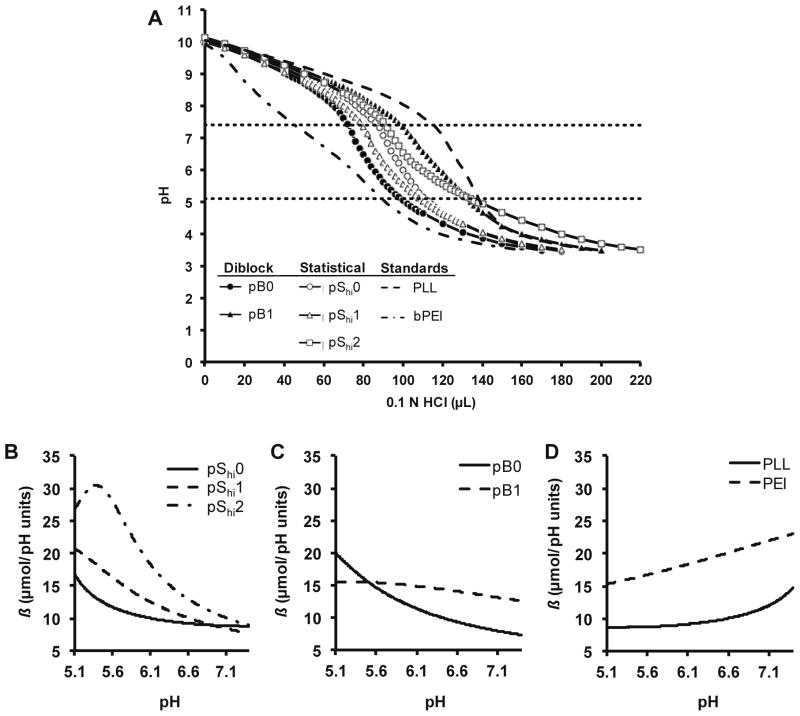
Figure 2.
Acid-base titration of HPMA-oligolysine-oligohistidine polymers. (A) Acid-base titration curves of diblock (pB0, pB1), statistical (pShi0, pShi1, pShi2), and standard polymers (PEI, PLL). Buffer capacity calculated from interpolation of acid-base titration curves of (B) pShi0, pShi1, pShi2, (C) pB0, pB1, and (D) PEI, PLL.

