

Abstract
Background:
Osteoporosis and diabetes mellitus are major and growing public health problems particularly among postmenopausal women. This study was conducted to evaluate the relationship between osteoporosis and osteopenia with type 2 diabetes mellitus (DM) in postmenopausal women.
Materials and Methods:
In a cross sectional study, we compared 200 diabetic postmenopausal women with 400 non-diabetic postmenopausal women over the age of 60 years. Age, Body Mass Index (BMI), T score of the lumbar vertebra (L2-L4) and femoral neck were measured with Dual Energy X-ray Absorptiometry (DXA) and were compared between the two groups. Hemoglobin A1C (HbA1C) was also measured in patients with type 2 DM and its relationship with osteoporosis was studied. Chi-square, Fisher's exact test and Independent T-test was used for analyzing the data. The statistical significance was set at a P value of 0.05 or lower.
Results:
Mean, SD ages were 65.23 ± 4.80 vs. 66.91 ± 5.78 years and BMI were 28.94 ± 4.06 vs. 31.65 ± 4.42 kg/m2 in non-diabetic and diabetic groups, respectively. Lumber T scores was -2.10 ± 1.08 vs.-2.16 ± 1.27 (P = 0.60), femoral neck T-score was -0.72 ± 1.00 vs. -1.09 ± 0.96 (P = 0.00) in non-diabetic and diabetic groups, respectively. There was a significant difference in femoral neck T score between the diabetic and non-diabetic group (P = 0.00). In diabetic women, bone loss was more common in those with HbA1C ≥7 compare to those with HbA1C <7 (P = 0.006).
Conclusion:
Osteopenia and osteoporosis is more common in diabetic postmenopausal women compare to the non-diabetic postmenopausal women.
Keywords: Diabetes mellitus, Osteoporosis, postmenopausal women
INTRODUCTION
Osteoporosis is the most common metabolic disorder, which is accompanied by a decrease in bone mass and destruction of bone tissue.[1] In addition to disability, it increases mortality among individuals who suffer from osteoporosis related fractures.[2] Osteoporosis is characterized by a simultaneous decrease in bone mineral density and bone matrix. As a result, the bone mass decreases but its composition remains intact.[3] This phenomenon is so important that in 1991, the World Health Organization named osteoporosis together by cancer, cerebrovascular and myocardial angina as four main enemies of the human kind.[4]
Osteoporosis is a serious health problem among postmenopausal women that leads to an increased risk of fracture, which increases with age.[5] The rate of osteoporosis in Iranian population is quite high with 50% of men and 70% of women older than 70, suffer from osteoporosis or osteopenia.[6,7] In Isfahan, the prevalence of osteopenia and osteoporosis in women older than 70 were 68.2% and 22.7%, respectively.[8]
Osteopenia, which is followed by osteoporosis, is a serious health problem and can tremendously affect the psychosocial functions of the individuals. Fractures are the most dangerous aspect of osteoporosis, which in addition to its various physical and mental effects on the individual and the society can impose huge costs on the health system.[9,10,11,12]
The rapid progress in diagnostic tools during the last decade has provided the opportunity to diagnose the disease before the fracture happens. As defined by the World Health Organization, osteoporosis is diagnosed based on the bone mineral density,[12] with bone mineral densities more than -1 considered normal, densities from -1 to -2.5 considered osteopenic and amounts lower than -2.5 is defined as osteoporotic, which can also be expressed in T-score.[13,14]
Estrogen deficiency is correlated with a rapid reduction in bone mineral density. As a result, women who have had shorter than average exposure to estrogen during their life (late onset of menarche, early menopause, longer than 6 months cessation of menstrual cycle is at higher risk of osteoporosis.[15,16] In related to the pathogenesis of menopause related osteoporosis, it has been proved that estrogen blocks the absorbing activity of osteoclasts, enhances the trans-intestine transportation of calcium, increases the absorption of calcium from kidneys and protects the osteoclasts. But after menopause, because there is a lack of ovarian function and estrogen, the activity of osteoclasts and the pace of bone destruction increases, which will result in 25-30% destruction in bone mass during a 5-10 years period.[17,18,19,20]
Although, evidences show a high rate of bone destruction in individuals with chronic hyperglycemia,[21] but obviously, hyperglycemia cannot be the cause of reduced bone mass in type 2 diabetic patients. In a prospective study by Schwartz et al. it has been shown that the prevalence of fractures in hip, arm and leg is higher in old aged diabetic women compared to the non-diabetic ones.[22,23]
This study was conducted to evaluate the relationship between osteoporosis and osteopenia with type 2 diabetes mellitus (DM) in postmenopausal women.
MATERIALS AND METHODS
This cross sectional study was conducted in Isfahan, Iran, from April 2011 to February 2012. The study population included all over 60 years old post-menopausal women, who had referred to the rheumatology clinic of the Alzahra hospital for the diagnosis and treatment of osteoporosis.
Menopause was defined as amenorrhea for at least 12 months[24] Type 2 diabetes mellitus was also defined based on the American Diabetes Association criteria 2007 which includes, FPG ≥ 126 mg/dl, 2-hPG ≥ 200 mg/dl and HbA1C≥6.5.[25] In the diabetic group, HbA1C was defined as a diabetes controllability predictor.[26] Having a normal calcium, phosphorus, albumin, vitamin D and alkaline phosphatase were other necessary criteria for being included in the study. Among the cases who met the inclusion criteria, 200 diabetic post-menopausal women older than 60 years were assigned randomly to the case group and 400 non-diabetic post-menopausal women older than 60 years were randomly assigned to the control group.
The cases were dropped out of the study if they had a history of alcohol abuse, asthma, glucocorticoid consumption, cardiac disease, chronic gastric problems (malabsorption, chronic diarrhea and crohn's disease), non-diabetes related renal problems, treatment with calcium or vitamin D supplementary, bisphosphonates, calcitonin or replacement hormones, ovariectomy, rheumatoid arthritis or other rheumatic-inflammatory diseases, smoking and endocrinological diseases (thyroid or parathyroid dysfunction).
The bone density based on the T-score of femoral neck and lumbar vertebrae (L2-L4) were compared between post- menopausal women with type 2 diabetes (case group) and non-diabetic post-menopausal women (control group). For densitometry, dual-energy X-ray absorptiometry (DXA) was used to measure the bone density in lumbar vertebrae (L2- L4 AP) and femoral neck. The measurement was performed by an expert technician using the Explorer™- Hologic's bone densitometer manufactured in USA.
According to World Health Organization definition T-score ≤-2/5 SD less than mean BMD of young adults was considered as osteoporosis, T-score between zero to -1 was considered as normal BMD and T-score between -1 to -2/5 considered as osteopenia, and at last T-score ≤-2.5 plus a history of fracture, considered as a sever establish osteoporosis.[27]
Finally, a complete set of data was collected for each patient. These include: Patient's age, history of diabetes, weight, height, BMI, lumbar densitometry, femoral neck densitometry, calcium, phosphorus, alkaline phosphatase, vitamin D, HbA1c levels and duration of diabetes and menopause.
Data was analyzed by SPSS 18 chicago-USA using the Chi-square and the Fischer's exact test. For evaluating the normal distribution of the quantitative data, we used Kolmogorov–Smirnov test, T-test was used for parametric quantitative data and Mann-Withney test for non-parametric quantitative data. P values less than 0.05 were regarded as meaningful. Multi regression models were applied for assessing any probable correlation between age, height, weight, BMI, duration of menopause and the T-score mean difference.
The study proposal with project number 389446 was approved by the ethical committee of the Isfahan University of Medical Sciences and a consent form was duly filed and signed by all the participants
RESULTS
Most of our patients in the diabetic group belonged to the older age groups (>70 years) in comparison to the non-diabetic cases [Table 1]. BMI was also significantly higher in the diabetic group compare to the non-diabetic group.
Table 1.
Comparison of the different variables in postmenopausal diabetic and non-diabetic women
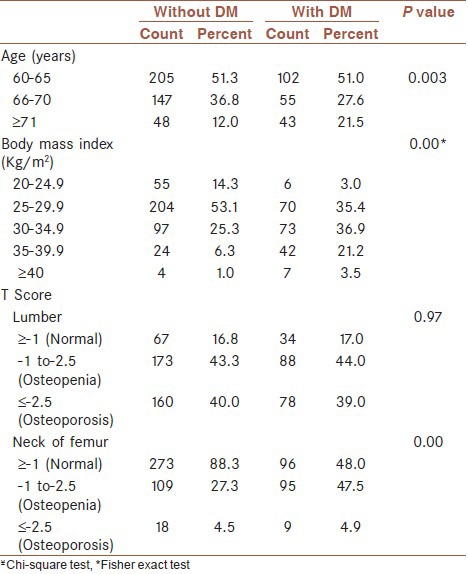
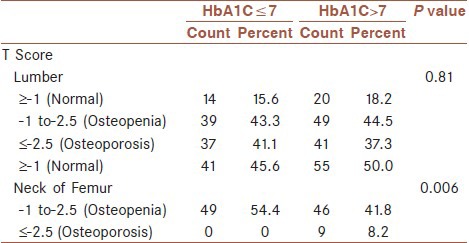
There was no significant difference in lumbar T-score between the two groups (P = 0.97). Whereas, this difference was significant in the femoral neck (P = 0.00) [Table 1]. In our study, there was a significant difference in age, BMI, weight, height and duration of menopause between the diabetic and non-diabetic group (P = 0.00). Moreover, there was no significant difference between the mean and the standard deviation of the T-score between the two groups. But, the T-score of the femoral neck was significantly lower in the diabetic group compare to the non-diabetic group [Table 2]. In postmenopausal diabetic women, there was no significant difference in the T-score of the lumbar region between the group with HbA1C ≤ 7 and the group with HbA1C ≥ 7.1. However, this difference was significant in the femoral neck (P = 0.006) [Table 3].
Table 2.
Comparison of the mean and standard deviation of age, duration of menopause, weight, height, BMI, lumbar T-score and femoral T-score in post-menopausal diabetic and non-diabetic women
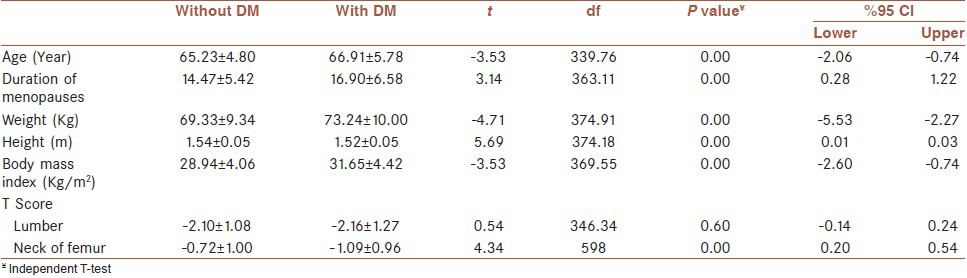
Table 3.
Comparison of the prevalence of HbA1C≤7 and HbA1C>7 among post-menopausal diabetic patients
In order to control the effects of variables such as weight, height, age, BMI and duration of menopause the difference between case and control groups, two regression models were calculated using the Enter method. In model 1 and 2, the dependent variable was lumbar T-score and femoral neck T-score, respectively. And independent variables including weight, age, height, BMI and duration of menopause. Both, the regression model 1 (f = 19.667, P < 0,001) and the regression model 2 (f = 18.285, P < 0,001) were significant. Using Adjusted R Square of 158 and 148, models 1 and 2 respectively comprised approximately 16 and 15 percent of the T-score changes.
DISCUSSION
In a cross sectional study, the prevalence of osteopenia and osteoporosis was compared in 200 diabetic postmenopausal women with 400 non-diabetics postmenopausal women. There was no difference in the T-score of the lumbar vertebrae, but the T-score of the femoral neck was significantly lower in the diabetic group compare to the non-diabetic group.
In our study, the mean age of the cases in the non-diabetic group was 65.23 ± 4.7 years and 66.91 ± 5.78 years in the diabetic group. In a meta-analysis, Bagheri et al., evaluated all the Persian studies about osteoporosis in postmenopausal women and reported their average age as 55.8 ± 8.2 years.[1] In another study by Mohammadzade et al., the average age of the participants was reported to be 55.6 ± 14.3.[3] Baiat et al., conducted a study on 200 postmenopausal women with osteoporosis with the mean age of 55.7 years.[1] In another study by Moghimi et al., which was conducted on 242 diabetic women and 225 control cases, the average age of the diabetic group and the control group was 53.6 ± 10.59 and 54.0 ± 8.0 years, respectively.[28] As we can see, the mean age of the cases in our study is more than the average of other similar studies. This can be justified by the fact that one of the inclusion criteria of our study was to recruit postmenopausal women older than 60 years.
Duration of menopause in our study was 14.47 ± 5.42 and 16.90 ± 6.58 years in the non-diabetic and diabetic group, respectively. This variable was reported to be 6 ± 3 years in a study by Ebrahimi et al.,[10] and 10.11 ± 6.54 years in another study by Mahdavi-Roshan et al.,[13] This difference in the mean can also be due to our inclusion criteria.
In our study, the mean weight of the non diabetic and diabetic cases was 69.33 ± 9.34 and 73.24 ± 10.00 kg, respectively. This difference between the two groups was statistically significant. The mean weight of the osteoporotic women in a study by Mohammadzade et al., was reported to be 69.1 ± 9.7 kg3. In another study by Keramat et al., 136 osteoporotic cases were compared with 136 controls. The mean age of the experimental and the control group was 65.1 ± 10.6 and 72 ± 10 kg, respectively.[7] The mean weight of the patients was also reported to be 67.16 ± 8.10 kg in a study by Mahdavi-Roshan et al.,[13] In our study, as we compared the diabetic cases with healthy ones, the higher average weight of the diabetic group was predictable. However, comparing our results with other studies, the range of weight is lower in the osteoporotic patients in comparison to the healthy individuals. For example, the range of weight in the aforementioned studies was 69.1-70.5 kg (which matches our non-diabetic group's weight), but the weight of the control group in the Keramat et al. study and the weight of our diabetic group is more than this range.[7] This issue, the correlation between weight and osteoporosis among Iranians, should be evaluated in further studies.
Body Mass Index was significantly lower in the non-diabetic group (28.94 ± 4.06 kg/m2) compared to the diabetic group (31.65 ± 4.42 kg/m2). BMI was 27.8 ± 4.1, 29 ± 4 and 27.34 ± 2.8 kg/m2 in Mohammadzade et al., Ebrahim-of et al.'s and Mehdiroshan et al.'s study, respectively.[3,10,13] This variable was 28.6 ± 6.1 kg/m2 among diabetic postmenopausal women and 27.5 ± 5.7kg/m2 among non-diabetic postmenopausal women in the Moghimi et al.'s study.[28] Based on the above findings, the range of BMI among non-diabetic osteoporotic cases falls between 27-29 kg/m2, which correspond with our findings. However, BMI in diabetic postmenopausal women is more than the healthy postmenopausal cases, and as we discussed about the weight, a high body mass index can be a protecting factor. A high BMI stimulates osteogenesis by increasing the mechanical pressure on the bones and by increasing the secretion of sexual hormones.[3,29] Mogimi et al., have also shown that there is a reverse correlation between BMI and the prevalence of osteopenia and osteoporosis.[28] In the study by Keramat et al., concluded that a BMI of lower than 25 kg/m2 increases the risk of osteoporosis.[7] Due to an increased body mass index among diabetic patients, this mechanism may increase the T-score in some body parts (like lumbar vertebrae which are surrounded by fatty tissue).
One of the inclusion criteria of our study was having a normal level of calcium, phosphorus, albumin, vitamin D and alkaline phosphatase, but in Mohammadzede et al's study, it was shown that 61.2% of the patients had vitamin D deficiency.[3] In addition, Keramat et al., concluded that because calcium plays vital roles in albumin transport, sufficient protein intake can reduce osteoporosis.[7]
There was no significant difference between the T-score of the lumbar vertebrae in the diabetic group (−2.16 ± 1.27) and the non-diabetic group (−2.10 ± 1.08), but the femoral neck T-score of the diabetic group (−1.09 ± 0.96) was significantly lower than the non-diabetic group (−0.72 ± 1.00). In Mohammadzade et al's study the lumbar and femoral neck T-score were −2.29 ± 1.09 and −1.77 ± 1.17 respectively,[3] and in Baiat et al's study the lumbar and femoral neck T-score were −1.091 ± 1.115 and −1.696 ± 1.054, respectively.[17] Femoral neck T-score was significantly higher in the diabetic group (18/1 ± 82/1−) compare to the non-diabetic group (−1.48 ± 1.12) in the Bahrami et al. study, they could not find any significant difference in lumber T-score between the groups.[29]
Based on our and Moghimi et al's results, the lumbar T-score is not significantly different between the diabetic and the non-diabetic group.[23] On the other hand, the femoral neck T-score was significantly different between the diabetic and the non-diabetic group both in our and Bahrami et al., results. However, this score in the Bahrami et al., study was 0.8 units higher than in our and Mohammadzede et al., study.[29,30]
Based on lumbar T-score, 44% of our diabetic and 43.3% of our non-diabetic cases had osteopenia and 39% of diabetic and 40% of non-diabetic cases had osteoporosis (there was no significant difference between the two groups). Based on femoral neck T-score, osteopenia was found in 47.5% of diabetic and 27.3% of non-diabetic cases, and osteoporosis was found in 4.9% of diabetic and 4.5% of non-diabetic cases (osteopenia in the diabetic group was significantly more than the other group).
In a study by Bagheri et al., the lowest percentage of femoral neck osteoporosis was reported in Booshehr (1.5%), and the highest in Yazd (4.3%). This percentage, in our study, was 4.5% in the non-diabetic and 4.9% in the diabetic group. Moreover, the lowest percentage of lumbar osteoporosis was reported in Booshehr (3.2%), and the highest in Kashan (51.3%), which was 40% (in non-diabetics) and 39% (in diabetics) in our study.[1]
In a study by Mohammadzade et al., on 29 men and 76 women, the prevalence of osteopenia and osteoporosis was 47.7% and 55.3% among women, respectively.[3] In a study by Baiat et al., 53% of patients had osteopenia and 26.5% had osteoporosis.[17] In a study by Bahrami et al., the prevalence of femoral neck osteoporosis in diabetic group was 30.2% and in the non-diabetic group was 17.3% (statistically significant), and the prevalence of osteopenia was 48.3% in the diabetic group (there was no data about the non-diabetic group).[29] In the same study, lumbar osteoporosis in the diabetic group was 7.9% and 6.2% in the non-diabetic group (significant difference), and the prevalence of osteopenia was 46.3% in the diabetic group (there was no data about the non-diabetic group).[28]
Just like in our study, there was a significant difference in the prevalence of femoral neck osteoporosis between the two groups in the study of Bahrami et al., and the incidence of osteoporosis in the diabetic group was significantly more than the other group.[29] However, in contrary to the Bahrami et al., study, we found no significant difference in lumbar osteoporosis between the two groups.
We also studied the correlation between T-score and HbA1C levels, and we found out that in postmenopausal diabetic women there is no significant difference in the T-score of the lumbar vertebrae between the group with HbA1C ≤ 7 and the group with HbA1C ≥7. However, this difference is significant in the femoral neck.
After eliminating the effects of weight, height, age, BMI and duration of menopause, the results showed that the effect of the diabetes by itself was significantly meaningful on lumbar and femoral neck T-score. The correlation between osteoporosis and risk factors such as age > 50 years, duration of menopause and history of fracture, has been also demonstrated on other studies.[2]
There are controversial results surrounding the correlation of type 2 diabetes and osteoporosis in various studies.[25] Although, it has been shown in some studies that type 2 diabetes has protecting effect on post-menopausal osteoporosis,[31] other studies could not find any significant difference in femoral neck's bone mass among healthy and diabetic patients.[18] Based on our results, we demonstrated that in post-menopausal women there is a correlation between type 2 diabetes and osteoporosis, type 2 diabetes can increase the prevalence of osteoporosis in post-menopausal women.
CONCLUSION
The prevalence of osteopenia and osteoporosis in post-menopausal diabetic women is more than post-menopausal non-diabetic women, which is evident from a lower femoral neck T-score in diabetic patients compare to the non-diabetic healthy individuals.
The results of this study, demonstrate the role of type 2 diabetes as a bone mass reducing factor. Hence, proper control of this risk factor can be an effective way in prevention of osteoporosis.
ACKNOWLEDGMENT
This study has been financially supported by Medical Faculty of Isfahan University of Medical Sciences.
Footnotes
Source of Support: Medical Faculty of Isfahan University of Medical Sciences
Conflict of Interest: None declared.
REFERENCES
- 1.Begheri P, Haghdost AA, Dortaj RE, Halimi L, Vafaee Z, Farhangnia M, et al. Ultra analysis of prevalence of osteoporosis in Iranian women (A systematic review and meta-analysis) Iran J Endocrin Methabol. 2011;3:315–25. [Google Scholar]
- 2.Soheili Azad AA, Golestan B, Jahanbakhsh S. Determination of the relation between osteoporotic and osteopenic risk factors among women referring to bone mineral density center, Baharloo Hospital. J Iran Univ Med Sci. 2008;14:91–9. [Google Scholar]
- 3.Mohammad Zadeh NA, Najafipoor F, Bahrami A, Niafar M, Begler L, Haji Eghrari H, et al. Evaluation of decrease bone mineral density in osteoporotic and osteopenic women. J Gorgan Univ Med Sci. 2010;11:61–7. [Google Scholar]
- 4.Jamshidian-Taheri M, Kalantari N, Azadbakht L, Esmaiel Zadeh A, Rajaie A, Hoshiar-Rad A. Risk Factors of osteoporosis in Tehrani women aged 40-60 years old. Iran J Endocr Methabol. 2007;6:139–45. [Google Scholar]
- 5.Samere A. Tehran, Iran: Tehran University of Medical Science; 2005. Evaluation of usage preventing of osteoporotic behavior in menopausal women. Bulletin of 1st International congress of prevention, diagnosis and treatment; pp. 106–16. [Google Scholar]
- 6.Torshizi L, Anoshe M, Ghofrani poor FA, Ahmadi FA, Hoshiar RA. The effect of education based on health belief model on preventive factors of osteoporosis among postmenopausal women. Iran J Nurs. 2009;22:71–82. [Google Scholar]
- 7.Keramat A, Larijani B, Adibi H, Hosein Nejad A, Chopra A, Petovartehan B. Osteoporosis risk factors in postmenopausal women in cities. Danesh Tandorosti J. 2008;2:36–41. [Google Scholar]
- 8.Bonakdar ZS, Karimzadeh H, Karimifar M, Mottaghi P, Salesi M, Farajzadegan Z. Definition of a population-specific dual energy X-ray absorptiometry reference standard in Isfahani women. Int J Rheum Dis. 2008;11:400–6. [Google Scholar]
- 9.Larijani B, Soltani A, Pajouni M, Bastanhagh MH, Mirfeyzi Z, Dashti R, et al. Bone mineral density variations in 20-69 year population of Tehran/Iran. Iran South Med J. 2002;5:41–9. [Google Scholar]
- 10.Ebrahim S, Hoseinnejad A, Hoshiar-rad A, Rahmani M, Valaie N, Larijani B, Kimiagar M. Evaluation of association between fruits and vegetables consuming and bone turn over in postmenopausal women. Pajouhandeh. 2007;11:159–65. [Google Scholar]
- 11.Cummings SR, Melton LJ. Epidemiology and outcomes of osteoporosis fractures. Lancet. 2002;359:2018–26. doi: 10.1016/S0140-6736(02)08657-9. [DOI] [PubMed] [Google Scholar]
- 12.1st ed. Geneva: World Health Organization; 2003. WHO. Prevention and management of osteoporosis: Report of a WHO scientific group; pp. 1–120. [Google Scholar]
- 13.Mahdavi-Roshan M, Ebrahimi-Mamghani M, Ebrahimi AA, GhaemMaghami J. Nutritional and biochemical factors of zink and calcium in postmenopausal women with osteoporosis in Tabriz-2007. Behbod. 2009;12:296–307. [Google Scholar]
- 14.Taisum H, David B. Zink intakes and plasma concentration in men with osteoporosis: The Rancho Bernadostudy. Am J Clin Nutr. 2004;80:715–21. doi: 10.1093/ajcn/80.3.715. [DOI] [PubMed] [Google Scholar]
- 15.Scheiber LB, Torregrosa L. Evaluation and treatment of postmenopausal osteoporosis. Semin Arthritis Rheum. 1998;27:245–61. doi: 10.1016/s0049-0172(98)80004-8. [DOI] [PubMed] [Google Scholar]
- 16.Leslie M, Pierre RW. Osteoporosis: Implications for risk reduction in the college setting. J A College Health. 1999;48:67–71. doi: 10.1080/07448489909595676. [DOI] [PubMed] [Google Scholar]
- 17.Baiat N, Haji Amini Z, Alishiri GH, Ebadi A, Hoseini MS, Laloie A. Frequency of osteoporosis and osteopenia in postmenopausal military family's women. Army Univ Med Sci J. 2008;6:25–30. [Google Scholar]
- 18.Schwarts AV, Sellmeyer DE, Ensurd KE, Cauley JA, Tabor HK, Schriener PJ, et al. Older women with diabetes have an increased risk of fracture: A prospective study. J Clin Endocrinol Metab. 2001;86:32–8. doi: 10.1210/jcem.86.1.7139. [DOI] [PubMed] [Google Scholar]
- 19.Thrope SR, Baynes JW. Maillard reaction products in tissue proteins: New products and new perspectives. Amino Acids. 2003;25:275–81. doi: 10.1007/s00726-003-0017-9. [DOI] [PubMed] [Google Scholar]
- 20.Yao D, Taguchi T, Matsumura T, Pestell R, Edelstein D, Giardino I, et al. High glucose increases angiopoietin-2 transcription in microvascular endothelial cells through methylglyoxal modification of mSin3A. J Biol Chem. 2007;282:31038–45. doi: 10.1074/jbc.M704703200. [DOI] [PubMed] [Google Scholar]
- 21.Kumeda Y, Inaba M, Nishizawa Y. Diabetes mellitus and osteoporosis. Nihon Rinsho. 2002;60:393–403. [PubMed] [Google Scholar]
- 22.Aula FJ, Rosen C. Obesity, diabetes mellitus and last but not least, osyeoporosis. Arq Bras Endocrinol Metab. 2010;54:150–7. doi: 10.1590/s0004-27302010000200010. [DOI] [PubMed] [Google Scholar]
- 23.Harlow SD, Crawford SL, Sommer B, Greendale GA. Self-defined menopausal status in a multi-ethnic sample of midlife women. Maturitas. 2000;36:93–112. doi: 10.1016/s0378-5122(00)00145-6. [DOI] [PubMed] [Google Scholar]
- 24.Morita S, Kasayama S, Otsuki M, Asanuma N, Saito H, Mukai M, et al. Atherosclerotic risk factors in Japanese subjects with isolated impaired fasting glucose and those with isolated impaired glucose tolerance according to 1997 and 2003 American Diabetes Association criteria. Diabetes Care. 2006;29:2123–6. doi: 10.2337/dc06-0964. [DOI] [PubMed] [Google Scholar]
- 25.Incalzi RA, Corsonello A, Pedone C, Corica F, Carosella L, Mazzei B, et al. Identifying older diabetic patients at risk of poor glycemic control. BMC Geriatr. 2002;2:4. doi: 10.1186/1471-2318-2-4. [DOI] [PMC free article] [PubMed] [Google Scholar]
- 26.Frost HM, Schneider P, Schneider R. Osteoporosis a disease requiring treatment or a physiologicosteopenia state? WHO definition in opposition to Utah Paradigm? Dtsch Med Wochenschr. 2002;127:2570–4. doi: 10.1055/s-2002-35793. [DOI] [PubMed] [Google Scholar]
- 27.Yamamoto M, Yamaguchi M, Yamauchi M, Yano S, Sugimoto T. Serum pentosidine levels are positively associated with the presence of vertebral fraucture in post menopausal women with type 2 diabetes mellitus. J Clin Endocr Metab. 2008;93:1013–9. doi: 10.1210/jc.2007-1270. [DOI] [PubMed] [Google Scholar]
- 28.Moghimi N, Rahimi E, Derakhshan S, Farhadifar F. Osteoporosis in postmenopausal diabetic womer; Prevalence and Related Factors. Iran J Nuci Med. 2008;16:28–33. [Google Scholar]
- 29.Bahrami A. Proceedings of first international seminar on prevention, diagnosis and treatment of osteoporosis. Tehran Iran: 2004. The relationship between body mass index and prevalence rate of Osteopenia and Osteopororir in a urban population; pp. 31–2. [Google Scholar]
- 30.Hosein Nejad A, Larijani B, Pajouhi M, Adibi H, Maghboli ZH. Association between type 2 of diabete mellitus and lifestyle with osteoporosis pre- and postmenopausal women. Iran J Endocr Methabol. 2004;3:47–52. [Google Scholar]
- 31.Christensen JO, Svendson OL. Bone mineral in pre- and postmenopausal women with insulin dependent and non insulin dependent diabetes mellitus. Osteoporos Int. 1999;10:307–11. doi: 10.1007/s001980050232. [DOI] [PubMed] [Google Scholar]