

Abstract
Motivation: Identification of differential expressed genes has led to countless new discoveries. However, differentially expressed genes are only a proxy for finding dysregulated pathways. The problem is to identify how the network of regulatory and physical interactions rewires in different conditions or in disease.
Results: We developed a procedure named DINA (DIfferential Network Analysis), which is able to identify set of genes, whose co-regulation is condition-specific, starting from a collection of condition-specific gene expression profiles. DINA is also able to predict which transcription factors (TFs) may be responsible for the pathway condition-specific co-regulation. We derived 30 tissue-specific gene networks in human and identified several metabolic pathways as the most differentially regulated across the tissues. We correctly identified TFs such as Nuclear Receptors as their main regulators and demonstrated that a gene with unknown function (YEATS2) acts as a negative regulator of hepatocyte metabolism. Finally, we showed that DINA can be used to make hypotheses on dysregulated pathways during disease progression. By analyzing gene expression profiles across primary and transformed hepatocytes, DINA identified hepatocarcinoma-specific metabolic and transcriptional pathway dysregulation.
Availability: We implemented an on-line web-tool http://dina.tigem.it enabling the user to apply DINA to identify tissue-specific pathways or gene signatures.
Contact: dibernardo@tigem.it
Supplementary information: Supplementary data are available at Bioinformatics online.
1 INTRODUCTION
Gene Expression Profiles (GEPs), measured in different conditions and cell types via microarrays or, more recently, next generation sequencing, have been extensively used in computational systems biology to reverse engineer gene regulatory networks (Bansal et al., 2007; Marbach et al., 2010). The main use of reverse engineering has been the identification of unknown regulatory or functional interactions among genes, microRNAs and proteins from large datasets (Belcastro et al., 2011; Sumazin et al., 2011).
State-of-the-art reverse-engineering methods model gene networks as static processes, i.e. regulatory interactions among genes in the network (such as direct physical interactions or indirect functional interactions) do not change across different conditions or tissue types. However, different cell types, or the same cell type but in different conditions, may carry out different functions, and it is expected that their regulatory networks reflect these differences.
Several methods have been proposed to identify active subnetworks across different conditions from changes in gene expression. One of the first attempts is a general method to search for ‘active sub-networks’ connecting genes with unexpectedly high levels of Differential Expression (Ideker et al., 2002). This method requires in input a single network, and it identifies a set of genes (i.e. subnetwork) whose expression changes across two conditions. However, changes in expression may be mild or absent, even when the subnetwork is active. Hence, looking only at the differential expression levels of genes could be not sufficient. Therefore, more recent approaches attempted to identify Differential Co-regulation (DC) of genes in the subnetwork (Choi et al., 2009; Kostka et al., 2004; Langfelder et al., 2011; Leonardson et al., 2010; Ma et al., 2011; Odibat et al., 2012; Reverter et al., 2006; Watson et al., 2006; Yinglei et al., 2004). By differentially co-regulated (DC) genes, we mean set of genes, which are co-regulated only in a specific condition but not in others (de la Fuente, 2010; Ideker et al., 2012).
The main differences among all of these approaches are in how the genes to be tested are selected, how co-regulation is measured (i.e. Pearson Correlation Coefficient or Mutual Information) and how DC across the conditions is quantified.
Some of the most advanced methods go beyond pair-wise co-regulation and aim at automatically identifying de-novo subnetwork(s) containing genes whose co-regulation changes the most across two or more conditions (Langfelder et al., 2011; Ma et al., 2011; Odibat et al., 2012). This is achieved by advanced optimization techniques such as genetic algorithms, which, however, are computationally intensive (Kostka et al., 2004), as they require checking all of the possible subnetworks to identify the ones that are most dysregulated. Hence, these methods are limited in the number of different conditions that can be compared (Choi et al., 2009; Langfelder et al., 2011; Watson et al., 2006), and they may require fine tuning of the algorithm parameters (Ma et al., 2011).
Here, we developed and applied a simple but powerful procedure named DINA (DIfferential Network Analysis), which differently from other methods does not aim at identifying de novo subnetworks of genes but rather at identifying whether a known pathway is differentially coregulated across a set of conditions. DINA is also able to predict which transcription factors (TFs) may be responsible for the condition-specific co-regulation. DINA requires in input a set of N networks and a set of M genes, and it aims to identify whether co-regulation among the M genes in the set changes significantly across the N different conditions.
We first applied DINA to identify tissue-specific pathways, and their TF regulators, starting from a collection of ∼3000 GEPs across 30 different tissues. DINA correctly discovered that the amino acid and fatty acid metabolic pathways are specifically active in liver and kidney (Hakvoort et al., 2011; Jagoe et al., 2002), despite the level of expression of these enzymes being similar across the tissues. DINA correctly identified TFs of the nuclear receptor family as the main regulators of these pathways. DINA also revealed a novel candidate negative regulator of metabolic pathways, YEATS2, a gene not well characterized (Wang et al., 2008). We experimentally verified its association to metabolic pathway regulation using starvation response in primary hepatocytes (Ding et al., 2009).
We then applied DINA to three different hepatocyte cell lines, from different stages of hepatocarcinoma (HCC). DINA correctly predicted that the main metabolic pathways, as well as the p53 transcriptional program, get severely dysregulated in HCC.
2 METHODS
2.1 Database of GEPs
We implemented a GEP database in the open source DataBase Management System PostgreSQL environment. We downloaded all the MicroArray Gene Expression Markup Language (Brazma et al., 2001) annotation files present in the ArrayExpress repository and extracted the relevant information on the tissue or cell type for each experiment. We then re-annoted each experiment in a semi-automatic way using the tissue ontology eVOC (Hide et al., 2003).
2.2 Reverse engineering of tissue-specific gene co-regulation networks
We classified 2930 microarrays (Affymetrix HG-U133A and HG-U133plus2) extracted from ArrayExpress in 30 different tissues. We normalized microarrays independently for each tissue using Robust Multichip Average as implemented in the R package Bioconductor (Rafael et al., 2003) (Supplementary Material). We computed the Spearman Correlation Coefficient (SCC) (Hardin et al., 2007) for each pair of probes in each tissue, obtaining a correlation matrix of dimension 22 215 × 22 215 (we excluded control probes) for each tissue. We estimated the SCC significance for each pair of probes by computing t statistics of each SCC value and then using a Student's t-test distribution to estimate the P-value. To control the number of False Positives owing to the multiple hypotheses test problem, we estimated the degrees of freedom of the t-test distribution from the data by fitting the parameters of a Student’s t-location-scale distribution to the t statistics computed for all the probe pairs. We estimated the parameters by minimizing the squared error between the theoretical and the empirical distribution (Supplementary Material).
In the construction of the SCC matrices, we did not apply any pre-filtering step to exclude low-variance probe-sets; however, we applied a stringent threshold (corrected P
 ) to call a SCC value significant, thus reducing the number of False Positive co-regulatory interactions.
To obtain gene-wise SCC matrices starting from the probe-wise SCC matrices, we first excluded probes that were associated to more than one gene using the Affymetrix platform HG-U133A Ballester et al. (2010), but keeping genes associated to more than one probe.
Specifically, we mapped 12 161 genes from the probes in the HG-U133A Affymetrix platform (Ballester et al., 2010). Of these 12 161 genes, 68% of the genes were associated to only one probe, and only 11% of genes were associated to >2 probes (Supplementary Fig. S1).
Hence, for the same pair of genes, there could be multiple values of the SCC because the same gene can be associated to multiple probes in the microarray. In this case, we chose to assign to the gene-pair, the ‘signed’ maximal absolute value of SCC across all the different probe pairs. At the end of the procedure, we thus derived 30 gene-wise networks from the 30 probe-wise networks.
An alternative way to transform the probe-wise SCC matrices to gene-wise SCC matrices would have been to apply a ‘gene centered’ normalization (Ferrari et al., 2007) of the microarrays using a custom CDF, before the SCC computation, thus eliminating the problem of multiple SCC values. We however decided to preserve information on possible alternative transcripts for future work and for experimental validation. To demonstrate that our probe-wise to gene-wise network transformation was robust and comparable with the custom CDF approach, we chose as a case of study the three cancer cell line networks presented in the Section 3.8. We applied a ‘gene centered normalization’ method recently proposed (Ferrari et al., 2007). Finally, we measured the similarity between the ‘gene centered’ SCC matrices and the one we obtained with our strategy by computing the 2D correlation (Supplementary Table S1). The results show that the two approaches yield similar SCC values.
2.3 DINA
DINA requires in input a known set of M genes (i.e. genes belonging to a known pathway, or known targets of a TF), and it aims at assessing whether the co-regulation among the genes in the set changes significantly across N networks.
We downloaded the full manually curated list of 186 Kyoto Encyclopedia of Genes and Genomes (KEGG) pathways from MsigDb (Liberzon et al., 2011). We selected only those pathways consisting of genes that were present in our gene networks (i.e. at least 80% of the genes had to be present) obtaining a final list of 110 KEGG pathways (Supplementary Table S2).
DINA uses an entropy like measure to identify in which tissue(s) a pathway is active. In information theory, entropy is a measure of the uncertainty associated to a random variable. If V is a discrete random variable, then the entropy H(V) can be computed as:
Hence, the entropy H reaches its maximum value when each event is equi-probable and its minimum, i.e.  , when there is no uncertainty. In our settings, V assumes N categorical values, representing the N condition-specific networks. To compute
  , we first computed the number of edges ni connecting the M genes in the ith network (adding a pseudo-count of 1) for
  , and we then computed
 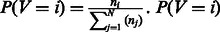 can be interpreted as a probability because it is a number greater than 0 and it sums to 1 across all the N condition-specific networks by definition.
  will be equal to 1 only when the genes in the pathway are specifically co-regulated (i.e. connected) in network i and not co-regulated (connected) in any other network. Thus, P(V = i) represents the probability that M genes in a pathway are co-regulated only in the ith network and not in the other networks.
We also developed and tested a slightly modified version of the entropy H(V), which also takes into account the pathway topology (i.e. which genes are connected to which in the known pathway) (Sales et al., 2012) as described in Supplementary Material. However, in the following analyses, we always used the H(V) formula previously described.
We applied a permutation test in order to assess the entropy significance for each one of the KEGG pathways. The null distribution of H(V) was approximated by selecting a set of N random networks, with the same density as the original networks, and a set of M random genes. Random networks were obtained from the original network by randomly shuffling the gene labels. This procedure was repeated 10 000 times to estimate the H(V) P-value for each pathway. The P-value was then corrected using the Benjamini–Hochberg method (Benjamini et al., 1995).
2.4 Identification of transcriptional regulators of tissue-specific pathways
We selected 1358 TFs including putative TFs (Supplementary Table S3) from a list of 1988 human DNA-binding TFs compiled using information from public repositories (Ravasi et al., 2010). We mapped the TFs onto the HG-133A Affymetrix platform using only the probe sets associated to a single gene.
For each TF, we computed the number of edges connecting it to the genes in the pathway of interest in each of the 30 Tissue Specific Co-regulatory Networks. We then assigned a P-value to each TF using the non-parametric Fisher’s exact test, by comparing, in each tissue, the number of edges between the TF and the genes in the pathway with the number of all the possible edges between the TF and the genes minus the real number of edges. The P-value was corrected using the Benjamini–Hochberg correction (Benjamini et al., 1995).
2.5 Animals and tissues
Primary cultures of mouse hepatocytes were obtained from two wild-type mice using the Pichard’s protocol (Pichard et al., 2006). Following collagenase perfusion and sedimentation, primary hepatocytes were washed and seeded at a density of 105 per well in gelatin-coated dishes (0.1% Gelatin Type I from porcine skin, Sigma). Cells were cultured in Williams E medium (Gibco, 12551) supplemented with 10% heat-inactivated fetal bovine serum (FBS, Invitrogen), 50 U Penicillin–Streptomycin 100× Solution (P/S Gibco 15140-122), 1% l-glutamine. After 5 h, the medium was replaced with Williams E medium supplemented with Hepatozyme-sfm medium (Gibco 17705-021) with 5% heat-inactivated FBS (Invitrogen), 50 U Penicillin—Streptomycin 100× Solution (P/S Gibco 15140-122), 1% l-glutamine and ITS 1× (Insulin Transferrin Selenium -Sciencell 0803). HeLa cells were seeded at a density of 105 per well in a 6 wells multi-well cultured in complete medium, Dulbecco’s modified Eagle’s medium (GIBCO BRL) supplemented with 10% heat-inactivated FBS (Invitrogen) and 1% antibiotic/antimycotic solution (GIBCO BRL) and 1% l-glutamine. Primary hepatocytes and HeLa cells were maintained at 37°C in a 5% CO2-humidified incubator over-night. After 24 h, the medium was removed and replaced with starvation medium, Hank’s Balanced Salt Solution (Gibco 14025-050) supplemented with HEPES solution 10 mM.
The cells were collected at different times points from starvation (30 min, 1 h, 2 h, 4 h, 6 h and 8 h). The primary hepatocytes used as control were seeded at a density of 105 cultured in Williams E medium supplemented with Hepatozyme-sfm medium (Gibco 17705-021) with 5% heat-inactivated FBS (Invitrogen), 50 U Penicillin–Streptomycin 100× Solution (P/S Gibco 15140-122), 1% l-glutamine and ITS 1× (Insulin Transferrin Selenium -Sciencell 0803). HeLa cells used as control were seeded at a density of 105 and were cultured in complete medium, Dulbecco’s modified Eagle’s medium (GIBCO BRL) supplemented with 10% heat-inactivated FBS (Invitrogen)and 1% antibiotic/antimycotic solution (GIBCO BRL) and 1% l-glutamine. Animal use and analyses were conducted in accordance with the guidelines of the Animal Care and Use Committee of Cardarelli Hospital in Naples and authorized by the Italian Ministry of Health.
2.6 mRNA extraction and quantitative real-time PCR
The cells were collected at each time point, and mRNA was extracted and retro-transcribed using the RNeasy mini kit and the Quantitec reverse transcription kit (Qiagen), respectively. We performed a Quantitative Real Time PCR reaction, set up in duplicates using the LightCycler 480 SYBR green master mix (Roche), and the amplification was performed using a LightCycler 480 Real Time PCR instrument (Roche). The quantitative real-time PCR (qRT-PCRs) were carried out using different pairs of primers for human and mouse isoforms of Yeats2. Gapdh was used as control. The primer sequences for all genes are listed in Supplementary Table S4. Data analysis was performed using the LightCycler 480 Software(Roche). GAPDH mRNA levels were used to normalize the amount of mRNA, and ΔCts were calculated as the difference between the average GAPDH Ct and the average of Ct for each gene.
To asses whether genes change their expression significantly in the qRT-PCR experiments, we used the software package Bayesian Analysis of Time Series (Angelini et al., 2008). This method is based on a Bayesian Approach to automatically identify and rank differentially expressed genes from time-series data according to a Bayes Factor, where a Bayes Factor less than one means that the gene is differential express respect to the control.
3 RESULTS
3.1 Construction of a semantic database for tissue-specific GEPs
One of the main hurdles in using GEPs from public repositories is the abysmal state of the experiments’ meta-data containing information on the biological samples and experimental protocols. To select tissue-specific GEPs, we built a semantic database, structured according to a human tissue ontology (Hide et al., 2003), to retrieve and classify, in a semi-automatic fashion, microarrays from ArrayExpress (Parkinson et al., 2005). We assigned to each GEP the correct tissue, according to the available meta-data, and kept only GEPs with a reliable annotation. We were thus able to collect 2930 high-quality GEPs (Affymetrix HG-U113A and HG-U133 Plus 2.0 platforms) for 30 different tissues (Section 2 and Supplementary Tables S5 and S6).
3.2 Reverse engineering of tissue-specific gene co-regulation networks
Although Mutual Information has been shown to be a better alternative to correlation in identifying co-regulated genes (Basso et al., 2005; Belcastro et al., 2011), we decided to use the SCC owing to the limited number of GEPs available in the different tissues. We also decided not to use network pruning techniques (Faith et al., 2007; Margolin et al., 2006; Soranzo et al., 2007), as we were not interested to distinguish between direct and indirect interactions, but rather in how co-regulation among genes changes across the different tissues.
We first normalized GEPs within each tissue (Rafael et al., 2003); we then computed the SSC (Hardin et al., 2007) for each pair of probe-sets, retaining only those ones with a significant SCC (Section 2). From these 30 probe-set-wise networks, we built 30 gene-wise networks, by assigning to each probe-set the corresponding gene (Section 2).
3.3 Validation and analysis of the tissue-specific gene networks
To verify the biological relevance of the tissue-specific gene networks, we constructed two ‘Golden Standards’: (i) experimentally verified protein–protein interactions (Bossi et al., 2009; Xuebing et al., 2008) and (ii) the manually curated Reactome database of genes and proteins that participate to the same pathways (Croft et al., 2011).
For each network, we computed the percentage of co-regulated genes for which a regulatory interaction was confirmed by one of the two Golden standards [Positive Predictive Value = TP/(TP + FP)]. As shown in Supplementary Figures S2 and S3, all of the networks have a PPV significantly higher than what would be expected by chance (Section 2). As each network was constructed using a different number of GEPs, we also verified that the difference in performance across the networks was not related to the number of experiments used for the construction of each network (Supplementary Fig. S4).
As a further proof of the biological relevance of the tissue-specific co-regulation networks, we identified which interactions were conserved across the majority of the 30 networks (Supplementary Table S7): 3235 co-regulatory interactions, involving 993 distinct genes, were conserved in at least half of the tissue-specific networks. Gene Ontology Enrichment Analysis of these genes revealed an enrichment for ‘housekeeping’ functions such as ribosomal and cell cycle genes (Supplementary Fig. S5).
3.4 DINA for the identification of condition-specific pathways
Our working hypothesis is that genes belonging to a condition-specific pathway are actively co-regulated only in specific conditions when the pathway is active, but not in others, independently of their absolute level of expression.
To this end, we developed a network-based algorithm, DINA, which is able to identify whether genes in a known pathway are significantly co-regulated only in specific conditions, but not in others (Fig. 1A and Supplementary Fig. S6). The algorithm starts with a set of M genes (i.e. genes belonging to a known pathway) and a set of N networks (i.e. the 30 tissue-specific gene networks). It then computes a ‘co-regulation probability’ for the M genes in each of the N networks; this probability is proportional to the number of edges among the genes in each network. DINA then quantifies how variable the co-regulation probability is across the N networks. Variability is quantified using an entropy-based measure (H), and its significance is estimated using a permutation test (Section 2). If the M genes in the set have a similar co-regulation probability across the N networks, then the entropy H will be high; on the other hand, if the M genes have a high co-regulation probability only in one (or few) networks (i.e. the pathway activity is condition-specific) than the entropy H will be low (hence, we are interested in pathways associated to a low H).
Fig. 1.

Differential network analysis. (A) Graphic description of the DINA method to quantify the variability of co-regulation among the genes in a pathway across multiple networks. (B) Graphic description of the method used to identify the transcriptional regulators of the genes in a pathway across multiple networks
3.5 Identification of tissue-specific pathways using DINA
To test whether DINA was able to identify tissue-specific pathways, i.e. pathways that are actively regulated only in specific tissues, we used the full manually curated list of 186 KEGG pathways from MsigDb (Kanehisa et al., 2002; Liberzon et al., 2011) including signaling, metabolic and regulatory pathways. A pathway in KEGG is a set of genes known to function as a module according to the literature. From this list, we deleted disease pathways and pathways not well represented in our networks (Section 2), thus obtaining a final list of 110 pathways.
By applying DINA to the tissue-specific networks, we obtained 22 significant pathways (with corrected P ≤ 0.01, Supplementary Table S8). One of the most significant pathways (i.e. the one with lowest entropy H) was the Glycine, Serine and Threonine metabolic pathway (KEGG hsa00260). This pathway was correctly identified by DINA to be mainly regulated in liver and kidney, where most of the glycine to serine metabolism occurs (van de Poll et al., 2004). Interestingly, among the 22 significant pathways, nine are metabolic pathways enriched in liver and kidney (Supplementary Table S8 pathways in bold).
Figure 2A shows the co-regulation probability of the 32 genes in the Glycine, Serine and Threonine metabolic pathway in each of the 30 tissues, as previously defined; for comparison, Figure 2B shows the average expression level of the genes in the pathway in each of the tissues. Expression levels do not change significantly across the tissues, whereas the co-regulation probabilities (Fig. 2A) are strikingly different.
Fig. 2.

Differential network analysis of the Glycine pathway (KEGG hsa00260). (A) Co-regulation probability of the 32 genes in the Glycine pathway (hsa00260) across the 30 tissues. (B) Average expression level of the 32 genes in the Glycine pathway (hsa00260) across the thirty tissues (error bars represent one standard deviation)
We checked for the expression level of the genes encoding for the enzymes involved in this pathway also in the Gene Atlas Dataset (Su et al., 2004), a compendium of normal tissues used to identify where genes are expressed. Using the canonical expression level threshold of 200 (Su et al., 2004), we found that only 13 of 32 genes are expressed in liver, and only 2 of 32 are expressed in Kidney (Supplementary Fig. S7).
Similar considerations applied to the other significant metabolic pathways identified by DINA (with corrected P ≤ 0.01, Supplementary Table S8 pathways in bold). Hence, an approach based on expression levels (and not co-regulation) would not have been able to identify these tissue-specific metabolic pathways (for the other significant metabolic pathways refer to Supplementary Figs. S8 and S9).
3.6 Identification of transcriptional regulators of tissue-specific pathways
We wondered whether it was possible to identify TFs regulating tissue-specific pathways identified by DINA. We reasoned that a TF, controlling a tissue-specific pathway, may be co-regulated with its target genes only in that tissue but not in others (Fig. 1B). As the regulation of metabolic pathways has been well studied in the past, we decided to identify TFs involved in the regulation of the nine metabolic pathways previously identified by DINA.
To this end, we used a list of 1358 human genes including both genes, whose protein product has a verified TF activity (Ravasi et al., 2010), as well as genes encoding proteins with an indirect transcriptional activity, such as co-factors or scaffolding proteins (Stella et al., 2010). For each of the nine metabolic pathways previously identified as tissue-specific, and for each TF in the list, we applied the Fisher’s exact test (Section 2) to select TFs sharing a significant number of edges with the genes in the pathway only in the tissue(s) where the pathway is active, as shown in Figure 1B. The regulators identified for each pathway are reported in Supplementary Tables S9–S17 [together with the Benjamini–Hochberg corrected P-value (Benjamini et al., 1995)].
Table 1 lists the TFs controlling the majority (i.e. seven of nine) of the metabolic pathways according to our analysis (Section 2). Considering only genes encoding proteins with a known TF activity (Table 1 in bold), we correctly identified many nuclear receptors as specific regulators of these pathways (NR1H4, NR1I3, ESRRG, HNF4A). The nuclear receptor super-family is one of the largest group of TFs involved in the regulation of different metabolic processes (Francis et al., 2003), such as the regulation of liver metabolism (Elfaki et al., 2009).
Table 1.
Transcription Factors identification
| Symbol | Name | Role | Citations |
|---|---|---|---|
| NR1H4 | nuclear receptor subfamily 1, group H, member 4 | activator | (Forman et al., 1995; Makishima et al., 2005; Vazquez, 2012) |
| ESRRG | estrogen-related receptor gamma | activator | (Makishima et al., 2005; Sanoudou et al., 2010) |
| TRPS1 | trichorhinophalangeal syndrome I | inhibitor | |
| NR1I3 | nuclear receptor subfamily 1, group I, member 3 | activator | (Bauer et al., 2004; Makishima et al., 2005; Miao et al., 2006) |
| HNF4A | hepatocyte nuclear factor 4, alpha | activator | (Makishima et al., 2005; Rommel et al., 2003) |
| ZNF394 | zinc finger protein 394 | inhibitor | |
| TBR1 | T-box, brain, 1 | activator | |
| DAB2 | disabled homolog 2 | activator | |
| DIP2C | disco-interacting protein 2 | activator | |
| TRIM15 | tripartite motif-containing 15 | activator | |
| ASB9 | ankyrin repeat and SOCS box-containing 9 | activator | |
| YEATS2 | YEATS domain containing 2 | inhibitor | |
| SIRT4 | sirtuin 4 | activator | (Chalkiadaki et al., 2012; Nargis et al., 2010; Nidhi et al., 2007) |
Note: List of TFs regulating the majority (i.e. seven of nine) of the tissue-specific metabolic pathways. In bold genes with know TF activity, in normal text genes encoding protein indirectly involved in transcription.
For example, one of the six receptors is HNF4A, probably the most famous nuclear receptor in liver, whose mutations are responsible for monogenic autosomal dominant non-insulin-dependent diabetes mellitus type I (Desvergne et al., 2006). The protein encoded by this gene controls the expression of several genes, including hepatocyte nuclear factor 1 alpha, a TF that regulates the expression of several hepatic genes.
When we considered also genes encoding proteins indirectly involved in transcription (Ravasi et al., 2010) (Table 1 not in bold), we identified, among others, SIRT4 (sirtuin 4), a member of the sirtuins’family that plays a key role in metabolic response (Chalkiadaki et al., 2012; Nargis et al., 2010; Nidhi et al., 2007).
3.7 YEATS2: a negative transcriptional regulator of metabolic pathways
YEATS2 was predicted to be the most significant negative regulator shared by most of the metabolic pathways (Table 1). YEATS2 is expressed at low levels in both liver and kidney (Wu et al. 2009), and little is known about its function. Recently, it has been demonstrated that YEATS2 interacts with the Ada-Two-A-Containing complex (Wang et al., 2008), which, together with Spt-Ada-Gcn5-Acetyl-Transferase, is able to modulate transcription, both by causing chromatin modification and by interacting with the TATA-binding proteins (Krebs et al., 2011; Wang et al., 2008).
To validate our prediction about the involvement of YEATS2 in the transcriptional regulation of metabolism in liver, we decided to further investigate its function by perturbing hepatocytes homeostasis by starvation (Ding et al., 2009).
During starvation, a switch from anabolism to catabolism occurs (Caro-Maldonado et al., 2011): cells start to mobilize stored nutrients, such as glycogen and triglycerides, cell growth is arrested and autophagy is promoted (Ding et al., 2009; Levine et al., 2008). During starvation, there are large changes in gene expression that affect specific metabolic pathways. For example, genes involved in fatty acid β-oxidation are upregulated (Bauer et al., 2004), whereas genes involved in biosynthesis are downregulated (Sokolovic et al., 2008).
We performed a starvation time-course experiment for 8 h in both primary murine hepatocytes and in HeLa cells, by switching cells from a nutrient-rich medium to a starvation medium (Section 2). Cells were collected at different time points during starvation (30 min, 1 h, 2 h, 4 h, 6 h, 8 h). Cells grown in nutrient-rich medium were used as control.
We measured by qRT-PCR the variation in the expression level of YEATS2 in response to starvation in primary hepatocytes and HeLa cells (Fig. 3 and Supplementary Fig. S10). Yeats2 is an early response gene, quickly downregulated on starvation during the first 2 h in primary hepatocytes, as shown in Figure 3.
Fig. 3.

Yeats2 expression in hepatocyte cells during starvation. Real-time quantitative PCR measurements of the expression of Yeats2 and a set of marker genes at the indicated time-points following starvation. CRT indicates cell in rich medium. BF indicated the Bayes Factor estimated using Bayesian Analysis of Time Series algorithm. The gray area represents the standard deviation across the two biological replicates. Gene expression was quantified using the ΔCT method with Gapdh used as normalization gene
We also analyzed the expression profiles of a subset of genes whose expression levels increase following starvation (Bauer et al., 2004; Yoon et al., 2001): Pgc1a, Acaa1a, Acot2, Cyp4a10, Cyp4a14 and ApoA4 (Fig. 3). Moreover, we measured the expression profiles of CRAT, CTSB and PLIN2 in HeLa cells as shown in Supplementary Fig. S10.
These selected genes were up-regulated, as expected, during the first 4 h of starvation, as shown in Figure 3: Pgc1a (Peroxisome proliferator-activated receptor gamma, co-activator 1 alpha) encoding for a transcriptional co-activators that plays a key role in the regulation of both carbohydrate and lipid metabolism (Leone et al., 2005); Acaa1a (Acetyl-CoA acyltransferase 1A) encoding a peroxisomal thiolase operating in catabolism of fatty acid (Bauer et al., 2004) together with ACOT2 (Acyl-CoA thioesterase 2), which is localized in peroxisomes(Hunt et al., 2002); Cyp4a10 (Cytochrome P450, family 4, subfamily a, polypeptide 10) and Cyp4a14 (Cytochrome P450, family 4, subfamily a, polypeptide 14) encoding two members of Cytochrome P family able to oxidize a variety of structural compounds, as well as fatty acids (Bauer et al., 2004; van den Bosch et al., 2007). Genes involved in lipid transport showed an upregulation as well, such as ApoA4 (Apolipoprotein A4), which enhances lipid absorption by promoting the assembly and secretion of Chylomicrons (Bauer et al., 2004; Yao et al., 2011).
To probe further the role of Yeats2 and its involvement in regulation of metabolism in liver, we analyzed an existing in vivo time-series microarray experiment (ArrayExpress ID E-MEXP-748) from liver, muscle and adipose tissue of ApoE3Leiden transgenic mice, exhibiting a humanized lipid metabolism, treated with high-fat diet (HFD) for 0, 1, 6, 9, or 12 weeks (Kleemann et al., 2010). On HFD feeding, genes involved in metabolic pathways, such as lipid metabolic processes, were found to be upregulated in liver (Kleemann et al., 2010). Based on these observations, we decided to investigate the expression of Yeats2 in this mouse model considering only the liver tissue, and we found that Yeats2 expression is strongly downregulated in HFD mouse liver (P-value of  ) (Kapushesky et al., 2010; Kleemann et al., 2010).
Our results support a previously unreported role of the scaffolding protein YEATS2 in transcriptional control of the metabolic response and demonstrate that DINA can be applied to identify regulators of tissue-specific pathways.
3.8 Identification of disease-specific pathways dysregulation using DINA
Gene expression alteration is a common molecular hallmark of cancer progression. The identification of cancer genetic signatures has been successfully exploited for understanding the mechanisms of cancer development (Watters et al., 2006), as well as for anticancer therapies selection (Rothenberg et al., 2003) and diseases prognosis (Dracopoli et al., 2005). Moreover, specific cancer-regulated gene networks have been identified (Mani et al., 2008; Stella et al., 2010). We wondered whether DINA could be successfully used to identify selective alterations of co-regulated gene networks in cancer. As a study model, we focused on hepatocellular carcinoma, as several cell-lines modeling HCC progression are available, as well as GEPs measured in these cell lines. HCC progression involves alterations in many signaling pathways, such as EGF-Ras-MAPK, AKT-mTOR, Jak-Stat and NF-kB cascades (Llovet et al., 2008). In addition, inactivating mutations of the tumor suppressor p53, or p53 loss of expression, are among the most frequent genetic events associated with hepatocyte transformation (Bressac et al., 1990; Hinds et al., 1987), and the dysregulation of p53-dependent genes have been observed in HCC (Hailfinger et al., 2007; Hsu et al., 1993).
Here, we collected 161 GEPs (Supplementary Table S18) for three human cell-lines: primary hepatocytes (40 GEPs), hepatoblastoma-derived cell line HepG2 (39 GEPs) and Hepatocarcinona-derived cell line (Huh7) (82 GEPs). We first tested the ability of DINA to identify DC of p53-dependent genes across the three cell lines. To this purpose, we built a gene signature made up by 34 experimentally validated direct transcriptional targets of p53 (Lim et al., 2007), and we then applied DINA to this gene signature, as shown in Figure 4.
Fig. 4.

Differential Network Analysis of the p53 gene signature in primary and transformed heptocytes. The gene signature consists of 34 bona fide transcriptional targets of p53. (A) p53 expression level in the three cell-lines for the two probes present in Affy HG-U133A platform. (B) Comparison between the co-regulation probability of the genes in the signature (black) and their average expression level
DINA successfully detected a DC of the p53 target genes across the three cell lines: the co-regulation probability is high in normal hepatocytes and to a lesser extent in hepatocellular carcinoma HEPG2 cell line, carrying a wild-type p53 protein, and decreases significantly in Huh7 cell line, carrying an inactive p53 protein (Bressac et al., 1990) (Fig. 4B). Interestingly, the expression level of the p53-target genes did not correlate with the functional status of the p53 protein in the different cell lines, thus supporting our previous observation (Fig. 4A) that an expression-based method would be less powerful than the DINA in identifying dysregulated pathways.
We next applied DINA to identify dysregulated pathways during hepatocytes transformation. The DINA-based analysis of the 110 KEGG pathways identified at least four pathways whose co-regulation is significantly disrupted in the HCC cell lines compared with the normal hepatocytes (Supplementary Table S19). Similarly to the previous results, the average expression levels of the genes in these pathways did not change significantly between normal and transformed hepatocytes.
Interestingly, the most significant loss of co-regulation observed in transformed hepatocytes involves the peroxisome metabolism (KEGG ko04146), the primary bile acid biosynthesis (map00120) and the glyoxylate and dicarboxylate metabolism (map00630): these pathways are responsible for fundamental functions in liver cells such as the synthesis of bile acids, cholesterol, the oxidation of fatty acid, the metabolism of phenyalanine, the glyoxylate and the tyrosine metabolism. Moreover, among the other dysregulated pathways identified by DINA, we found disruption of fundamental pathways regulating liver cancer progression such as the PPAR signaling pathway (Supplementary Table S19).
To gain further insights into the dysregualtion of the peroxisome metabolism, we analyzed the changes in the gene co-regulation network among the corresponding genes across the three cell lines. Figure 5A and B demonstrates that there is a major loss of co-regulation among peroxisome-related genes in both HepG2 and Huh7 HCC cell lines; moreover, this loss mainly results from dysregulation of genes involved in peroxisomal fatty acid β-oxidation (e.g. ACOX, EHHADH, ACAA1) and genes involved in the control of the H202 metabolism (e.g. CAT and SOD). Notably, these genes are regulated by the peroxisome proliferator-activated receptor alpha (PPARalpha) (Reddy et al., 2001) and the LXR family TFs (Hu et al., 2005).
Fig. 5.

Differential Network Analysis of the peroxisome KEGG pathway (M6391) in primary and transformed hepatocytes. Genes in the peroxisome pathway are represented as circles; a significant co-regulation between two genes as a line. The size of the circles is proportional to the difference in the number of edges between the network in transformed hepatocytes versus primary hepatocytes. Gray lines represent edges lost in the network compared with primary cells. (A) HepG2 versus primary hepatocyte; (B) Huh7 versus primary hepatocyte
Thus, our results indicate that the dysregulation in the activity of these liver-specific transcription regulators may represent a recurrent event associated with HCC. Consistent with these results, peroxisome and PPARalpha pathway alterations have been definitely associated with liver cell proliferation and with HCC development (Gonzalez et al., 2008), confirming the efficacy and specificity of DINA algorithm in identifying condition-specific pathway regulation.
4 DISCUSSION AND CONCLUSION
In this study, we hypothesized that genes belonging to a tissue-specific pathway are actively co-regulated, and hence co-regulated, only in specific tissues where the pathway is active, but not in others, independently of their absolute level of expression. We proposed an approach (DINA) based on quantifying the variability in the co-regulation probability of genes across tissues or conditions. DINA is based on detecting differences in the number of edges among genes in a pathway across a set of networks, and, therefore, it can be applied to any kind of network, independently of how this is generated. DINA, however, is not able to detect distinct network topologies that have equal density. Differently from other methods, DINA does not aim at identifying de novo subnetworks of genes, but rather at identifying whether a known pathway (or a set of genes of interest) is differentially coregulated across a set of conditions.
We derived 30 tissue-specific gene co-regulation networks and identified several metabolic pathways as the most differentially regulated across the tissues, and specifically active in liver and kidney. Usually, tissue specificity of a gene, or of a pathway, is assessed by quantifying the expression level of the genes in the concerned tissue (Shlomi et al., 2008). However, observing gene expression only could be not sufficient, as in the case of metabolic pathways (Gille et al., 2010). Here, we show that an alternative possibility is to check whether the genes involved in the same pathway are specifically co-regulated in the concerned tissue. Of note, a similar approach has been successfully applied in yeast (Kharchenko et al., 2005).
We also demonstrated that tissue-specific targets of a TF tend to be co-regulated with the TF in a tissue-specific manner. Hence, we developed a new method based on the Fisher’s exact test to identify tissue specific TFs. We tested this approach to identify regulators of tissue-specific metabolic pathways and correctly identified Nuclear Receptors as their main regulators. We were also able to identify a new putative tissue-specific negative regulator of heptocyte metabolism (Yeats2). Finally, we showed that DINA can be used to analyze GEPs obtained during disease progression to make hypotheses on dysregulated pathways.
The identification of differential expressed genes in disease compared with normal conditions is a standard practice in laboratories all over the world, and it has led to countless new discoveries. However, differentially expressed genes are only a proxy for finding dysregulated pathways. Indeed, the real question one would like to answer is which pathways get dysregulated during disease progression, to understand the pathogenic mechanisms. Recent efforts have shown that using high-throughput phospho-proteomics in conjunction with signaling network models can be used to identify differences in signaling pathways between normal and transformed hepatocytes (Saez-Rodriguez et al., 2011).
Here, we demonstrated that DINA is able to gain information about HCC-specific metabolic and transcriptional pathway dysregulation by quantifying changes in co-regulation among genes across primary and transformed hepatocytes. It remains to be seen whether changes in signaling pathway activity can be detected using only a transcription-based approach such as DINA.
We also implemented an on-line web tool (http://dina.tigem.it) enabling the user to apply DINA to identify tissue-specific pathways or gene signatures.
Supplementary Material
ACKNOWLEDGEMENTS
The authors thank Eduardo Nusco and Lucia Perone for help in primary cultures of mouse hepatocytes.
Funding: Italian Telethon Foundation (Grant TGM11SB1), the EU FP7 MODHEP (Grant 259743-2) (to D.dB.).
Conflict of Interest: none declared.
REFERENCES
- Angelini C, et al. BATS: a bayesian user-friendly software for analyzing time series microarray experiments. BMC Bioinformatics. 2008;9:415. doi: 10.1186/1471-2105-9-415. [DOI] [PMC free article] [PubMed] [Google Scholar]
- Ballester B, et al. Consistent annotation of gene expression arrays. BMC Genomics. 2010;11:294. doi: 10.1186/1471-2164-11-294. [DOI] [PMC free article] [PubMed] [Google Scholar]
- Bansal M, et al. How to infer gene networks from expression profiles. Mol. Syst. Biol. 2007;3:78. doi: 10.1038/msb4100120. [DOI] [PMC free article] [PubMed] [Google Scholar]
- Basso K, et al. Reverse engineering of regulatory networks in human b cells. Nat. Genet. 2005;37:382–390. doi: 10.1038/ng1532. [DOI] [PubMed] [Google Scholar]
- Bauer M, et al. Starvation response in mouse liver shows strong correlation with life-span-prolonging processes. Physiol Genomics. 2004;17:230–244. doi: 10.1152/physiolgenomics.00203.2003. [DOI] [PubMed] [Google Scholar]
- Belcastro V, et al. Transcriptional gene network inference from a massive dataset elucidates transcriptome organization and gene function. Nucleic Acids Res. 2011;39:8677–8688. doi: 10.1093/nar/gkr593. [DOI] [PMC free article] [PubMed] [Google Scholar]
- Benjamini Y, et al. Controlling the false discovery rate: a practical and powerful approach to multiple testing. J. R. Stat. Soc. Ser. B. 1995;57:289–300. [Google Scholar]
- Bossi A, et al. Tissue specificity and the human protein interaction network. Mol. Syst. Biol. 2009;5:260. doi: 10.1038/msb.2009.17. [DOI] [PMC free article] [PubMed] [Google Scholar]
- Brazma A, et al. Minimum information about a microarray experiment (miame)-toward standards for microarray data. Nat. Genet. 2001;29:365–371. doi: 10.1038/ng1201-365. [DOI] [PubMed] [Google Scholar]
- Bressac B, et al. Abnormal structure and expression of p53 gene in human hepatocellular carcinoma. Proc. Natl. Acad. Sci. USA. 1990;87:1973–1977. doi: 10.1073/pnas.87.5.1973. [DOI] [PMC free article] [PubMed] [Google Scholar]
- Caro-Maldonado A, et al. Dying for something to eat: how cells respond to starvation. Open Cell Signal. J. 2011;3:42–51. [Google Scholar]
- Chalkiadaki A, et al. Sirtuins mediate mammalian metabolic responses to nutrient availability. Nat Rev Endocrinol. 2012;8:287–296. doi: 10.1038/nrendo.2011.225. [DOI] [PubMed] [Google Scholar]
- Choi YJ, et al. Statistical methods for gene set co-expression analysis. Bioinformatics. 2009;25:2780–2786. doi: 10.1093/bioinformatics/btp502. [DOI] [PMC free article] [PubMed] [Google Scholar]
- Croft D, et al. Reactome: a database of reactions, pathways and biological processes. Nucleic Acids Res. 2011;39:D691–D697. doi: 10.1093/nar/gkq1018. [DOI] [PMC free article] [PubMed] [Google Scholar]
- de la Fuente A. From ‘differential expression’ to ‘differential networking’—identification of dysfunctional regulatory networks in diseases. Trends Genet. 2010;26:326–333. doi: 10.1016/j.tig.2010.05.001. [DOI] [PubMed] [Google Scholar]
- Desvergne B, et al. Transcriptional regulation of metabolism. Physiol. Rev. 2006;86:465–514. doi: 10.1152/physrev.00025.2005. [DOI] [PubMed] [Google Scholar]
- Ding WX, et al. Analyzing macroautophagy in hepatocytes and the liver. Methods Enzymol. 2009;453:397–416. doi: 10.1016/S0076-6879(08)04020-2. [DOI] [PubMed] [Google Scholar]
- Dracopoli NC, et al. Development of oncology drug response markers using transcription profiling. Curr. Mol. Med. 2005;5:103–110. doi: 10.2174/1566524053152852. [DOI] [PubMed] [Google Scholar]
- Elfaki DA, et al. Review article: nuclear receptors and liver disease–current understanding and new therapeutic implications. Aliment. Pharmacol. Ther. 2009;30:816–825. doi: 10.1111/j.1365-2036.2009.04104.x. [DOI] [PubMed] [Google Scholar]
- Faith JJ, et al. Large-scale mapping and validation of escherichia coli transcriptional regulation from a compendium of expression profiles. PLoS Biol. 2007;5:e8. doi: 10.1371/journal.pbio.0050008. [DOI] [PMC free article] [PubMed] [Google Scholar]
- Ferrari F, et al. Novel definition files for human genechips based on geneannot. BMC Bioinformatics. 2007;8:446. doi: 10.1186/1471-2105-8-446. [DOI] [PMC free article] [PubMed] [Google Scholar]
- Forman BM, et al. Identification of a nuclear receptor that is activated by farnesol metabolites. Cell. 1995;81:687–693. doi: 10.1016/0092-8674(95)90530-8. [DOI] [PubMed] [Google Scholar]
- Francis GA, et al. Nuclear receptors and the control of metabolism. Annu. Rev. Physiol. 2003;65:261–311. doi: 10.1146/annurev.physiol.65.092101.142528. [DOI] [PubMed] [Google Scholar]
- Gille C, et al. HepatoNet1: a comprehensive metabolic reconstruction of the human hepatocyte for the analysis of liver physiology. Mol. Syst. Biol. 2010;6:411. doi: 10.1038/msb.2010.62. [DOI] [PMC free article] [PubMed] [Google Scholar]
- Gonzalez FJ, et al. PPARalpha: Mechanism of species differences and hepatocarcinogenesis of peroxisome proliferators. Toxicology. 2008;246:2–8. doi: 10.1016/j.tox.2007.09.030. [DOI] [PubMed] [Google Scholar]
- Hailfinger S, et al. Regulation of p53 stability in p53 mutated human and mouse hepatoma cells. Int. J. Cancer. 2007;120:1459–1464. doi: 10.1002/ijc.22519. [DOI] [PubMed] [Google Scholar]
- Hakvoort TB, et al. Interorgan coordination of the murine adaptive response to fasting. J. Biol. Chem. 2011;286:16332–16343. doi: 10.1074/jbc.M110.216986. [DOI] [PMC free article] [PubMed] [Google Scholar]
- Hardin J, et al. A robust measure of correlation between two genes on a microarray. BMC Bioinformatics. 2007;8:220. doi: 10.1186/1471-2105-8-220. [DOI] [PMC free article] [PubMed] [Google Scholar]
- Hide W, et al. Application of eVOC: controlled vocabularies for unifying gene expression data. C. R. Biol. 2003;326:1089–1096. doi: 10.1016/j.crvi.2003.09.030. [DOI] [PubMed] [Google Scholar]
- Hinds PW, et al. Immunological evidence for the association of p53 with a heat shock protein, hsc70, in p53-plus-ras-transformed cell lines. Mol. Cell. Biol. 1987;7:2863–2869. doi: 10.1128/mcb.7.8.2863. [DOI] [PMC free article] [PubMed] [Google Scholar]
- Hsu IC, et al. p53 gene mutation and integrated hepatitis b viral DNA sequences in human liver cancer cell lines. Carcinogenesis. 1993;14:987–992. doi: 10.1093/carcin/14.5.987. [DOI] [PubMed] [Google Scholar]
- Hu T, et al. Hepatic peroxisomal fatty acid beta-oxidation is regulated by liver x receptor alpha. Endocrinology. 2005;146:5380–5387. doi: 10.1210/en.2005-0591. [DOI] [PubMed] [Google Scholar]
- Hunt MC, et al. The role Acyl-CoA thioesterases play in mediating intracellular lipid metabolism. Prog. Lipid Res. 2002;41:99–130. doi: 10.1016/s0163-7827(01)00017-0. [DOI] [PubMed] [Google Scholar]
- Ideker T, et al. Discovering regulatory and signalling circuits in molecular interaction networks. Bioinformatics. 2002;18:1233–1240. doi: 10.1093/bioinformatics/18.suppl_1.s233. [DOI] [PubMed] [Google Scholar]
- Ideker T, et al. Differential network biology. Mol. Syst. Biol. 2012;8:565. doi: 10.1038/msb.2011.99. [DOI] [PMC free article] [PubMed] [Google Scholar]
- Jagoe RT, et al. Patterns of gene expression in atrophying skeletal muscles: response to food deprivation. FASEB J. 2002;16:1697–1712. doi: 10.1096/fj.02-0312com. [DOI] [PubMed] [Google Scholar]
- Kanehisa M, et al. The KEGG database. Novartis Found. Symp. 2002;247:91–101. discussion 101–103, 119–128, 244–252. [PubMed] [Google Scholar]
- Kapushesky M, et al. Gene expression atlas at the European bioinformatics institute. Nucleic Acids Res. 2010;38:D690–D698. doi: 10.1093/nar/gkp936. [DOI] [PMC free article] [PubMed] [Google Scholar]
- Kharchenko P, et al. Expression dynamics of a cellular metabolic network. Mol. Syst. Biol. 2005;1:2005. doi: 10.1038/msb4100023. [DOI] [PMC free article] [PubMed] [Google Scholar]
- Kleemann R, et al. Time-resolved and tissue-specific systems analysis of the pathogenesis of insulin resistance. PLoS One. 2010;5:e8817. doi: 10.1371/journal.pone.0008817. [DOI] [PMC free article] [PubMed] [Google Scholar]
- Kostka D, et al. Finding disease specific alterations in the co-expression of genes. Bioinformatics. 2004;20(Suppl. 1):i194–i199. doi: 10.1093/bioinformatics/bth909. [DOI] [PubMed] [Google Scholar]
- Krebs A, et al. SAGA and ATAC histone acetyl transferase complexes regulate distinct sets of genes and ATAC defines a class of p300-independent enhancers. Mol. Cell. 2011;44:410–423. doi: 10.1016/j.molcel.2011.08.037. [DOI] [PMC free article] [PubMed] [Google Scholar]
- Langfelder P, et al. Is my network module preserved and reproducible? PLoS Comput. Biol. 2011;7:e1001057. doi: 10.1371/journal.pcbi.1001057. [DOI] [PMC free article] [PubMed] [Google Scholar]
- Leonardson AS, et al. The effect of food intake on gene expression in human peripheral blood. Hum. Mol. Genet. 2010;19:159–169. doi: 10.1093/hmg/ddp476. [DOI] [PMC free article] [PubMed] [Google Scholar]
- Leone T, et al. PGC-1alpha deficiency causes multi-system energy metabolic derangements: muscle dysfunction, abnormal weight control and hepatic steatosis. PLoS Biol. 2005;3:e101. doi: 10.1371/journal.pbio.0030101. [DOI] [PMC free article] [PubMed] [Google Scholar]
- Levine B, et al. Autophagy in the pathogenesis of disease. Cell. 2008;132:27–42. doi: 10.1016/j.cell.2007.12.018. [DOI] [PMC free article] [PubMed] [Google Scholar]
- Liberzon A, et al. Molecular signatures database (MSigDB) 3.0. Bioinformatics. 2011;27:1739–1740. doi: 10.1093/bioinformatics/btr260. [DOI] [PMC free article] [PubMed] [Google Scholar]
- Lim YP, et al. The p53 knowledgebase: an integrated information resource for p53 research. Oncogene. 2007;26:1517–1521. doi: 10.1038/sj.onc.1209952. [DOI] [PubMed] [Google Scholar]
- Llovet JM, et al. Molecular targeted therapies in hepatocellular carcinoma. Hepatology. 2008;48:1312–1327. doi: 10.1002/hep.22506. [DOI] [PMC free article] [PubMed] [Google Scholar]
- Ma H, et al. COSINE: COndition-SpecIfic sub-NEtwork identification using a global optimization method. Bioinformatics. 2011;27:1290–1298. doi: 10.1093/bioinformatics/btr136. [DOI] [PMC free article] [PubMed] [Google Scholar]
- Makishima M, et al. Nuclear receptors as targets for drug development: regulation of cholesterol and bile acid metabolism by nuclear receptors. J. Pharmacol. Sci. 2005;97:177–183. doi: 10.1254/jphs.fmj04008x4. [DOI] [PubMed] [Google Scholar]
- Mani KM, et al. A systems biology approach to prediction of oncogenes and molecular perturbation targets in B-cell lymphomas. Mol. Syst. Biol. 2008;4:169. doi: 10.1038/msb.2008.2. [DOI] [PMC free article] [PubMed] [Google Scholar]
- Marbach D, et al. Revealing strengths and weaknesses of methods for gene network inference. Proc. Natl. Acad. Sci. USA. 2010;107:6286–6291. doi: 10.1073/pnas.0913357107. [DOI] [PMC free article] [PubMed] [Google Scholar]
- Margolin AA, et al. ARACNE: an algorithm for the reconstruction of gene regulatory networks in a mammalian cellular context. BMC Bioinformatics. 2006;7:S7. doi: 10.1186/1471-2105-7-S1-S7. [DOI] [PMC free article] [PubMed] [Google Scholar]
- Miao J, et al. Functional inhibitory cross-talk between constitutive androstane receptor and hepatic nuclear factor-4 in hepatic lipid/glucose metabolism is mediated by competition for binding to the dr1 motif and to the common coactivators, GRIP-1 and PGC-1alpha. J. Biol. Chem. 2006;281:14537–14546. doi: 10.1074/jbc.M510713200. [DOI] [PubMed] [Google Scholar]
- Nargis N, et al. SIRT4 regulates fatty acid oxidation and mitochondrial gene expression in liver and muscle cells. J. Biol. Chem. 2010;285:31995–32002. doi: 10.1074/jbc.M110.124164. [DOI] [PMC free article] [PubMed] [Google Scholar]
- Nidhi A, et al. Regulation of insulin secretion by SIRT4, a mitochondrial ADP-ribosyltransferase. J. Biol. Chem. 2007;282:33583–33592. doi: 10.1074/jbc.M705488200. [DOI] [PubMed] [Google Scholar]
- Odibat O, et al. Ranking differential hubs in gene co-expression networks. J. Bioinform. Comput. Biol. 2012;10:1240002. doi: 10.1142/S0219720012400021. [DOI] [PubMed] [Google Scholar]
- Parkinson H, et al. ArrayExpress—a public repository for microarray gene expression data at the EBI. Nucleic Acids Res. 2005;33:D553–D555. doi: 10.1093/nar/gki056. [DOI] [PMC free article] [PubMed] [Google Scholar]
- Pichard L, et al. Human hepatocyte culture. Methods Mol. Biol. 2006;320:283–293. doi: 10.1385/1-59259-998-2:283. [DOI] [PubMed] [Google Scholar]
- Rafael A, et al. Summaries of affymetrix genechip probe level data. Nucleic Acids Res. 2003;31:e15. doi: 10.1093/nar/gng015. [DOI] [PMC free article] [PubMed] [Google Scholar]
- Ravasi T, et al. An atlas of combinatorial transcriptional regulation in mouse and man. Cell. 2010;140:744–752. doi: 10.1016/j.cell.2010.01.044. [DOI] [PMC free article] [PubMed] [Google Scholar]
- Reddy J, et al. Peroxisomal beta-oxidation and peroxisome proliferator-activated receptor alpha: an adaptive metabolic system. Annu. Rev. Nutr. 2001;21:193–230. doi: 10.1146/annurev.nutr.21.1.193. [DOI] [PubMed] [Google Scholar]
- Reverter A, et al. Simultaneous identification of differential gene expression and connectivity in inflammation, adipogenesis and cancer. Bioinformatics. 2006;22:2396–2404. doi: 10.1093/bioinformatics/btl392. [DOI] [PubMed] [Google Scholar]
- Rommel G, et al. The orphan nuclear receptor HNF4alpha determines PXR- and CAR-mediated xenobiotic induction of CYP3A4. Nat. Med. 2003;9:220–224. doi: 10.1038/nm815. [DOI] [PubMed] [Google Scholar]
- Rothenberg ML, et al. Improving the evaluation of new cancer treatments: challenges and opportunities. Nat. Rev. Cancer. 2003;3:303–309. doi: 10.1038/nrc1047. [DOI] [PubMed] [Google Scholar]
- Saez-Rodriguez J, et al. Comparing signaling networks between normal and transformed hepatocytes using discrete logical models. Cancer Res. 2011;71:5400–5411. doi: 10.1158/0008-5472.CAN-10-4453. [DOI] [PMC free article] [PubMed] [Google Scholar]
- Sales G, et al. graphite—a bioconductor package to convert pathway topology to gene network. BMC Bioinformatics. 2012;13:20. doi: 10.1186/1471-2105-13-20. [DOI] [PMC free article] [PubMed] [Google Scholar]
- Sanoudou D, et al. Role of Esrrg in the fibrate-mediated regulation of lipid metabolism genes in human ApoA-I transgenic mice. Pharmacogenomics J. 2010;10:165–179. doi: 10.1038/tpj.2009.51. [DOI] [PMC free article] [PubMed] [Google Scholar]
- Shlomi T, et al. Network-based prediction of human tissue-specific metabolism. Nat. Biotechnol. 2008;26:1003–1010. doi: 10.1038/nbt.1487. [DOI] [PubMed] [Google Scholar]
- Sokolovic M, et al. The transcriptomic signature of fasting murine liver. BMC Genomics. 2008;9:528. doi: 10.1186/1471-2164-9-528. [DOI] [PMC free article] [PubMed] [Google Scholar]
- Soranzo N, et al. Comparing association network algorithms for reverse engineering of large-scale gene regulatory networks: synthetic versus real data. Bioinformatics. 2007;23:1640–1647. doi: 10.1093/bioinformatics/btm163. [DOI] [PubMed] [Google Scholar]
- Stella M, et al. The transcriptional network for mesenchymal transformation of brain tumours. Nature. 2010;463:318–325. doi: 10.1038/nature08712. [DOI] [PMC free article] [PubMed] [Google Scholar]
- Su AI, et al. A gene atlas of the mouse and human protein-encoding transcriptomes. Proc. Natl Acad. Sci. USA. 2004;101:6062–6067. doi: 10.1073/pnas.0400782101. [DOI] [PMC free article] [PubMed] [Google Scholar]
- Sumazin P, et al. An extensive MicroRNA-mediated network of RNA-RNA interactions regulates established oncogenic pathways in glioblastoma. Cell. 2011;147:370–381. doi: 10.1016/j.cell.2011.09.041. [DOI] [PMC free article] [PubMed] [Google Scholar]
- van de Poll M, et al. Renal metabolism of amino acids: its role in interorgan amino acid exchange. Am. J. Clin. Nutr. 2004;79:185–197. doi: 10.1093/ajcn/79.2.185. [DOI] [PubMed] [Google Scholar]
- van den Bosch H, et al. Gene expression of transporters and phase I/II metabolic enzymes in murine small intestine during fasting. BMC Genomics. 2007;8:267. doi: 10.1186/1471-2164-8-267. [DOI] [PMC free article] [PubMed] [Google Scholar]
- Vazquez M, et al. Molecular mechanisms underlying the link between nuclear receptor function and cholesterol gallstone formation. J. Lipids. 2012;2012:547643. doi: 10.1155/2012/547643. [DOI] [PMC free article] [PubMed] [Google Scholar]
- Wang Y, et al. Human ATAC is a GCN5/PCAF-containing acetylase complex with a novel NC2-like histone fold module that interacts with the TATA-binding protein. J. Biol. Chem. 2008;283:33808–33815. doi: 10.1074/jbc.M806936200. [DOI] [PMC free article] [PubMed] [Google Scholar]
- Watson M, et al. CoXpress: differential co-expression in gene expression data. BMC Bioinformatics. 2006;7:509. doi: 10.1186/1471-2105-7-509. [DOI] [PMC free article] [PubMed] [Google Scholar]
- Watters JW, et al. Developing gene expression signatures of pathway deregulation in tumors. Mol. Cancer Ther. 2006;5:2444–2449. doi: 10.1158/1535-7163.MCT-06-0340. [DOI] [PubMed] [Google Scholar]
- Wu C, et al. BioGPS: an extensible and customizable portal for querying and organizing gene annotation resources. Genome Biol. 2009;10:R130. doi: 10.1186/gb-2009-10-11-r130. [DOI] [PMC free article] [PubMed] [Google Scholar]
- Xuebing W, et al. Network-based global inference of human disease genes. Mol. Syst. Biol. 2008;4:189. doi: 10.1038/msb.2008.27. [DOI] [PMC free article] [PubMed] [Google Scholar]
- Yao Y, et al. Regulation of microsomal triglyceride transfer protein by apolipoprotein A-IV in newborn swine intestinal epithelial cells. Am. J. Physiol. Gastrointest. Liver Physiol. 2011;300:G357–G363. doi: 10.1152/ajpgi.00353.2010. [DOI] [PMC free article] [PubMed] [Google Scholar]
- Yinglei L, et al. A statistical method for identifying differential gene-gene co-expression patterns. Bioinformatics. 2004;20:3146–3155. doi: 10.1093/bioinformatics/bth379. [DOI] [PubMed] [Google Scholar]
- Yoon JC, et al. Control of hepatic gluconeogenesis through the transcriptional coactivator PGC-1. Nature. 2001;413:131–138. doi: 10.1038/35093050. [DOI] [PubMed] [Google Scholar]
Associated Data
This section collects any data citations, data availability statements, or supplementary materials included in this article.