

Crystal structures of MauG in complexes with MADH with its TTQ cofactor in the quinone and quinol forms are reported.
Keywords: heme, tryptophan tryptophylquinone, long-range electron transfer, protein complex
Abstract
MauG has been cocrystallized with methylamine dehydrogenase (MADH) with its TTQ cofactor in the o-quinol (TTQOQ) and quinone (TTQOX) forms and the structures of the resulting complexes have been solved. The TTQOQ structure crystallized in either space group P21 or C2, while the TTQOX structure crystallized in space group P1. The previously solved structure of MauG in complex with MADH bearing an incompletely formed TTQ cofactor (preMADH) also crystallized in space group P1, although with different unit-cell parameters. Despite the changes in crystal form, the structures are virtually identical, with only very minor changes at the protein–protein interface. The relevance of these structures with respect to the measured changes in affinity between MauG and various forms of MADH is discussed.
1. Introduction
Methylamine dehydrogenase (MADH) utilizes a catalytic tryptophan tryptophylquinone (TTQ) cofactor to catalyze the oxidative deamination of methylamine to ammonia and formaldehyde (McIntire et al., 1991 ▶). The biosynthesis of TTQ requires post-translational modification of Trp57 (βTrp57) and Trp108 (βTrp108) of the small β-subunit of the α2β2 MADH heterotetramer (Davidson, 2011 ▶). MauG is a c-type di-heme enzyme that is required to complete this post-translational modification. Expression of MADH in a background bearing a deleterious mutation of MauG results in an inactive precursor (preMADH) bearing an incompletely formed cofactor with only a single hydroxyl group inserted into βTrp57 (preTTQ; Pearson et al., 2004 ▶). MauG catalyzes the final six-electron oxidation of preTTQ in vitro using either H2O2 or reducing equivalents and O2 to yield the mature TTQ cofactor (Wang et al., 2005 ▶).
The MauG–preMADH complex has been crystallized in a triclinic unit cell and its structure has been solved (PDB entry 3l4m; Jensen et al., 2010 ▶). Two MauG molecules are found associated with the α2β2 preMADH tetramer in the asymmetric unit. Despite the fact that the preTTQ site is over 40 Å away from the heme that binds H2O2, these crystals are catalytically active upon addition of H2O2. The reaction proceeds by long-range electron transfer from the preTTQ site to the hemes of MauG via an interface tryptophan residue, MauG Trp199 (Tarboush et al., 2011 ▶). The active form of MauG is an unusual bis-iron(IV) heme species which extracts two electrons from its preMADH substrate to reform the resting di-iron(III) state (Li et al., 2008 ▶). However, since MauG-dependent TTQ biosynthesis is a six-electron oxidation, biosynthetic intermediates are clearly formed (Fig. 1 ▶). The first two-electron oxidation is the formation of the C—C bond between the tryptophan residues (Yukl et al., 2013 ▶) followed by the second hydroxylation of βTrp57 to yield an o-quinol species (TTQOQ). The final two-electron oxidation then yields the quinone form of the cofactor (TTQOX) (Li et al., 2006 ▶). The only significant conformational change during the entire process is an approximately 20° rotation of the βTrp57 side chain which accompanies cross-link formation (Yukl et al., 2013 ▶).
Figure 1.
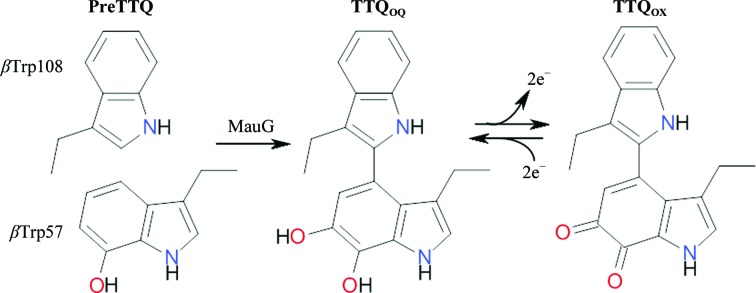
TTQ cofactor maturation by MauG and reversible oxidation and reduction between the TTQOX and TTQOQ forms.
The final step in TTQ formation is fully reversible, and reduction of TTQOX to TTQOQ can be achieved by the addition of dithionite (Husain et al., 1987 ▶). Here, we present structures of both TTQOQ and TTQOX MADH cocrystallized with MauG. Interestingly, although the structures are virtually identical to that of the MauG–preMADH complex, neither is in the same unit cell. Furthermore, the TTQOQ MADH complex crystallizes in two different monoclinic space groups as opposed to the triclinic MauG–preMADH structure. The impact of the oxidation state of TTQ on the MauG–MADH interface and crystal packing is discussed.
2. Methods
Native MADH with the mature TTQOX cofactor was purified from Paracoccus denitrificans as described previously (Davidson, 1990 ▶). MauG was homologously expressed in P. denitrificans and purified by nickel-affinity chromatography as described previously (Wang et al., 2003 ▶). The cocrystallization conditions were very similar to those for the MauG–preMADH complex (Jensen et al., 2010 ▶). Briefly, MauG and TTQOX MADH were combined at 100 and 50 µM (in terms of MADH tetramer), respectively, in 10 mM potassium phosphate pH 7.5. For the TTQOQ MADH complex, protein and reservoir solutions were made anaerobic by purging with argon gas and brought into an anaerobic glovebox (Belle Technologies, UK) maintained at ambient temperature and ≤1.0 p.p.m. O2. Sodium dithionite was added to both protein and reservoir solutions at a final concentration of 2 mM. MauG and MADH proteins were also purged and reduced separately in some experiments prior to crystallization. Upon the addition of dithionite to TTQOX MADH alone, the solution went from green to colorless, consistent with reduction to the TTQOQ state. 1 µl protein solution was combined with 3 µl reservoir solution consisting of 0.1 M sodium acetate, 0.1 M MES pH 6.4, 22–26% PEG 8000. Plate-like crystals were grown by hanging-drop vapor diffusion, appearing within several days and reaching full size within 3–4 weeks. The crystals were cryoprotected by soaking them in reservoir solution containing 10% PEG 400 and were cryocooled in liquid nitrogen. For the TTQOQ MADH crystals, cryoprotection and cryocooling were performed in the glovebox using a liquid-nitrogen port to prevent reaction with oxygen.
X-ray diffraction data were collected on GM/CA-CAT beamlines 23-ID-D and 23-ID-B of the Advanced Photon Source (APS), Argonne National Laboratory, Argonne, Illinois, USA. Data were collected at 100 K using a beam size matching the dimensions of the largest crystal face. The data were processed with HKL-2000 (Otwinowski & Minor, 1997 ▶). All structures were solved by molecular replacement using Phaser (McCoy et al., 2007 ▶) from the CCP4 program suite (Winn et al., 2011 ▶) with the entire MauG–preMADH complex (PDB entry 3l4m; Jensen et al., 2010 ▶) as the search model. Restrained refinement with TLS was carried out using REFMAC (Murshudov et al., 2011 ▶) in the CCP4 program suite (Winn et al., 2011 ▶) and model building was carried out in Coot (Emsley & Cowtan, 2004 ▶; Emsley et al., 2010 ▶).
3. Results and discussion
Cocrystallization of TTQOX MADH with MauG could be performed under ambient conditions, whereas the MauG–TTQOQ MADH crystals had to be grown in an anaerobic glovebox in the presence of 2 mM dithionite to generate and preserve the reduced state of both the MauG hemes and the TTQOQ cofactor. Both treatments yielded diffraction-quality crystals under nearly identical conditions to those used for the crystallization of MauG–preMADH. Like MauG–preMADH, the MauG–TTQOX MADH complex crystallized in space group P1 with two MauG monomers bound to the MADH tetramer in the asymmetric unit. However, the unit-cell parameters for these crystals were significantly different (Table 1 ▶). For MauG–TTQOQ MADH, monoclinic crystals were grown in either space group P21 or C2. Electron density at the TTQ site for all three crystal forms showed clear density for TTQOQ or TTQOX, which are structurally indistinguishable within the resolution of the data (Figs. 2 ▶ a–2 ▶ c). A single water molecule is within hydrogen-bonding distance (2.7–3.1 Å) of the O6 atom of TTQ in all three structures at an angle (91–107°) which is more consistent with the presence of TTQOQ than of TTQOX. Furthermore, the arrangement of amino-acid side chains around the TTQ site is essentially identical in all three structures (Fig. 2 ▶ d). It has previously been observed that TTQOX is rapidly reduced to the TTQOQ form during X-ray data collection (Pearson et al., 2007 ▶), suggesting that we may be observing a majority of TTQOQ in all three structures. Interference from the hemes, which are also reduced upon X-ray exposure to the iron(II) state (unpublished data), prevents direct spectroscopic assessment of the TTQ oxidation state in MauG–MADH crystals. Nevertheless, although there are ambiguities in the relative contributions of oxidation states to the final electron-density maps, it is clear that the initial oxidation state of TTQ has an impact on packing during crystal growth.
Table 1. X-ray crystallographic data-collection and refinement statistics.
Values in parentheses are for the highest resolution shell.
| MauG–TTQOX MADH | MauG–TTQOQ MADH | MauG–TTQOQ MADH | |
|---|---|---|---|
| PDB code | 3sws | 3sxt | 4k3i |
| Data collection | |||
| Space group | P1 | P21 | C2 |
| Unit-cell parameters | |||
| a (Å) | 55.22 | 62.64 | 346.36 |
| b (Å) | 99.42 | 135.66 | 55.56 |
| c (Å) | 102.83 | 111.56 | 112.55 |
| α (°) | 64.77 | 90 | 90 |
| β (°) | 74.77 | 97.37 | 112.55 |
| γ (°) | 75.14 | 90 | 90 |
| Diffraction source | APS 23-ID-D | APS 23-ID-B | APS 23-ID-B |
| Wavelength (Å) | 1.03322 | 1.03320 | 1.03320 |
| Detector | MAR Mosaic 300 mm CCD | MAR Mosaic 300 mm CCD | MAR Mosaic 300 mm CCD |
| Resolution range (Å) | 50.00–1.86 (1.89–1.86) | 50.00–1.81 (1.84–1.81) | 50.00–2.00 (2.03–2.00) |
| Completeness (%) | 97.5 (95.8) | 98.3 (80.9) | 99.8 (99.5) |
| Multiplicity | 3.8 (3.7) | 6.5 (2.9) | 4.8 (4.1) |
| 〈I/σ(I)〉 | 13.9 (3.0) | 16.7 (2.3) | 13.6 (2.7) |
| R merge † | 0.097 (0.472) | 0.093 (0.410) | 0.104 (0.551) |
| Refinement | |||
| Resolution range (Å) | 49.12–1.86 (1.91–1.86) | 35.01–1.81 (1.86–1.81) | 43.06–2.00 (2.05–2.00) |
| No. of reflections (working/test set) | 146343/7734 | 155734/8247 | 131712/6968 |
| Final R cryst/R free ‡ | 0.136/0.178 | 0.145/0.187 | 0.146/0.190 |
| No. of non-H atoms | |||
| Protein | 13234 | 13241 | 13249 |
| Ions | 10 | 6 | 6 |
| Other | 225 | 192 | 192 |
| Waters | 2009 | 1824 | 1707 |
| Total | 15478 | 15263 | 15154 |
| R.m.s. deviations | |||
| Bonds (Å) | 0.026 | 0.026 | 0.020 |
| Angles (°) | 2.142 | 2.092 | 2.065 |
| Overall average B factor (Å2) | 21.5 | 29.8 | 29.8 |
| Ramachandran plot analysis§ | |||
| Most favored regions (%) | 95.98 | 96.45 | 95.99 |
| Additionally allowed regions (%) | 3.06 | 2.90 | 3.04 |
| Disallowed regions (%) | 0.96 | 0.65 | 0.97 |
R
merge = 
 , where Ii(hkl) is the observed intensity and 〈I(hkl)〉 is the average intensity of multiple measurements.
R
cryst = 
 , where |F
obs| is the ith observed structure-factor amplitude and |F
calc| is the calculated structure-factor amplitude. R
free is the R factor based on 5% of the data excluded from refinement.
, where |F
obs| is the ith observed structure-factor amplitude and |F
calc| is the calculated structure-factor amplitude. R
free is the R factor based on 5% of the data excluded from refinement.
Based on values obtained from the refinement validation options in Coot.
Figure 2.

Electron density for the TTQ site of MauG–TTQOQ MADH in space groups P21 (a) and C2 (b) and MauG–TTQOX MADH (c). Atoms are shown in stick form colored according to element and 2F o − F c density contoured at 1.0σ is shown as a blue mesh. (d) Comparison of hydrogen-bonding interactions to TTQ in MauG–TTQOQ MADH in space groups P21 (yellow) and C2 (cyan) and MauG–TTQOX MADH (magenta). Water molecules are shown as spheres coloured as for the C atoms. This figure was produced using PyMOL (http://www.pymol.org/).
Despite the differences in crystal form, all three structures are essentially identical to the MauG–preMADH substrate complex, with Cα r.m.s.d. of ≤0.52 Å2 over the entire complex (Fig. 3 ▶). The TTQ cofactor is buried at the interface between MauG and MADH, and so does not directly mediate crystal contacts. However, it could potentially affect the protein interface through changes in dynamics and the relative amounts of conformational states, or by structural changes that are within coordinate error. The observation that the binding affinities of MauG for TTQOQ and TTQOX MADH are very similar and are approximately tenfold weaker than for preMADH supports the transmission of a physical effect to the (pre)MADH surface (Lee et al., 2009 ▶; Shin et al., 2010 ▶). PreMADH has not been crystallized alone, and TTQOX MADH only crystallizes alone when it has undergone limited proteolysis, so it is unknown whether there is a significant structural difference between these forms in the absence of a protein binding partner (Chen et al., 1998 ▶). Interestingly, the packing differences between the MauG–MADH structures are not a consequence of a change in the relative angle between the two proteins within the complex, suggesting that this is stable (Fig. 3 ▶). In fact, the small amount of variability between the structures seems to stem from the MauG portion of the complex rather than the highly stable MADH core, suggesting some propagation of the MADH cofactor state through the interface to MauG which ultimately alters crystal packing.
Figure 3.

(a) Structure of the MauG–preMADH complex (PDB entry 3l4m). MauG is shown in pink, α-MADH in blue and β-MADH in green. The site of TTQ formation is shown as spheres and the MauG hemes are shown as sticks colored by element. (b) Backbone traces of MauG–TTQOQ MADH in space group C2 (cyan), in space group P21 (yellow) and MauG–TTQOX MADH (magenta) overlaid on the MauG–preMADH structure (gray). This figure was produced using PyMOL (http://www.pymol.org/).
It has previously been noted that the MauG–preMADH interface is mediated largely by water (Tarboush et al., 2011 ▶) and that there are relatively few direct interactions between protein residues (Table 2 ▶). This is also true of the TTQOQ and TTQOX structures, in which the positions and interactions of the interface waters are largely conserved. Nearly all of the direct interactions between protein residues are also highly conserved, with the exception of a hydrogen bond between MauG Arg202 and the backbone carbonyl of β-MADH Thr54, which is disrupted in both TTQOQ structures (Fig. 4 ▶) and in one of the monomers of the TTQOX structure. The triclinic packing of MauG–preMADH is already very close to having a crystallographic twofold rotation axis owing to the noncrystallographic twofold symmetry of the complex (Fig. 5 ▶). Thus, although the loss of a single interface hydrogen bond is a relatively small change which does not affect the interface as a whole, it may be sufficient to shift the crystal packing sufficiently to allow the transition to a monoclinic space group. The observation of the Arg–Thr hydrogen bond in one subunit of the MauG–TTQOX MADH structure and the fact that Arg202 is not conserved among MauG homologs argue against its relevance in directly modulating the binding affinity between MauG and different forms of MADH in solution, leaving how this is achieved an open and intriguing question. However, the ability to crystallize MauG–MADH in a higher symmetry space group has practical significance for structurally characterizing high-valent MauG heme intermediates before the onset of significant X-ray reduction. Experiments using these crystals for this purpose are currently under way in our laboratories.
Table 2. Direct interactions between protein residues at the MauG–MADH interface.
Only those interactions that are conserved between the independent copies of MauG and MADH at distances of less than 4 Å and for which there is strong electron density are listed, except where noted in the text. Specific values are for the B chain of MauG. The designation α′ indicates that the residue comes from the other α-subunit.
| Protein–protein interactions | Distance (Å) | |||||
|---|---|---|---|---|---|---|
| MADH residue | MauG residue | Interaction type | MauG–preMADH | MauG–TTQOQ MADH (C2) | MauG–TTQOQ MADH (P21) | MauG–TTQOX MADH |
| αAsp180 | Arg338 | Salt bridge | 3.0 | 3.0 | 3.0 | 3.1 |
| αPro158 | Met333 | Hydrogen bond | 2.9 | 2.8 | 2.9 | 2.9 |
| αSer157 | Gly331 | Hydrogen bond | 2.6 | 2.4 | 2.5 | 2.5 |
| αArg197 | Phe191 | π-Stacking | 3.7 | 3.7 | 3.7 | 3.3 |
| α′Gly29 | Arg208 | Hydrogen bond | 3.1 | 3.0 | 2.7 | 2.9 |
| α′Asp31 | Lys209 | Hydrogen bond | 2.9 | 3.2 | 3.1 | 3.1 |
| α′Asp31 | Gln210 | Hydrogen bond | 3.0 | 3.0 | 3.0 | 3.1 |
| βGlu101 | Arg338 | Salt bridge | 2.7 | 2.8 | 2.8 | 2.6 |
| βGlu101 | Trp199 | Hydrogen bond | 3.4 | 3.5 | 3.2 | 3.1 |
| βIle126 | Gly211 | Hydrogen bond | 2.9 | 2.8 | 2.8 | 2.8 |
| βThr54 | Arg202 | Hydrogen bond | 2.8 | 4.1 | 4.8 | 2.7 |
| βSer56 | Thr198 | Hydrogen bond | 3.0 | 3.7 | 3.9 | 3.3 |
| βThr44 | Gln210 | Hydrogen bond | 3.4 | 3.2 | 3.2 | 3.3 |
Figure 4.
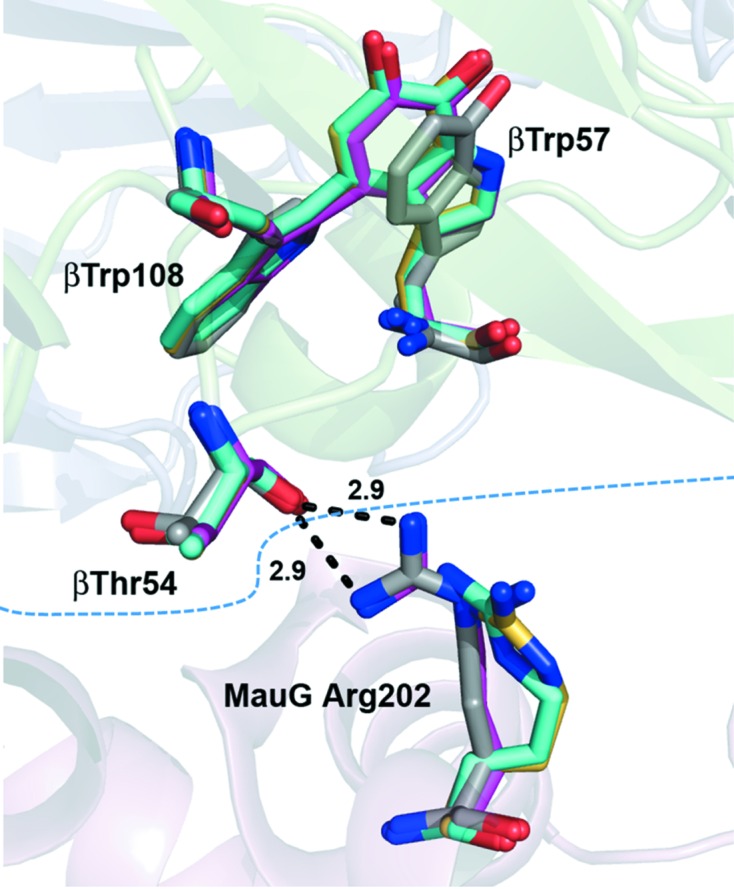
Comparison of an interface interaction in MauG–preMADH (gray), MauG–TTQOX MADH (magenta) and MauG–TTQOQ MADH in space groups P21 (yellow) and C2 (cyan). The protein backbone cartoon is from the MauG–preMADH structure and is colored according to subunit as in Fig. 3 ▶(a). The MauG–preMADH interface is indicated by the blue dotted line and hydrogen-bond interactions are shown as black dotted lines with distances indicated. This figure was produced using PyMOL (http://www.pymol.org/).
Figure 5.

Crystal packing in MauG–preMADH (a) and MauG–TTQOQ MADH in space group C2 (b). This figure was produced using PyMOL (http://www.pymol.org/).
Supplementary Material
PDB reference: MauG–TTQOX MADH, 3sws
PDB reference: MauG–TTQOQ MADH, space group P21, 3sxt
PDB reference: MauG–TTQOQ MADH, space group C2, 4k3i
Acknowledgments
This work was supported by NIH grants GM-66569 (CMW), GM-41574 (VLD) and GM-97779 (ETY) and Minnesota Partnership for Biotechnology and Medical Genomics grant SPAP-05-0013-P-FY06 (CMW). Computer resources were provided by the Basic Sciences Computing Laboratory of the University of Minnesota Supercomputing Institute. X-ray data were collected at the Kahlert Structural Biology Laboratory (KSBL) at The University of Minnesota and GM/CA-CAT at the Advanced Photon Source (APS), Argonne National Laboratory, Argonne, Illinois, USA. GM/CA CAT has been funded in whole or in part with Federal funds from the National Cancer Institute (Y1-CO-1020) and the National Institute of General Medical Science (Y1-GM-1104). Use of the Advanced Photon Source was supported by the US Department of Energy, Basic Energy Sciences, Office of Science under contract No. DE-AC02-06CH11357. We thank Ed Hoeffner for KSBL support and the staff at Sector 23, APS for their support.
References
- Chen, L., Doi, M., Durley, R. C., Chistoserdov, A. Y., Lidstrom, M. E., Davidson, V. L. & Mathews, F. S. (1998). J. Mol. Biol. 276, 131–149. [DOI] [PubMed]
- Davidson, V. L. (1990). Methods Enzymol. 188, 241–246. [DOI] [PubMed]
- Davidson, V. L. (2011). Mol. Biosyst. 7, 29. [DOI] [PubMed]
- Emsley, P. & Cowtan, K. (2004). Acta Cryst. D60, 2126–2132. [DOI] [PubMed]
- Emsley, P., Lohkamp, B., Scott, W. G. & Cowtan, K. (2010). Acta Cryst. D66, 486–501. [DOI] [PMC free article] [PubMed]
- Husain, M., Davidson, V. L., Gray, K. A. & Knaff, D. B. (1987). Biochemistry, 26, 4139–4143. [DOI] [PubMed]
- Jensen, L. M., Sanishvili, R., Davidson, V. L. & Wilmot, C. M. (2010). Science, 327, 1392–1394. [DOI] [PMC free article] [PubMed]
- Lee, S., Shin, S., Li, X. & Davidson, V. L. (2009). Biochemistry, 48, 2442–2447. [DOI] [PMC free article] [PubMed]
- Li, X., Fu, R., Lee, S., Krebs, C., Davidson, V. L. & Liu, A. (2008). Proc. Natl Acad. Sci. USA, 105, 8597–8600. [DOI] [PMC free article] [PubMed]
- Li, X., Jones, L. H., Pearson, A. R., Wilmot, C. M. & Davidson, V. L. (2006). Biochemistry, 45, 13276–13283. [DOI] [PubMed]
- McCoy, A. J., Grosse-Kunstleve, R. W., Adams, P. D., Winn, M. D., Storoni, L. C. & Read, R. J. (2007). J. Appl. Cryst. 40, 658–674. [DOI] [PMC free article] [PubMed]
- McIntire, W. S., Wemmer, D. E., Chistoserdov, A. & Lidstrom, M. E. (1991). Science, 252, 817–824. [DOI] [PubMed]
- Murshudov, G. N., Skubák, P., Lebedev, A. A., Pannu, N. S., Steiner, R. A., Nicholls, R. A., Winn, M. D., Long, F. & Vagin, A. A. (2011). Acta Cryst. D67, 355–367. [DOI] [PMC free article] [PubMed]
- Otwinowski, Z. & Minor, W. (1997). Methods Enzymol. 276, 307–326. [DOI] [PubMed]
- Pearson, A. R., De La Mora-Rey, T., Graichen, M. E., Wang, Y., Jones, L. H., Marimanikkupam, S., Agger, S. A., Grimsrud, P. A., Davidson, V. L. & Wilmot, C. M. (2004). Biochemistry, 43, 5494–5502. [DOI] [PubMed]
- Pearson, A. R., Pahl, R., Kovaleva, E. G., Davidson, V. L. & Wilmot, C. M. (2007). J. Synchrotron Rad. 14, 92–98. [DOI] [PubMed]
- Shin, S., Abu Tarboush, N. & Davidson, V. L. (2010). Biochemistry, 49, 5810–5816. [DOI] [PMC free article] [PubMed]
- Tarboush, N. A., Jensen, L. M., Yukl, E. T., Geng, J., Liu, A., Wilmot, C. M. & Davidson, V. L. (2011). Proc. Natl Acad. Sci. USA, 108, 16956–16961. [DOI] [PMC free article] [PubMed]
- Wang, Y., Graichen, M. E., Liu, A., Pearson, A. R., Wilmot, C. M. & Davidson, V. L. (2003). Biochemistry, 42, 7318–7325. [DOI] [PubMed]
- Wang, Y., Li, X., Jones, L. H., Pearson, A. R., Wilmot, C. M. & Davidson, V. L. (2005). J. Am. Chem. Soc. 127, 8258–8259. [DOI] [PubMed]
- Winn, M. D. et al. (2011). Acta Cryst. D67, 235–242.
- Yukl, E. T., Liu, F., Krzystek, J., Shin, S., Jensen, L. M., Davidson, V. L., Wilmot, C. M. & Liu, A. (2013). Proc. Natl. Acad. Sci. USA 110, 4569–4573. [DOI] [PMC free article] [PubMed]
Associated Data
This section collects any data citations, data availability statements, or supplementary materials included in this article.
Supplementary Materials
PDB reference: MauG–TTQOX MADH, 3sws
PDB reference: MauG–TTQOQ MADH, space group P21, 3sxt
PDB reference: MauG–TTQOQ MADH, space group C2, 4k3i