An automated spreadsheet-based solution for macromolecular crystallization screening is presented that allows easy formulation and optimization of crystal screens via multiple approaches, including incomplete-factorial and grid screening.
Keywords: protein crystallization, crystallization screening, spreadsheet, incomplete factorial, grid screen, software
Abstract
In this paper, a simple low-cost alternative to large commercial systems for preparing macromolecular crystallization conditions is described. Using an intuitive spreadsheet-based approach, the system allows the rapid calculation of relevant pipetting volumes given known stock-solution concentrations and incorporates the automatic design of custom crystallization screens via the incomplete-factorial and grid-screen approaches. Automated dispensing of the resulting crystallization screens is achieved using a generic and relatively inexpensive liquid handler.
1. Introduction
Initial screening of crystallization conditions for proteins and other macromolecules remains a highly empirical process best approached using screens that cover a wide chemical spectrum, such as those available from several commercial sources. The identification of initial crystallization conditions is usually followed by a more limited optimization process in which individual crystallization hits are refined to optimize crystal shape and size (Bergfors, 2009 ▶; Ducruix & Giegé, 1992 ▶). Although less chemically diverse, this optimization process can be time-consuming, as numerous custom crystallization screens need to be prepared to locate the optimal growth conditions. When many chemical ingredients need to be varied independently, the incomplete-factorial (infac) design is a good choice to reduce the total number of experiments while maintaining a broad chemical coverage (Abergel et al., 1991 ▶; Carter & Carter, 1979 ▶).
Spreadsheet software such as Microsoft Excel provides a familiar and easy-to-use interface for the design of crystallization screens, which are tabular by nature in that they usually consist of a number of crystallization conditions (rows) containing one or more ingredients (columns). Several spreadsheet-based crystallization screening applications have been developed over the years, which all allow relatively easy formulation of conditions, as well as in some instances also transfer of the information to a pipetting robot (Andersen & Nyborg, 1996 ▶; Eiselé, 1993 ▶; Hannick et al., 1992 ▶). Today, fully automated liquid-handling and crystallization systems that accomplish this task are available from commercial vendors; however, such solutions are often too large or too costly for academic laboratories.
In this paper, we describe a modern low-cost approach to spreadsheet-based crystallization screening based on more than 20 years of experience in our laboratory. The system uses the same format as the solution presented originally by Andersen & Nyborg (1996 ▶) and later incorporated into a stand-alone Windows program, XAct (Brodersen et al., 1999 ▶). In this paper, we present a new system, which we call Mimer,1 which is first of all compatible with current versions of Microsoft Excel and runs on both Mac and PC. The spreadsheet intuitively parses stock-solution concentrations and names, allowing pipetting volumes to be automatically calculated from the desired final concentrations. In addition, Mimer includes advanced tools for the preparation of grid screens as well as infac designs with up to six independent variables each containing up to 80 conditions. Finally, the spreadsheet is capable of converting the resulting pipetting volumes into a format accepted by the Gilson 735 Sampler Software for automated dispensing using a Gilson 215 liquid handler. This hardware setup has been running in our own laboratory for nearly ten years and has been installed at the Department of Drug Design and Pharmacology at Copenhagen University, Denmark (Professors Ole Kristensen and Michael Gajhede) and at the Centre for Molecular Medicine Norway in Oslo (Dr Jens Preben Morth), showing that it is generally applicable.
2. Materials and instrumentation
The Mimer spreadsheet system can be used both as a standalone application and in conjunction with the Gilson 215 liquid handler and the Gilson 735 Sampler Software. In the standalone scenario, the spreadsheet is useful for calculating pipetting volumes given stock-solution concentrations and desired final concentrations as well as for defining custom screens using the grid-screen and infac design utilities. Combination with the Gilson liquid-handler system, however, makes the system much more versatile, as the custom crystallization screens can then be dispensed automatically.
3. Description and features
The Mimer system consists of a single macro-enabled Microsoft Excel workbook containing all the executable code, implemented using Microsoft Visual Basic, required to calculate volumes, grid and infac screens as well as to convert these volumes into a format acceptable by the Gilson 735 Sampler Software. The spreadsheet is thus a completely self-contained system and consequently no installation is required. This means that the user can edit and store screens on one computer (e.g. in the office) and then simply transfer the resulting file to the laboratory computer operating the Gilson liquid handler for automated pipetting. As a further user-friendly feature, most of the cells in the Microsoft Excel spreadsheet are protected to prevent unintentional input. In addition, basic error checking is carried out and the user alerted in the case of any irregular entries.
3.1. Manual screen editing
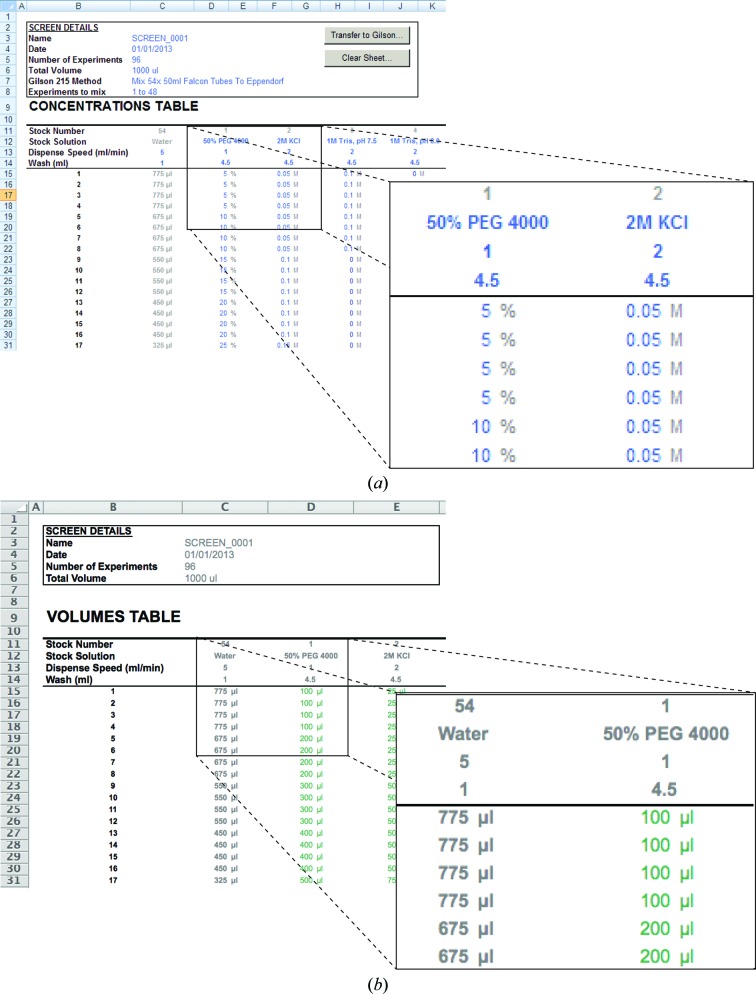
When opened in Microsoft Excel, the Mimer spreadsheet presents itself as a series of tabbed worksheets, each of which represents a functionality of the system: Concentrations, Volumes, Layout, Grid Screen, Incomplete Factorial and Scoring. Some worksheets are passive and provide feedback to the user (Volumes, Layout and Scoring), while others allow user input and contain automation buttons that achieve various tasks (Concentrations, Grid Screen and Incomplete Factorial). The simplest use of Mimer involves manually defining stock solutions as well as entering the desired concentrations of each stock component in each crystallization experiment, which all takes place in the Concentrations worksheet (Fig. 1 ▶ a). To achieve this, the user first enters a name for the custom screen, the total number of experiments (maximum 96) and the total volume per experiment (typically 1000 µl). Next, the individual stock solutions are defined using normal text in the Stock Solution row, for example ‘50% PEG 4000’ or ‘2M KCl’. Buffered solutions can be entered as ‘1M Tris, pH7.5’ (Fig. 1 ▶ a). As long as these definitions follow the format ‘<concentration><unit> <name>’ (with a space between <unit> and <name>), the system will be able to extract the stock concentration and correctly calculate the volumes to be pipetted in each experiment. Below each stock definition, the user can enter the requested pipetting speed in ml min−1 and the volume of water used to wash the needle after pipetting the stock solution, which is only relevant when the system is used in conjunction with the Gilson 215 liquid handler. Once a stock solution has been defined, the entire column below (for as many experiments as have been set) acquires the unit of stock solution and is ready to accept input for the desired target concentrations of that ingredient (Fig. 1 ▶ a). As soon as these are entered, the corresponding pipetting volumes are automatically calculated and can be viewed in the Volumes worksheet (Fig. 1 ▶ b). The remaining volume of water is automatically calculated and updated dynamically. If the total volume required is larger than the maximum volume per experiment, the water volume changes to a red colour to indicate that it is less than zero.
Figure 1.
Manual crystallization-screen setup using Mimer. (a) The Concentrations view of Mimer in Microsoft Excel 2010 on running on Windows XP. This view allows the user to enter stock concentrations and corresponding desired final concentrations for each crystallization condition below. (b) The Volumes view in Microsoft Excel 2011 running on Mac OS X 10.8. This view shows the calculated volumes based on the information in the Concentrations view.
3.2. The Grid Screen utility
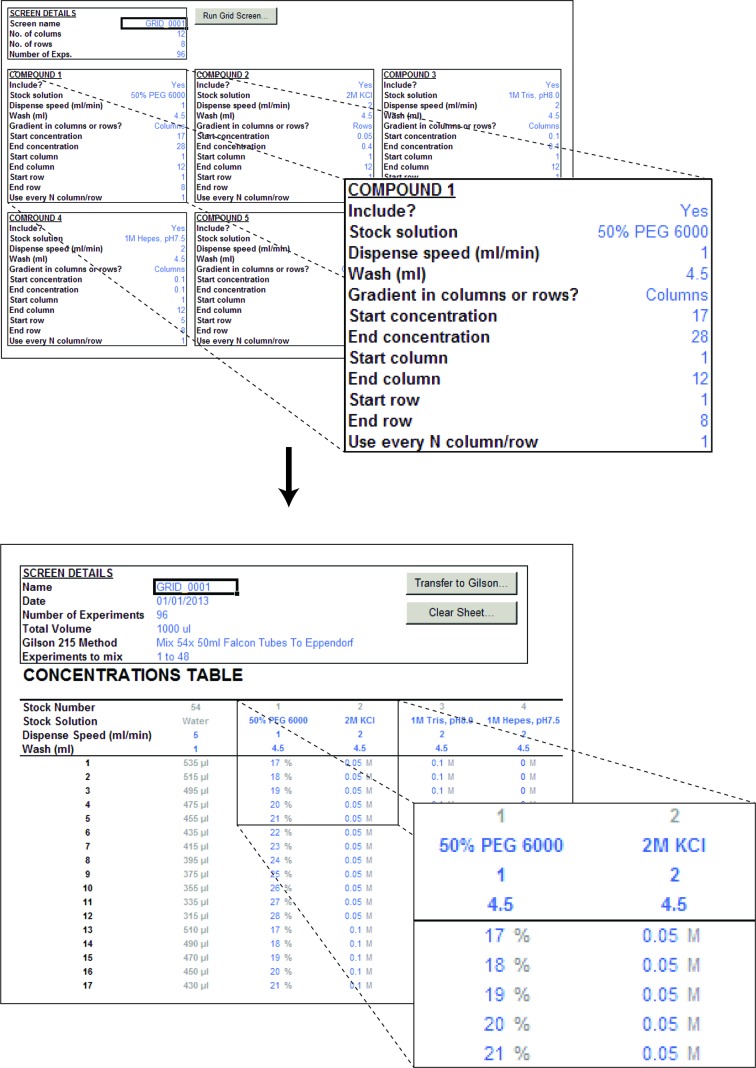
Although any screen can in principle be defined manually, custom screens often contain linear gradients of one or more chemical ingredients such as precipitant or additives, which can be tedious to enter. In such situations, the process can be simplified significantly by beginning with the Grid Screen utility found in the Grid Screen worksheet (Fig. 2 ▶). Here, the user first defines a name for the screen and then defines the number of rows and columns in the crystallization tray to be used (most often 4 × 6 or 8 × 12). Next, up to 12 independent gradients can be defined across or down the tray starting and ending at defined stock concentrations as well as at specified positions within the tray. For example, one might want to set up a traditional 24-well crystallization tray with a gradient of PEG 4000 from 10 to 20%(w/v) across columns 1–6. To achieve this, one enters the appropriate stock-solution definition (e.g. ‘50% PEG 4000’) and sets the gradient to span columns increasing from 10 to 20% through columns 1–6. Additional gradients can be set up independently on top of this, such as, for example, a salt gradient from 0.1 to 0.3 M NaCl through rows 1–4. In this particular case, the system would construct a PEG–ion screen containing 24 unique grid-screen conditions. To accommodate grid screens with more than two dimensions, a stepping feature is included, allowing a certain compound to only occur in every nth row or column. For example, to screen both pH and salt concentration along the columns of the tray, one might define a buffer with pH 7 to be used in columns 1, 4, 7 and 10 (every third column), a buffer with pH 7.5 to be used in columns 2, 5, 8 and 11 and a buffer with pH 8.0 to be used in the remaining columns 3, 6, 9 and 12, and then screen salt concentration in four identical gradients over columns 1–3, 4–6, 7–9 and 10–12. Once the grid screen utility has been run by pressing the ‘Run Grid Screen…’ button, the user can switch back to the Concentrations sheet and continue manually editing to include any additional stocks that cannot be defined as simple gradients and finally view the volumes to be pipetted (Fig. 2 ▶, bottom).
Figure 2.
The automated grid-screen utility. The grid-screen utility allows the user to enter details for one or more concentration gradients (top), including information about the name and concentration of the stock solution as well as the starting and final concentrations, whether the gradient should span columns or rows and whether it is should be included in every row/column or only every nth position. This information is then automatically converted to concentrations (bottom) and subsequently pipetting volumes at the press of a button.
3.3. The Incomplete Factorial utility
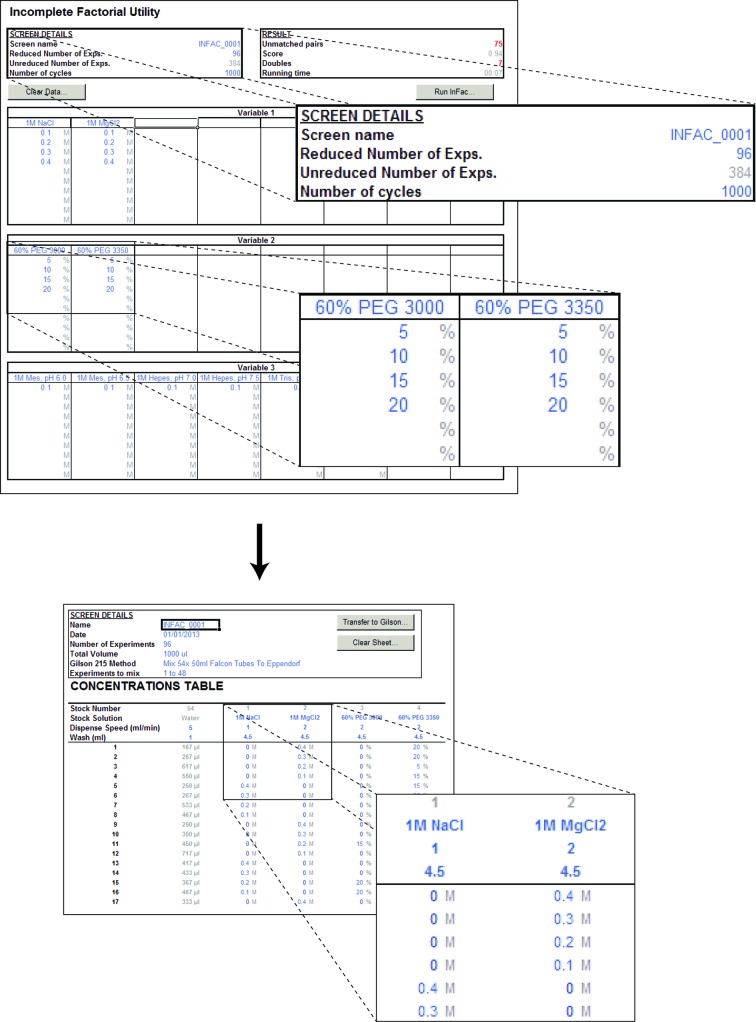
When many chemical conditions need to be screened simultaneously, the number of experiments becomes too large for the grid-screen approach. In such instances, the incomplete-factorial design, which reduces the total number of experiments while spreading the experiments as much as possible in chemical space, provides an extremely useful approach (Carter & Carter, 1979 ▶). Mimer contains a simple implementation of the incomplete-factorial approach that allows the formulation of a specified reduced number of experiments given a full set of chemical conditions to be screened. On the Incomplete Factorial worksheet (Fig. 3 ▶), the user first enters a screen name and the desired reduced number of conditions, which is typically a full tray (24 or 96 conditions). The system allows up to six independent variables, i.e. precipitants, buffers or additives. For each of these, eight different stock solutions can be entered each at up to ten concentrations. This is useful in cases where one wants to vary, for example, the precipitant type and concentration but always keep only one precipitant. For example, variable 1 might be used to specify PEG as precipitant using two different polymer types and stock concentrations (e.g. 50% PEG 4000 and 100% PEG 400) and each at a number of different final concentrations. When the infac screen is calculated, each experiment will contain one, and only one, of the conditions in each variable, i.e. either PEG 4000 or PEG 400 in this case. Variables 2, 3, 4 and so on can then conveniently be used to specify other ingredients such as salts (variable 2), various buffers at different pH values (variable 3) and additives (variables 4 and on). Calculation of the infac screen, which is achieved by pressing the ‘Run Infac…’ button, is relatively intensive and can take several minutes depending on the number of experiments. When completed, the procedure automatically places all of the stock solutions (which may be many more than six) and their concentrations in the Concentrations sheet for further manual editing (Fig. 3 ▶, bottom). Ultimately, the infac screen can, like any other screen, be dispensed automatically using the Gilson 215 liquid handler if available.
Figure 3.
Calculating incomplete-factorial designs. The incomplete-factorial design utility allows the user to reduce the number of experiments while covering a wide chemical space. After entering the required reduced number of experiments, the stock solutions as free variables and the desired final concentrations of each of these (top), individual crystallization conditions are automatically formulated at the press of a button (bottom).
3.4. Preparation of scoring sheets
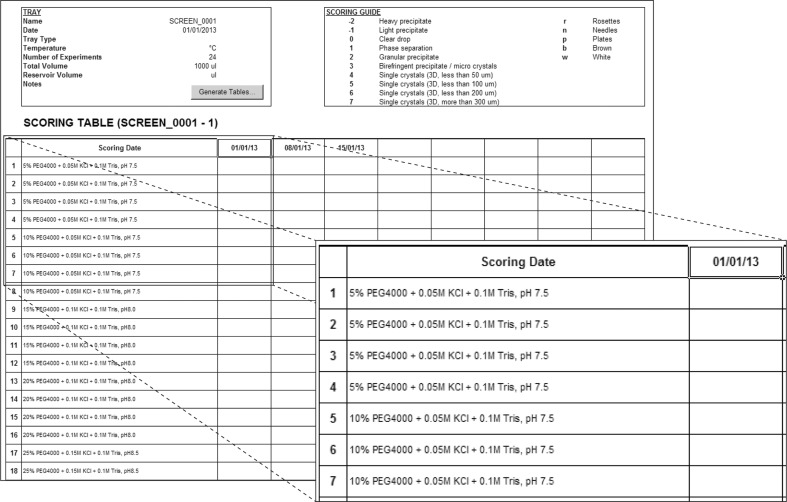
The final worksheet, Scoring, allows the user to produce convenient and easy-to-print scoring sheets that include general screen information (name, date etc.) and some crystal scoring guidelines, as well as a table with details of each condition and room for several rounds of scoring (Fig. 4 ▶). Scoring dates and scores can also be entered into the sheet, which can thus be saved and used as an electronic notebook for that particular crystallization experiment.
Figure 4.
Scoring crystallization hits. Mimer allows the user to create easy-to-print scoring sheets including the name and date of the tray, a crystal-scoring guide, detailed descriptions of each condition and room for multiple rounds of scoring. In addition, this sheet can be used for digital bookkeeping of the results of crystallization experiments.
4. Hardware environment
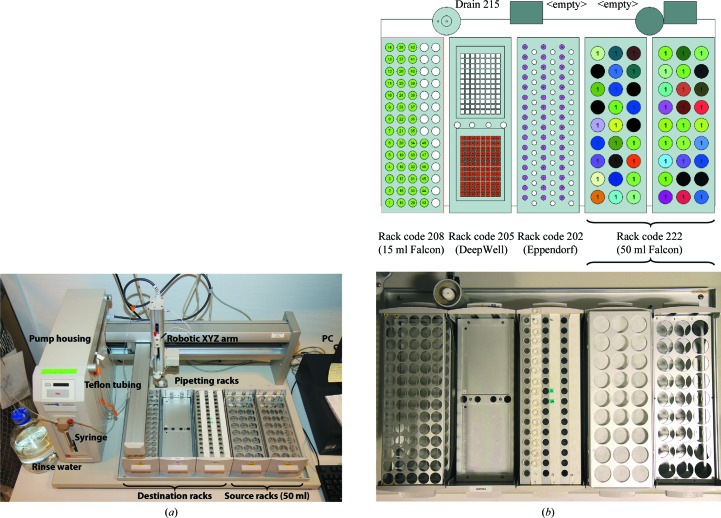
Automatic dispensing of the screens defined using Mimer is currently only possibly using a Gilson 215 liquid-handler system connected via serial interface to a PC running the Gilson 735 Sampler Software (v.6.1) over the GSIOC serial protocol. In addition, a database containing the Gilson 215 layout and a specialized custom task for the Gilson 735 Sampler Software available separately (Biolab A/S, Denmark) is required for handling the transfer of stock solutions from 50 ml Falcon tubes to the crystallization solutions prepared in either 1.5 ml Eppendorf tubes, 15 ml Falcon tubes or 2 ml DeepWell plates. Additional information and pictures detailing the physical configuration of the Gilson 215 liquid handler are shown in Fig. 5 ▶.
Figure 5.
Details of the configuration of the Gilson 215 liquid handler. (a) Physical configuration of the Gilson 215 liquid handler consisting of pump housing with attached syringe and rinse-water bottle (left), Teflon tubing to the dispense needle allowing accurate handling of viscous solutions, robotic XYZ arm, source and destination pipetting racks, and controller PC. (b) Layout of the Gilson 215 tray area. The tray in the Mimer setup consists of three types of destination racks allowing up to 48 × 15 ml Falcon tubes (left; rack code 208), up to two full 96-well DeepWell trays (rack code 205) and up to 48 × 1.5 ml Eppendorf tubes (middle; rack code 202). To the right, up to 54 stock solutions in 50 ml Falcon tubes can be placed in the source racks (rack code 222). The bottom photograph shows the actual setup with empty Eppendorf tubes in the first 16 positions and stock solutions in the source rack covered by a sheet of filter paper to wipe the needle and a custom-made 222-type rack to keep the filter paper in place. In the type 202 Eppendorf rack, two rows of positions have been screened off to accommodate the lids. This setup provides space for a maximum of 48 (3 × 16) Eppendorf tubes in one rack.
Once the screen formulation in Mimer is complete, the appropriate pipetting method must be selected from the drop-down menu in the Concentrations worksheet to instruct the system to transfer the solutions into either 1.5 ml Eppendorf tubes, 15 ml Falcon tubes (for custom multi-use screens) or directly into 2 ml DeepWell 96-well plates. If the number of experiments exceeds 48 and the method is not DeepWell, the user must additionally specify whether experiments 1–48 or 49–96 are to be prepared, using a second drop-down menu, as the Gilson 215 allows a maximum of 48 Eppendorf or 15 ml Falcon tubes at any one time using this layout. Finally, clicking the button ‘Transfer to Gilson…’ transfers the pipetting information to the Windows clipboard, from where it can be pasted directly into a dedicated application inside the Gilson 735 Sampler Software. The expected order of 50 ml Falcon tubes on the tray of the 215 liquid handler is shown in the Layout worksheet in Mimer. It is important to consult this sheet before placing stock solutions, as some stocks may require more than one 50 ml tube when large volumes are dispensed (typically water).
5. Results and discussion
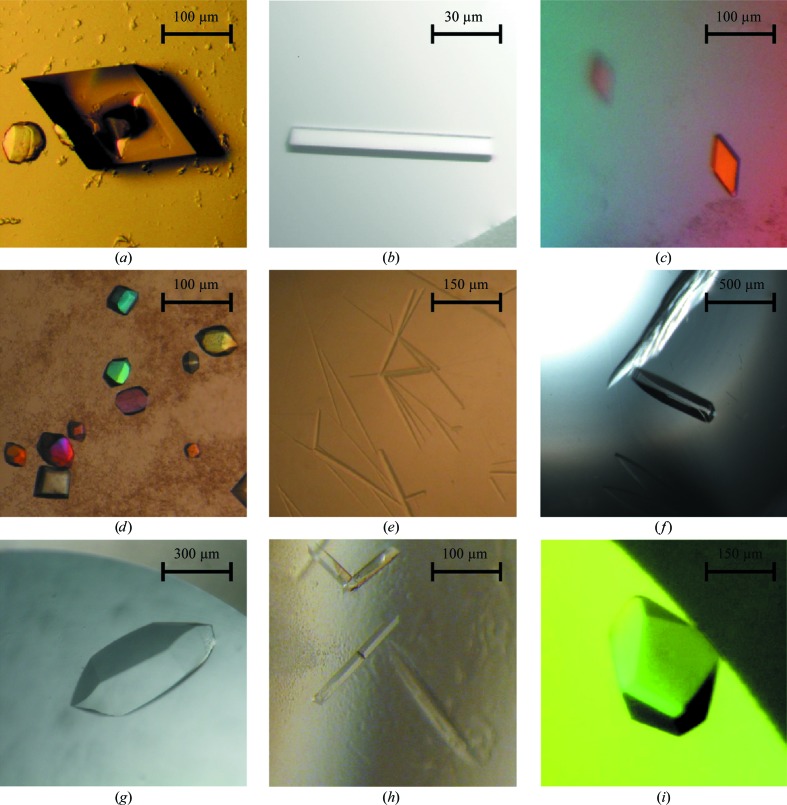
This spreadsheet-based crystallization-screen system has been used for 20 years in our department, and in the current form and coupled to the Gilson 215 liquid handler for the last ten years. Numerous protein crystals have been produced and successfully optimized using the system during this period, a small gallery of which is shown in Fig. 6 ▶. Examples include both soluble and membrane proteins as well as very large protein complexes that have led to very high impact publications. This demonstrates that the system is generally applicable to a wide range of crystallization conditions and targets. The spreadsheet is freely available from the Mimer homepage at http://www.bioxray.au.dk/mimer. The web page also contains additional information including a thorough description of features, screenshots and documentation.
Figure 6.
Crystal gallery. Examples of protein crystals optimized using Mimer and the Gilson 215 liquid handler. Approximate dimensions in micrometres are indicated by scale bars. (a) Arabidopsis thaliana auto-inhibited H+-ATPase 2 (AHA2; Pedersen et al., 2007 ▶). (b) Listeria monocytogenes Lmo0818 P-type ATPase (Hein et al., 2012 ▶). (c) Human complement C4–MASP-2 complex (Kidmose et al., 2012 ▶). (d) Mammalian sarcoplasmic reticulum Ca2+-ATPase (SERCA) in the Ca2+-free E2 state (Winther et al., 2010 ▶). (e) Aquifex aeolicus LeuT E290S mutant (Quick et al., 2009 ▶). (f) Bovine complement component C3 (Fredslund et al., 2006 ▶). (g) Human complement component C5 (Fredslund et al., 2008 ▶). (h) Yeast exosome component Rrp6p (Midtgaard et al., 2006 ▶). (i) The human exon junction complex (Andersen et al., 2006 ▶).
6. Conclusions and outlook
In this paper, we have presented a simple and low-cost alternative to commercial crystallization systems that can be incorporated in most academic laboratories with relatively little effort. The crystallization software allows the user to construct highly customized screens using several approaches, including grid screens and the incomplete-factorial approach. Automatic dispensing of solutions is achieved using a Gilson 215 liquid handler.
In future versions of Mimer, we would like to include additional features that we think will significantly improve the usability of the system and support even further the optimization of crystallization conditions. These include pH-gradient screening using combined buffer systems with buffer ratios automatically calculated via the Henderson–Hasselbalch equation and the use of crystallization scoring results in further rounds of optimization via multiple iterations of the incomplete-factorial approach, as well as chemical ‘error checking’ that would warn the user against impossible chemical combinations, such as combinations of salts that cause precipitation and PEG/salt combinations that lead to phase separation.
Acknowledgments
The authors are immensely grateful to the vast number of students, postdocs and other users of the crystallization facility at the Centre for Structural Biology, Department of Molecular Biology and Genetics, Aarhus University who have contributed important feedback over the years to allow us to continually develop our in-house crystallization setup. We would particularly like to acknowledge Rune Kidmose (Centre for Structural Biology, Aaarhus University, Denmark), Anne-Marie Lund Winther (Pcovery, Copenhagen, Denmark), Kim Hein and Jens Preben Morth (Centre for Molecular Medicine Norway, Oslo, Norway) and Bjørn Panyella Pedersen (UCSF, California, USA) for providing pictures of crystals for this paper.
Footnotes
According to Norse mythology, Mimer was the smartest of all giants (‘jaetter’) and guarded the Well of Mimer. Anyone who drank from the Well could immediately see both the future and the past, and hence the major god, Odin, went to Mimer to gain this insight.
References
- Abergel, C., Moulard, M., Moreau, H., Loret, E., Cambillau, C. & Fontecilla-Camps, J. C. (1991). J. Biol. Chem. 266, 20131–20138. [PubMed]
- Andersen, C. B. F., Ballut, L., Johansen, J. S., Chamieh, H., Nielsen, K. H., Oliveira, C. L. P., Pedersen, J. S., Séraphin, B., Le Hir, H. & Andersen, G. R. (2006). Science, 313, 1968–1972. [DOI] [PubMed]
- Andersen, G. R. & Nyborg, J. (1996). J. Appl. Cryst. 29, 236–240.
- Bergfors, T. (2009). Editor. Protein Crystallization, 2nd ed. La Jolla: International University Line.
- Brodersen, D. E., Jenner, L. B., Andersen, G. R. & Nyborg, J. (1999). J. Appl. Cryst. 32, 1012–1016.
- Carter, C. W. Jr & Carter, C. W. (1979). J. Biol. Chem. 254, 12219–12223. [PubMed]
- Ducruix, A. & Giegé, R. (1992). Editors. Crystallization of Nucleic Acids and Proteins: A Practical Approach, 2nd ed. Oxford University Press.
- Eiselé, J.-L. (1993). J. Appl. Cryst. 26, 92–96.
- Fredslund, F., Jenner, L., Husted, L. B., Nyborg, J., Andersen, G. R. & Sottrup-Jensen, L. (2006). J. Mol. Biol. 361, 115–127. [DOI] [PubMed]
- Fredslund, F., Laursen, N. S., Roversi, P., Jenner, L., Oliveira, C. L. P., Pedersen, J. S., Nunn, M. A., Lea, S. M., Discipio, R., Sottrup-Jensen, L. & Andersen, G. R. (2008). Nature Immunol. 9, 753–760. [DOI] [PubMed]
- Hannick, L., Perozzo, M., Schultz, L. & Ward, K. (1992). J. Cryst. Growth, 122, 303–305.
- Hein, K. L., Nissen, P. & Morth, J. P. (2012). Acta Cryst. F68, 424–427. [DOI] [PMC free article] [PubMed]
- Kidmose, R. T., Laursen, N. S., Dobó, J., Kjaer, T. R., Sirotkina, S., Yatime, L., Sottrup-Jensen, L., Thiel, S., Gál, P. & Andersen, G. R. (2012). Proc. Natl Acad. Sci. USA, 109, 15425–15430. [DOI] [PMC free article] [PubMed]
- Midtgaard, S. F., Assenholt, J., Jonstrup, A. T., Van, L. B., Jensen, T. H. & Brodersen, D. E. (2006). Proc. Natl Acad. Sci. USA, 103, 11898–11903. [DOI] [PMC free article] [PubMed]
- Pedersen, B. P., Buch-Pedersen, M. J., Morth, J. P., Palmgren, M. G. & Nissen, P. (2007). Nature (London), 450, 1111–1114. [DOI] [PubMed]
- Quick, M., Winther, A.-M. L., Shi, L., Nissen, P., Weinstein, H. & Javitch, J. A. (2009). Proc. Natl Acad. Sci. USA, 106, 5563–5568. [DOI] [PMC free article] [PubMed]
- Winther, A.-M. L., Liu, H., Sonntag, Y., Olesen, C., le Maire, M., Soehoel, H., Olsen, C.-E., Christensen, S. B., Nissen, P. & Møller, J. V. (2010). J. Biol. Chem. 285, 28883–28892. [DOI] [PMC free article] [PubMed]


