

Abstract
Background
In the transcatheter aortic valve replacement era, characterization of functional status in older adults with aortic stenosis (AS) is essential. Gait speed (GS) is emerging as a marker of frailty and predictor of outcomes in older adults undergoing cardiovascular intervention. The objective of this study was to delineate the prevalence of slow GS, evaluate the association of GS with factors used in standard cardiovascular assessments, and evaluate the association of GS with dependence in activities of daily living (ADLs) in older adults with AS.
Hypothesis
We hypothesized that gait speed would not be associated with clinical factors, but would be associated with ADLs.
Methods
We evaluated GS, ADLs dependence, and Society of Thoracic Surgery score along with clinical and functional assessments in 102 older adults with AS being evaluated for transcatheter valve. Gait speed <0.5 m/s was considered slow, and GS ≥0.5 m/s was considered preserved. We assessed the association of covariates with GS as well as with ADLs dependence.
Results
Median GS was 0.37 m/s (interquartile range, 0.0–0.65 m/s). Sixty‐four (63%) subjects had slow GS. Of commonly employed clinical covariates, only prior coronary intervention and serum albumin were weakly associated with GS. However, GS was independently associated with ADLs dependence (Odds ratio: 1.52 [1.21‐1.91] for every 0.1 m/s decrease in GS; P = 0.0003).
Conclusions
Although the prevalence of slow GS in a population of elderly patients with severe AS being screened for transcatheter valve was high, there were only weak associations between GS and other risk stratifying tools. The strong association between GS and dependent functional status suggests that assessment of gait speed is a useful, objectively measurable, risk stratification tool in this population.
Dr. Maurer is supported by a grant from the NIH/NIA AG036778‐02. The other authors have no funding, financial relationships, or conflicts of interest to disclose.
Introduction
The phenotype of frailty has emerged in the literature as an important estimate of overall health status that is associated with morbidity and mortality in the general population,1 outcomes in older adults with coronary artery disease,2 and after general3 and cardiac surgery.4., 5. A condition in which frail patient status has been emerging as an important arbiter of clinical decision‐making is severe aortic stenosis (AS) in the elderly. The prevalence of AS is approximately 3% among people over age 75 years6; its prevalence is expected to dramatically increase as the US population ages.7 Until recently, the only option for the treatment of severe AS was surgical aortic valve replacement (SAVR). As a result of the morbidity of SAVR, many older adults with AS do not receive operative intervention. Although transcatheter aortic valve replacement (TAVR) provides a less‐invasive alternative to SAVR for high‐risk patients,8., 9. decisions regarding the appropriateness of either TAVR or SAVR often hinge on a clinical assessment of patient benefits and risks, some of which depend on an assessment of patient frailty. However, frailty is often not objectively measured in the clinical setting; rather, clinicians often rely on clinical judgment and risk scores such as the Society of Thoracic Surgery (STS) Score10 and others11., 12., 13. to determine operative risk and guide treatment decisions.
Of the many predictors of outcomes based on the frailty phenotype, gait speed is emerging as an important predictor of disability, morbidity, and survival in older adults.14., 15., 16., 17., 18. Additionally, among older adults, gait speed predicts mortality and length of stay following cardiac surgery.4 We therefore sought to characterize gait speed in older adults with severe symptomatic AS undergoing evaluation for TAVR to delineate the prevalence of slow gait speed and to evaluate the dependence of gait speed on factors commonly used in standard cardiovascular assessments. In addition, as improvements in independence and function are critically important outcomes in older adults undergoing intervention,19 we sought to evaluate the association of gait speed with dependence in activities of daily living (ADLs) in older adults with advanced AS.
Methods
Participants
A prospective cohort design was used, evaluating 102 high‐risk patients presenting to the inpatient or outpatient Valve Center at Columbia University Medical Center/New York‐Presbyterian Hospital for severe AS being considered for TAVR. Subjects were 60 years of age and older and had severe calcific aortic stenosis based on echocardiographically derived criteria (mean gradient, >40 mm Hg or jet velocity >4.0 m/s, or an initial aortic valve area of <0.8 cm2). All subjects had cardiac symptoms of advanced aortic valve disease. The Columbia University Medical Center institutional review board approved this protocol, and all participants signed informed consent.
Study Measurements
Basic demographics and clinical information were collected for all patients. Using these data, the STS risk score for an isolated aortic valve replacement (AVR) was computed for each subject and reported as predicted mortality at 30 days. Gait speed was assessed according to time in seconds to walk 15 feet (4.57 m). Participants were instructed to “walk at your comfortable pace” until a few steps past the 15‐foot line. The timer was started with the first footfall after the 0‐foot line and was stopped at the first footfall after the 15‐foot line. Their usual assist devices (eg, walkers, canes) were permitted.20 If able, each subject completed one 15‐foot walk. Gait speed was calculated by dividing 4.57 m by time to walk this distance in seconds and reported in meters per second, as has been previously recommended.14 Walking test was not attempted if research personnel or the subject considered it unsafe to attempt a 15‐foot walk due to gait instability resulting in a significant fall risk or if significant cardiac symptoms, hemodynamic instability, severe bradycardia, or tachycardia were present at rest. Only 1 subject did not have gait speed assessed because of severe bradycardia (heart rate less than 50 bpm). If the test was not attempted for these reasons the subject was considered unable to walk 15 feet. Dependence in ADLs was assessed by the Katz ADLs survey.21 The need for assistance with any 1 of the 6 ADLs resulted in the subject being considered dependent, and performing all activities independently was required to be considered independent. To evaluate another performance measure of the frailty phenotype, grip strength was assessed as the average of 3 trials of maximal isometric grip measured in kilograms using a Jamar dynamometer (Sammons Preston, Chicago, IL). Grip strength was considered weak if it was <18 kg for women and <30 kg for men.1
Statistical Analysis
Gait speed was analyzed both as a continuous variable and as a tripartite categorical variable. Subjects were categorized into those unable to walk, those with slow gait speed, and those with preserved gait speed based on a cut point of 0.5 m/s. This cut point is lower than most population‐based and disease‐based cohorts1., 4., 14., 22.; however, it was chosen based on the distribution of gait speed in this cohort (Table 1). Baseline characteristics were compared for subjects unable to walk, subjects with slow gait speed (<0.5 m/s), and subjects with preserved gait speed (≥0.5 m/s). Proportions were compared using χ 2 analysis, and means were compared using analysis of variance. The relationships between gait speed assessed as a continuous variable and clinical, demographic, echocardiographic, and functional parameters were evaluated by univariate and multivariable linear regression.
Table 1.
Association of Gait Speed With Activities of Daily Living Dependence
| Cut Point for Slow Gait Speed, m/s | Unable to Walk 15 Feet | Slow Gait Speed | Preserved Gait Speed | Unable vs Preserved | Slow vs Preserved | c‐Statistic |
|---|---|---|---|---|---|---|
| No. of Subjects Per Group | Odds Ratio (95% CI) | |||||
| 0.8a | 36 | 57 | 9 | — | — | — |
| 0.76 | 36 | 45 | 21 | 40.0 (4.8–334.8) | 5.7 (0.7–47.9) | 0.788 |
| 0.7 | 36 | 45 | 21 | 40.0 (4.8–334.8) | 5.7 (0.7–47.9) | 0.788 |
| 0.6 | 36 | 38 | 28 | 25.9 (5.3–128.3) | 4.0 (0.8–20.4) | 0.791 |
| 0.5 | 36 | 28 | 38 | 35.9 (7.4–175.3) | 8.5 (1.7–43.5) | 0.814 |
| 0.4 | 36 | 16 | 50 | 18.0 (5.7–57.2) | 5.4 (1.4–21.3) | 0.8 |
Abbreviations: CI, confidence interval.
For the odds ratio on the 0.8 cut point, the model did not converge due to poor separation of data.
To confirm these observations, multivariable logistic regression analysis was performed using gait speed as a dichotomous variable (slow gait speed, <0.5 m/s). Analyses were performed on all 102 subjects using a gait velocity of 0 m/s for those unable to walk, and then analyses were repeated excluding the 36 subjects who were unable to walk. Because results did not differ, only the analyses on the 102‐subject cohort are reported. Finally, multiple logistic regression analysis was performed to assess the independent association of gait speed with ADLs status. All analyses were performed using SAS version 9.2 (SAS Institute, Inc., Cary, NC).
Results
Gait speed assessment was performed in 102 older adult patients as part of their evaluation for possible TAVR. Management strategies included medical therapy (n = 5), transcatheter valve replacement (transfemoral [n = 51] or transapical [n = 34]), and traditional surgical aortic valve replacement (n = 12). The mean age was 86 years, and 48% were male. The majority of subjects were admitted from the community (96% from home, 4% from a skilled facility). A total of 38, 28, and 36 subjects had preserved gait speed, slow gait speed, and were unable to walk, respectively. Of those who could not walk, the majority of patients either had documented desaturation with exercise or shortness of breath at rest.
Median gait speed among the subjects able to walk was 0.57 m/s (interquartile range [IQR], 0.41–0.76 m/s) and was 0.37 m/s (IQR, 0.0–0.65 m/s) in all 102 subjects. There were no differences in age, gender, or body mass index in those with preserved gait speed, slow gait speed, and those unable to walk. Overall, the prevalence of comorbid cardiac and noncardiac conditions was similar among groups. There was a higher prevalence of hypertension and prior percutaneous coronary intervention among subjects with preserved gait speed. Peak velocity was not different among the groups, but ventricular function was higher in the group with preserved gait speed. Serum albumin, a marker of wasting and malnutrition, was lower in those unable to walk. Similarly, b‐type natriuretic peptide was similar between groups (1525 ± 1588 vs 1312 ± 1294, in slow vs preserved gait speed groups, respectively; P = 0.41). The mean STS score was similar among all 3 groups. Grip strength, another performance measure often included in the assessment of the frailty phenotype,1 was not different across groups (Table 2).
Table 2.
Demographic, Clinical, and Echocardiographic Characteristics
| All | Gait Speed ≥0.5 m/s | Gait Speed <0.5 m/s | Unable to Walk | P | |
|---|---|---|---|---|---|
| No. | 102 | 38 | 28 | 36 | |
| Age, y | 85.9 (8.1) | 84.8 (9.3) | 88.6 (7.2) | 84.9 (6.9) | 0.12 |
| Male, no. (%) | 49 (48) | 18 (47) | 16 (57) | 15 (42) | 0.47 |
| Body mass index | 24.7 (5.6) | 24.4 (4.9) | 23.0 (3.9) | 26.3 (6.9) | 0.062 |
| Cardiovascular conditions, no. (%) | |||||
| Hypertension | 73 (81) | 31 (97) | 18 (69) | 24 (75) | 0.015 |
| Hyperlipidemia | 66 (73) | 27 (84) | 16 (62) | 23 (72) | 0.14 |
| Diabetes | 20 (22) | 6 (19) | 6 (23) | 8 (25) | 0.83 |
| Coronary artery disease | 67 (74) | 28 (88) | 18 (69) | 21 (66) | 0.1 |
| Prior myocardial infarction | 24 (27) | 9 (28) | 7 (27) | 8 (25) | 0.96 |
| Percutaneous coronary intervention | 29 (32) | 17 (53) | 6 (23) | 6 (18) | 0.0065 |
| Coronary bypass surgery | 35 (39) | 14 (44) | 9 (35) | 12 (38) | 0.76 |
| Atrial fibrillation | 42 (47) | 14 (44) | 17 (65) | 11 (34) | 0.057 |
| Peripheral vascular disease | 24 (27) | 10 (31) | 3 (12) | 11 (34) | 0.11 |
| Noncardiac comorbidities, no. (%) | |||||
| Chronic lung disease | 30 (33) | 9 (28) | 6 (23) | 15 (47) | 0.12 |
| Chronic kidney disease | 37 (42) | 14 (45) | 12 (48) | 11 (34) | 0.53 |
| Glomerular filtration rate, mL/min | 56 (26) | 56 (22) | 49 (19) | 62 (33) | 0.18 |
| Albumin, g/dL | 3.8 (0.5) | 4.0 (0.4) | 3.8 (0.4) | 3.5 (0.4) | <0.0001 |
| Echo data | |||||
| Ejection fraction, % | 50 (16) | 56 (13) | 45 (16) | 49 (18) | 0.039 |
| Reduced ejection fraction (<45%), no. (%) | 28 (32) | 6 (19) | 16 (64) | 13 (41) | 0.0024 |
| Peak velocity, m/s | 4.4 (0.7) | 4.4 (0.6) | 4.2 (0.6) | 4.5 (0.8) | 0.21 |
| Risk score | |||||
| STS score, % | 12.2 (3.9) | 11.6 (4.8) | 12.6 (3.5) | 12.6 (3.4) | 0.55 |
| Geriatric assessments | |||||
| Gait speed, m/s | 0.57 (0.21) | 0.73 (0.13) | 0.36 (0.08) | — | <0.0001 |
| Grip strength, kg | 16.4 (8.7) | 17.2 (9.0) | 18.3 (6.7) | 13.9 (9.4) | 0.1 |
| Weak grip strength, no. (%)a | 85 (83) | 33 (87) | 25 (86) | 28 (78) | 0.53 |
| ADL score <6, no. (%) | 35 (34) | 2 (5) | 9 (32) | 24 (67) | <0.0001 |
Abbreviations: ADL, activities of daily living; STS, Society of Thoracic Surgery.
Grip strength <30 in men and <18 in women.
Variance in Gait Speed
Overall gait speed was only weakly associated with factors commonly used for standard cardiovascular assessments. In univariate regression, gait speed was positively associated with hypertension, coronary artery disease, percutaneous coronary intervention, and serum albumin and negatively associated with the presence of reduced ejection fraction; however, R 2 values were small. A linear regression model that included those factors accounted for only a fraction of the variance in gait speed (adjusted R 2 = 0.19, P = 0.0003); only serum albumin and history of percutaneous coronary intervention were independently associated with gait speed (Table 3). Consistent with the linear regression analysis, history of percutaneous coronary intervention (P = 0.05) and serum albumin (P = 0.05) were associated with slow gait speed in a multivariable logistic regression model dichotomizing gait speed at a cut point of 0.5 m/s. In addition, reduced ejection fraction (P = 0.05) and hypertension (P = 0.04) were also associated with slow walking speed as a dichotomous variable. STS score was not associated with gait speed (Figure 1).
Table 3.
Correlation With Gait Speed
| Univariate Linear Regression | Multivariable Linear Regressiona | P Value | ||||
|---|---|---|---|---|---|---|
| Parameter Estimate | R 2 | P Value | Parameter Estimate | Standardized Parameter Estimate | ||
| No. | 102 | |||||
| Age, y | −0.001 | 0.0008 | 0.78 | — | ||
| Male | 0.017 | 0.0007 | 0.79 | — | ||
| Body mass index | −0.007 | 0.014 | 0.24 | — | ||
| Cardiovascular conditions | ||||||
| Hypertension | 0.19 | 0.06 | 0.018 | 0.11 | 0.14 | 0.18 |
| Hyperlipidemia | 0.075 | 0.011 | 0.32 | — | ||
| Diabetes | −0.08 | 0.011 | 0.31 | — | ||
| Coronary artery disease | 0.16 | 0.049 | 0.036 | 0.02 | 0.03 | 0.80 |
| Prior myocardial infarction | 0.016 | 0.005 | 0.84 | — | ||
| Percutaneous coronary angioplasty | 0.22 | 0.10 | 0.0021 | 0.14 | 0.26 | 0.047 |
| Coronary bypass surgery | 0.024 | 0.0015 | 0.72 | — | ||
| Atrial fibrillation | 0.032 | 0.0026 | 0.63 | — | ||
| Peripheral vascular disease | −0.014 | 0.0004 | 0.86 | — | ||
| Noncardiac comorbidities | ||||||
| Chronic lung disease | −0.094 | 0.019 | 0.19 | — | ||
| Chronic kidney disease | 0.056 | 0.0076 | 0.42 | — | ||
| Glomerular filtration rate, mL/min | −0.001 | 0.0083 | 0.39 | — | ||
| Albumin, g/dL | 0.29 | 0.18 | <0.0001 | 0.18 | 0.27 | 0.014 |
| Echo data | ||||||
| Ejection fraction, % | 0.0034 | 0.029 | 0.11 | — | ||
| Reduced ejection fraction (<45%) | −0.162 | 0.056 | 0.025 | —0.076 | −0.11 | 0.29 |
| Peak velocity, m/s | −0.033 | 0.005 | 0.49 | — | ||
| Risk score | ||||||
| STS score, % | −0.0079 | 0.0098 | 0.35 | — | ||
| Geriatric assessment | ||||||
| Grip strength, kg | 0.0056 | 0.023 | 0.13 | — | ||
| Weak grip strengthb | 0.087 | 0.010 | 0.31 | — | ||
Abbreviations: STS, Society of Thoracic Surgery.
Covariates with significant univariate associations were included in the model. P = 0.0003 for model.
Grip strength <30 in men and <18 in women.
Figure 1.
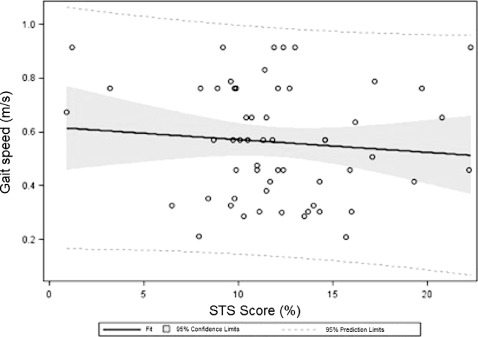
Scatterplot of Society of Thoracic Surgery (STS) score vs gait speed in subjects able to walk 15 ft (n = 66). Linear regression equation: Gait speed = 0.62 ‐ (0.0047*STS score), R 2 = 0.0093, P = 0.48.
Association With Activities of Daily Living
There was a high prevalence of ADLs dependence in this population, with 35 (34%) being dependent in at least 1 ADL. The prevalence of ADLs dependence among those with preserved gait speed, slow gait speed, and those unable to walk was 5%, 32%, and 67%, respectively (P < 0.0001). In a model adjusting for coronary artery disease, percutaneous coronary intervention, reduced ejection fraction, and serum albumin, gait speed was the only independent correlate of ADLs dependence. This association was significant whether gait speed was modeled continuously (odds ratio [OR]: 1.52 [1.21‐1.91] for every 0.1 m/s decrease in gait speed, P = 0.0003) or modeled as a 3‐level discrete (OR slow vs preserved gait speed: 4.09 [0.69‐24.1], OR unable to walk vs preserved gait speed: 18.4 [3.34‐101.0]; P = 0.0014). ADLs status was associated with gait speed regardless of the cut points, ranging from 0.76 to 0.4 m/s (type 3 Wald χ 2 P < 0.0001 for all models). A gait speed cut point of 0.5 m/s was the best predictor of ADLs dependence in this population (c‐statistic = 0.81) (Table 1).
Discussion
The major findings of our analysis were that among older adults with severe symptomatic AS being considered for surgical and percutaneous interventions, (1) a vast majority of the population exhibit slow gait speed, (2) gait speed in this population cannot be explained by commonly employed clinical tools such as STS score or by other measures of frailty such as grip strength, and (3) gait speed is independently associated with disability as measured by ADLs dependence. The high prevalence of slow gait speed in this population coupled with weak association with more commonly employed surgical risk stratifying tools and the strong association with independent functional status suggests that assessment of gait speed may be an important measure in this population.
The landscape of AS in older adults is rapidly evolving. Prior to TAVR, approximately 30% of patients with severe symptomatic AS, despite the high death rate,23 did not undergo surgical aortic valve replacement due to advanced age, left ventricular dysfunction, or the presence of multiple coexisting conditions including frailty.24., 25. For treatment of AS, TAVR is superior to standard therapy in patients who are unable to undergo surgical therapy (mortality at 1 year of 31% vs 50%)8 and comparable to traditional surgical AVR in high‐risk surgical candidates with regard to mortality (1 year 24% in TAVR vs 27% in surgical AVR).9 Given the availability of minimally invasive options for aortic valve replacement, it is important to accurately assess operative risk to select patients for surgical AVR, TAVR, and palliative therapies. The current standard surgical risk assessment integrates the subjective clinical assessment with the STS score, which uses an algorithm that is based on the presence of symptoms, and comorbid cardiovascular and noncardiac conditions to estimate 30‐day operative mortality.10 However, this algorithm was derived from a population of patients in which <5% had a predicted risk score of 10%10 and did not accurately predict 30‐day mortality in a large clinical trial of older adults with severe AS.9 Current operative risk assessment in older adults does not include physical performance measures or formal assessment of frailty, measurements that may be vital to optimizing risk assessments to improve outcomes in older adults.
Medical practitioners have often used the term frailty to characterize the weakest and most vulnerable subset of older adults. Many investigators have hypothesized that frailty is a clinical syndrome based on the presence of some or all of a set of specified symptoms and signs, including various combinations of the following: weakness, fatigue, weight loss, decreased balance, low levels of physical activity, slowed motor processing and performance, social withdrawal, mild cognitive changes, and increased vulnerability to stressors.1., 26., 27., 28. Investigators debate the merits of a more inclusive definition, including cognitive and psychosocial factors, versus a definition that focuses on physical performance measures.27., 28. Individual components of frailty composites are also debated. For instance, the use of weight loss to capture age‐related loss of muscle mass fails to capture the frailty phenotype in obese older adults.28 Gait speed is emerging as the most important single‐item performance measure to estimate frailty. Investigators have shown that in a population of older adults with severe coronary artery disease, the prevalence of frailty using a well‐validated composite1 was 27% and that a gait speed of 0.65 m/s predicted the frailty syndrome (receiver operating characteristic curve c‐statistic = 0.83).2 Several investigators have begun to apply frailty assessment as part of a preoperative assessment and have demonstrated that frail patients are at increased risk for operative morbidity, mortality, and complications in cardiac and noncardiac surgical settings.3., 5., 29., 30., 31. This is the first study to explore the cross‐sectional associations of measured performance‐based markers of frailty (gait speed and grip strength) in a population of older adults being screen for TAVR.
Gait Speed
As a marker of frailty, gait speed could be considered a summary indicator of vitality as walking requires integration of circulatory, respiratory, nervous, and musculoskeletal systems.14 Furthermore, in older adults with functional decline, decreasing mobility may lead to inactivity and overall deconditioning that contributes to poor health and survival.32 Consequently, in older adults, gait speed is associated with adverse outcomes22 and disability,33 and has been shown to be associated with survival in multiple community‐based observational studies32., 33., 34., 35., 36., 37. and in meta‐analysis.14 Preoperative gait speed has been shown to predict mortality and major morbidity in patients undergoing cardiac surgery,4 and gait speed is part of several composite functional assessments that predict operative risk in the general and cardiac surgery setting.1., 4., 31., 38. Investigators, are incorporating measurement of gait speed into the evaluation of older adult candidates for renal39 and lung40 transplantation.
Given the need for improved preoperative risk stratification for older adults with aortic stenosis along with the emergence of gait speed as a marker for the frailty phenotype as well as a robust predictor of morbidity and mortality in older adults, we measured gait speed in a cohort of older adults with aortic stenosis. Overall the gait speed in this population is low (median gait speed among the subjects able to walk was 0.57 m/s; IQR, 0.41–0.76 m/s, and median gait speed in all 102 subjects was 0.37 m/s; IQR, 0.0–0.65 m/s). Using a conservative cut point of 0.5 m/s for slow gait speed, the prevalence of impaired gait speed is high (63%). This cut point is clinically relevant and consistent with epidemiologic data that demonstrate a strong association between a gait speed of <0.5 m/s and a high rate of disability and mortality. Future studies in a larger population with variable degrees of functional impairment will be essential to define the optimal gait speed for risk stratification.
The average gait speed of 0.57 m/s in this population is lower than community‐based cohorts14 and disease‐specific cohorts of patients with chronic obstructive pulmonary disease, heart failure, high cardiovascular disease risk, and renal transplant candidates.39 This likely is a reflection of the older age, high prevalence of comorbid conditions, and frailty of older adults with severe symptomatic AS. Table 4 shows gait speed in several community‐based and disease‐state cohorts.
Table 4.
Gait Speed in Community‐Based and Diseased‐Based Cohorts
| No. | Age, y | Age Group, % | Gait Speed, m/s | ||||
|---|---|---|---|---|---|---|---|
| <65 Years | 65–74 Years | 75–84 Years | ≥85 Years | ||||
| CHSa | 5801 | 72.8 (5.6) | — | 66 | 30 | 4 | 0.86 (0.22) |
| EPESEa | 2128 | 78.9 (5.5) | — | 26 | 57 | 17 | 0.83 (0.13) |
| Health ABCa | 3048 | 73.6 (2.9) | — | 63 | 37 | 0 | 1.12 (0.23) |
| Hispanic EPESEa | 1905 | 74.7 (5.9) | — | 57 | 35 | 8 | 0.56 (0.23) |
| Invencciare in Chiantia | 972 | 74.6 (7.1) | — | 57 | 31 | 12 | 1.00 (0.28) |
| Osteoporotic Fractures in Mena | 5833 | 73.6 (5.8) | — | 58 | 37 | 4 | 1.19 (0.23) |
| NHANES IIIa | 3958 | 75.2 (6.9) | — | 51 | 37 | 11 | 0.68 (0.23) |
| PEPa | 491 | 74.1 (5.7) | — | 57 | 38 | 5 | 0.88 (0.24) |
| Study of Osteoporotic Fracturesa | 10 349 | 71.8 (5.2) | — | 72 | 25 | 2 | 0.95 (0.22) |
| Wake Forest Renal Transplant Candidatesb | 26 | 67.5 (4.9) | — | — | — | — | 0.80 (0.19 |
| PIE (Heart Failure)b | 52 | 69.9 (7.5) | — | — | — | — | 1.17 (0.22) |
| REACT II (COPD)b | 153 | 67.2 (9.8) | — | — | — | — | 0.99 (0.22) |
| TRAIN (High CV Risk)b | 279 | 66.0 (7.5) | — | — | — | — | 1.25 (0.24) |
| Severe AS at Columbia | 102 | 85.9 (8.1) | 4 | 9 | 16 | 71 | 0.57 (0.21) |
Abbreviations: AS, aortic stenosis; CHS, Cardiovascular Health Study; COPD, chronic obstructive pulmonary disease; CV, cardiovascular; EPESE, Established Populations for the Epidemiological Study of the Elderly; Health ABC, Health, Aging, and Body Composition; NHANES III, Third National Health and Nutrition Examination Survey; PEP, Predicting Elderly Performance; PIE, Pharmacological Intervention in the Elderly; REACT II, The Reconditioning Exercise and Chronic Obstructive Pulmonary Disease Trial II; TRAIN, Trial of Angiotensin Converting Enzyme Inhibition and Novel Cardiovascular Risk Factors.
As published in Studenski et al.14
As published in Hartmann et al.39
In older adults with advanced AS, slow gait speed provides independent insight as compared to commonly employed clinical measures regarding overall health status. Gait speed was not associated with many important clinical covariates, including severity of valvular disease, as estimated by peak velocity, noncardiac conditions such as lung and renal disease, and the STS risk assessment tool. The weakly positive association with prior percutaneous coronary angioplasty may reflect the superior functional status among those revascularized, willingness to perform procedures in patients with more reserve, or some other unmeasured confounder. The positive association of gait speed and serum albumin may reflect the malnutrition and/or catabolic state of those with advanced disease and concomitant frailty. However, robust associations with gait speed and clinical covariates are lacking, raising the possibility that gait speed may be of independent prognostic utility. Future studies will evaluate the prognostic value of baseline gait speed in older adults undergoing TAVR and surgical AVR.
Finally, gait speed in this population is independently associated with disability, as reflected by ADLs dependence. This relationship is significant when gait speed was modeled continuously or as a 3‐level discrete variable (unable, slow, and preserved gait speed) regardless of the gait speed cut point used. This is consistent with the well‐established link between impaired gait speed, immobility, disability, and dependence,41., 42. and suggests that even in a highly selected population of older adults with advanced valvular disease with a slow average gait speed, gait speed is an important marker of overall health and functional status. In fact, the measurement of gait speed at baseline and after valvular intervention may yield import prognostic insight.
Low‐Flow, Low‐Gradient Aortic Stenosis
Recently, the phenotype of severe AS associated with low transvalvular gradients in the context of reduced43., 44. and normal45., 46. ejection fraction has received more attention. It is thought that the low gradient is related to low stroke volume (usually a stroke volume index of ≤35 mL/m2)45 across the valvular stenosis. At the time of this study, TAVR clinical trials excluded those subjects with low gradient AS, and therefore subjects with low‐gradient AS are not included in this study. However, a low transvalvular gradient may impact gait speed. One mechanism of exercise intolerance related to critical AS is the inability to increase transvalvular flow to meet increased metabolic demands associated with exercise. Therefore, in those with an already reduced stoke volume and critical AS, exercise capacity and therefore gait speed may be even more impaired. Dedicated studies exploring the impact of low‐flow, low‐gradient aortic stenosis on physical function in older adults will be needed to address this question.
Limitations
There are several limitations to our data. First, this study enrolled a highly selected group of patients who were being considered for TAVR, an experimental therapy for advanced AS in older adults, at a single center with a modest sample size. Therefore, these findings may not be applicable to the general population of older adults with AS, but are relevant to those older adults being considered for TAVR. Second, 36 of 102 subjects were unable to walk 15 feet primarily due to their medical condition. Although it would seem that those unable to walk are at the extreme of gait speed impairment, it is possible that inability to walk 15 feet represents a different phenotype altogether. Larger sample size and further longitudinal study is needed to address this question. Third, the cross‐sectional design of the current investigation precludes any causal inferences. Fourth, ADLs were chosen to measure disability. Dependence in even 1 ADL reflects severe disability. An inclusion of an assessment of instrumental activities of daily living is an important complementary assessment needed to reflect the early disability in older adults. Ongoing studies and those that evaluate the relationship of gait speed to clinical outcomes will address these limitations. Several important questions remain. Does baseline gait speed predict procedural outcomes in older adults undergoing TAVR or surgical AVR? Can older adults with AS and ADLs dependence regain their independence after AVR? Can serial gait speed assessment be used to monitor clinical status before and after AVR? Does gait speed improve after effective intervention for aortic stenosis, and is improvement in gait speed after cardiac intervention associated with better long‐term outcomes?
Conclusion
A high percentage of older adults with severe symptomatic AS exhibit impaired gait speed. Impaired gait speed is independent of traditional cardiovascular assessments and demographic and clinical factors, and is independently associated with ADLs dependence, suggesting gait speed may provide important additional information in this population. Further studies evaluating the association between baseline gait speed and clinical outcomes in older adults undergoing surgical AVR or TAVR are warranted.
References
- 1. Fried LP, Tangen CM, Walston J, et al. Frailty in older adults: evidence for a phenotype. J Gerontol A Biol Sci Med Sci. 2001;56:M146–M156. [DOI] [PubMed] [Google Scholar]
- 2. Purser JL, Kuchibhatla MN, Fillenbaum GG, et al. Identifying frailty in hospitalized older adults with significant coronary artery disease. J Am Geriatr Soc. 2006;54:1674–1681. [DOI] [PubMed] [Google Scholar]
- 3. Makary MA, Segev DL, Pronovost PJ, et al. Frailty as a predictor of surgical outcomes in older patients. J Am Coll Surg. 2010;210:901–908. [DOI] [PubMed] [Google Scholar]
- 4. Afilalo J, Eisenberg MJ, Morin JF, et al. Gait speed as an incremental predictor of mortality and major morbidity in elderly patients undergoing cardiac surgery. J Am Coll Cardiol. 2010;56:1668–1676. [DOI] [PubMed] [Google Scholar]
- 5. Sundermann S, Dademasch A, Praetorius J, et al. Comprehensive assessment of frailty for elderly high‐risk patients undergoing cardiac surgery. Eur J Cardiothorac Surg. 2011;39:33–37. [DOI] [PubMed] [Google Scholar]
- 6. Stewart MDFBF, Siscovick MDMPHD, Lind MSBK, et al. Clinical factors associated with calcific aortic valve disease. J Am Coll Cardiol. 1997;29:630–634. [DOI] [PubMed] [Google Scholar]
- 7. U.S. Census Bureau , 2010. http://factfinder2.census.gov/faces/tableservices/jsf/pages/productview.xhtml?pid=DEC_10_SF1_QTP1&prodType=table. Accessed January 31, 2012.
- 8. Leon MB, Smith CR, Mack M, et al. Transcatheter aortic‐valve implantation for aortic stenosis in patients who cannot undergo surgery. N Engl J Med. 2010;363:1597–1607. [DOI] [PubMed] [Google Scholar]
- 9. Smith CR, Leon MB, Mack MJ, et al; PARTNER Trial Investigators. Transcatheter versus surgical aortic‐valve replacement in high‐risk patients. N Engl J Med. 2011;364:2187–2198. [DOI] [PubMed] [Google Scholar]
- 10. Shroyer AL, Coombs LP, Peterson ED, et al. The Society of Thoracic Surgeons: 30‐day operative mortality and morbidity risk models. Ann Thorac Surg. 2003;75:1856–1864; discussion 1864–1855. [DOI] [PubMed] [Google Scholar]
- 11. Roques F, Nashef SA, Michel P, et al. Risk factors and outcome in European cardiac surgery: analysis of the EuroSCORE multinational database of 19030 patients. Eur J Cardiothorac Surg. 1999;15:816–822; discussion 822–813. [DOI] [PubMed] [Google Scholar]
- 12. Tu JV, Jaglal SB, Naylor CD. Multicenter validation of a risk index for mortality, intensive care unit stay, and overall hospital length of stay after cardiac surgery. Steering Committee of the Provincial Adult Cardiac Care Network of Ontario. Circulation. 1995;91:677–684. [DOI] [PubMed] [Google Scholar]
- 13. Rahmanian PB, Adams DH, Castillo JG, et al. Predicting hospital mortality and analysis of long‐term survival after major noncardiac complications in cardiac surgery patients. Ann Thorac Surg. 2010;90:1221–1229. [DOI] [PubMed] [Google Scholar]
- 14. Studenski S, Perera S, Patel K, et al. Gait Speed and survival in older adults. JAMA. 2011;305:50–58. [DOI] [PMC free article] [PubMed] [Google Scholar]
- 15. Gill TM, Williams CS, Tinetti ME. Assessing risk for the onset of functional dependence among older adults: the role of physical performance. J Am Geriatr Soc. 1995;43:603–609. [DOI] [PubMed] [Google Scholar]
- 16. Guralnik JM, Ferrucci L, Pieper CF, et al. Lower extremity function and subsequent disability: consistency across studies, predictive models, and value of gait speed alone compared with the short physical performance battery. J Gerontol A Biol Sci Med Sci. 2000;55:M221–M231. [DOI] [PubMed] [Google Scholar]
- 17. Studenski S, Perera S, Wallace D, et al. Physical performance measures in the clinical setting. J Am Geriatr Soc. 2003;51:314–322. [DOI] [PubMed] [Google Scholar]
- 18. Vermeulen J, Neyens JC, van Rossum E, et al. Predicting ADL disability in community‐dwelling elderly people using physical frailty indicators: a systematic review. BMC Geriatr. 2011;11:33. [DOI] [PMC free article] [PubMed] [Google Scholar]
- 19. Working Group on Functional Outcome Measures for Clinical Trials. Functional outcomes for clinical trials in frail older persons: time to be moving. J Gerontol A Biol Sci Med Sci. 2008;63:160–164. [DOI] [PMC free article] [PubMed] [Google Scholar]
- 20. Afilalo J. Frailty in patients with cardiovascular disease: why, when, and how to measure. Curr Cardiovasc Risk Rep. 2011;5:467–472. [DOI] [PMC free article] [PubMed] [Google Scholar]
- 21. Shelkey M, Wallace M. Katz index of independence in activities of daily living. J Gerontol Nurs. 1999;25:8–9. [DOI] [PubMed] [Google Scholar]
- 22. Abellan van Kan G, Rolland Y, Andrieu S, et al. Gait speed at usual pace as a predictor of adverse outcomes in community‐dwelling older people an International Academy on Nutrition and Aging (IANA) Task Force. J Nutr Health Aging. 2009;13:881–889. [DOI] [PubMed] [Google Scholar]
- 23. Kelly TA, Rothbart RM, Cooper CM, et al. Comparison of outcome of asymptomatic to symptomatic patients older than 20 years of age with valvular aortic stenosis. Am J Cardiol. 1988;61: 123–130. [DOI] [PubMed] [Google Scholar]
- 24. Iung B, Cachier A, Baron G, et al. Decision‐making in elderly patients with severe aortic stenosis: why are so many denied surgery? Eur Heart J. 2005;26:2714–2720. [DOI] [PubMed] [Google Scholar]
- 25. Bach DS, Siao D, Girard SE, et al. Evaluation of patients with severe symptomatic aortic stenosis who do not undergo aortic valve replacement. Circ Cardiovasc Qual Outcomes. 2009;2:533–539. [DOI] [PubMed] [Google Scholar]
- 26. Buchner DM, Wagner EH. Preventing frail health. Clin Geriatr Med. 1992;8:1–17. [PubMed] [Google Scholar]
- 27. Walston J, Hadley EC, Ferrucci L, et al. Research agenda for frailty in older adults: toward a better understanding of physiology and etiology: summary from the American Geriatrics Society/National Institute on Aging Research Conference on Frailty in Older Adults. J Am Geriatr Soc. 2006;54:991–1001. [DOI] [PubMed] [Google Scholar]
- 28. Rockwood K. Frailty and its definition: a worthy challenge. J Am Geriatr Soc. 2005;53:1069–1070. [DOI] [PubMed] [Google Scholar]
- 29. Dasgupta M, Rolfson DB, Stolee P, et al. Frailty is associated with postoperative complications in older adults with medical problems. Arch Gerontol Geriatr. 2009;48:78–83. [DOI] [PubMed] [Google Scholar]
- 30. Lee DH, Buth KJ, Martin BJ, et al. Frail patients are at increased risk for mortality and prolonged institutional care after cardiac surgery. Circulation. 2010;121:973–978. [DOI] [PubMed] [Google Scholar]
- 31. Ewe SH, Ajmone Marsan N, Pepi M, et al. Impact of left ventricular systolic function on clinical and echocardiographic outcomes following transcatheter aortic valve implantation for severe aortic stenosis. Am Heart J. 2010;160:1113–1120. [DOI] [PubMed] [Google Scholar]
- 32. Cesari M, Kritchevsky SB, Newman AB, et al. Added value of physical performance measures in predicting adverse health‐related events: results from the Health, Aging And Body Composition Study. J Am Geriatr Soc. 2009;57:251–259. [DOI] [PMC free article] [PubMed] [Google Scholar]
- 33. Rosano C, Newman AB, Katz R, et al. Association between lower digit symbol substitution test score and slower gait and greater risk of mortality and of developing incident disability in well‐functioning older adults. J Am Geriatr Soc. 2008;56: 1618–1625. [DOI] [PMC free article] [PubMed] [Google Scholar]
- 34. Cesari M, Kritchevsky SB, Penninx BW, et al. Prognostic value of usual gait speed in well‐functioning older people—results from the Health, Aging and Body Composition Study. J Am Geriatr Soc. 2005;53:1675–1680. [DOI] [PubMed] [Google Scholar]
- 35. Ostir GV, Kuo YF, Berges IM, et al. Measures of lower body function and risk of mortality over 7 years of follow‐up. Am J Epidemiol. 2007;166:599–605. [DOI] [PubMed] [Google Scholar]
- 36. Rolland Y, Lauwers‐Cances V, Cesari M, et al. Physical performance measures as predictors of mortality in a cohort of community‐dwelling older French women. Eur J Epidemiol. 2006;21:113–122. [DOI] [PubMed] [Google Scholar]
- 37. Woo J, Ho SC, Yu AL. Walking speed and stride length predicts 36 months dependency, mortality, and institutionalization in Chinese aged 70 and older. J Am Geriatr Soc. 1999;47:1257–1260. [DOI] [PubMed] [Google Scholar]
- 38. Robinson TN, Eiseman B, Wallace JI, et al. Redefining geriatric preoperative assessment using frailty, disability and co‐morbidity. Ann Surg. 2009;250:449–455. [DOI] [PubMed] [Google Scholar]
- 39. Hartmann EL, Kitzman D, Rocco M, et al. Physical function in older candidates for renal transplantation: an impaired population. Clin J Am Soc Nephrol. 2009;4:588–594. [DOI] [PMC free article] [PubMed] [Google Scholar]
- 40. Lederer DJ, Arcasoy SM, Wilt JS, et al. Six‐minute‐walk distance predicts waiting list survival in idiopathic pulmonary fibrosis. Am J Respir Cri. Care Med. 2006;174:659–664. [DOI] [PMC free article] [PubMed] [Google Scholar]
- 41. Potter JM, Evans AL, Duncan G. Gait speed and activities of daily living function in geriatric patients. Arch Phys Med Rehabil. 1995;76:997–999. [DOI] [PubMed] [Google Scholar]
- 42. Guralnik JM, Ferrucci L, Simonsick EM, et al. Lower‐extremity function in persons over the age of 70 years as a predictor of subsequent disability. N Engl J Med. 1995;332:556–561. [DOI] [PMC free article] [PubMed] [Google Scholar]
- 43. Carabello B, Green L, Grossman W, et al. Hemodynamic determinants of prognosis of aortic valve replacement in critical aortic stenosis and advanced congestive heart failure. Circulation. 1980;62:42–48. [DOI] [PubMed] [Google Scholar]
- 44. Tribouilloy C, Levy F. Assessment and management of low‐gradient, low ejection fraction aortic stenosis. Heart. 2008;94: 1526–1527. [DOI] [PubMed] [Google Scholar]
- 45. Hachicha Z, Dumesnil JG, Bogaty P, et al. Paradoxical low‐flow, low‐gradient severe aortic stenosis despite preserved ejection fraction is associated with higher afterload and reduced survival. Circulation. 2007;115:2856–2864. [DOI] [PubMed] [Google Scholar]
- 46. Cramariuc D, Cioffi G, Rieck AE, et al. Low‐flow aortic stenosis in asymptomatic patients: valvular‐arterial impedance and systolic function from the SEAS substudy. J Am Coll Cardiol Img. 2009;2:390–399. [DOI] [PubMed] [Google Scholar]