

Abstract
Much is known on how facial expressions of emotion are produced, including which individual muscles are most active in each expression. Yet, little is known on how this information is interpreted by the human visual system. This paper presents a systematic study of the image dimensionality of facial expressions of emotion. In particular, we investigate how recognition degrades when the resolution of the image (i.e., number of pixels when seen as a 5.3 by 8 degree stimulus) is reduced. We show that recognition is only impaired in practice when the image resolution goes below 20 × 30 pixels. A study of the confusion tables demonstrates that each expression of emotion is consistently confused by a small set of alternatives and that the confusion is not symmetric, i.e., misclassifying emotion a as b does not imply we will mistake b for a. This asymmetric pattern is consistent over the different image resolutions and cannot be explained by the similarity of muscle activation. Furthermore, although women are generally better at recognizing expressions of emotion at all resolutions, the asymmetry patterns are the same. We discuss the implications of these results for current models of face perception.
Keywords: resolution, facial expressions, emotion
Introdution
Emotions are fundamental in studies of cognitive science (Damassio, 1995), neuroscience (LeDoux, 2000), social psychology (Adolphs, 2003), sociology (Massey, 2002), economics (Connolly & Zeelenberg, 2002), human evolution (Schmidt & Cohn, 2001), and engineering and computer science (Pentland, 2000). Emotional states and emotional analysis are known to influence or mediate behavior and cognitive processing. Many of these emotional processes may be hidden to an outside observer, whereas others are visible through facial expressions of emotion.
Facial expressions of emotion are a consequence of the movement of the muscles underneath the skin of our face (Duchenne, 1862/1990). The movement of these muscles causes the skin of the face to deform in ways that an external observer can use to interpret the emotion of that person. Each muscle employed to create these facial constructs is referred to as an Action Unit (AU). Ekman and Friesen (1978) identified those AUs responsible for generating the emotions most commonly seen in the majority of cultures—anger, sadness, fear, surprise, happiness, and disgust. For example, happiness generally involves an upper–backward movement of the mouth corners; while the mouth is upturned (to produce the smile), the cheeks lift and the upper corner of the eyes wrinkle. This is known as the Duchenne (1862/1990) smile. It requires the activation of two facial muscles: the zygomatic major (AU 12) to raise the corners of the mouth and the orbicularis oculi (AU 42) to uplift the cheeks and form the eye corner wrinkles. The muscles and mechanisms used to produce the abovementioned facial expressions of emotion are now quite well understood and it has been shown that the AUs used in each expression are relatively consistent from person to person and among distinct cultures (Burrows & Cohn, 2009).
Yet, as much as we understand the generative process of facial expressions of emotion, much still needs to be learned about their interpretation by our cognitive system. Thus, an important open problem is to define the computational (cognitive) space of facial expressions of emotion of the human visual system. In the present paper, we study the limits of this visual processing of facial expressions of emotion and what it tells us about how emotions are represented and recognized by our visual system. Note that the term “computational space” is used here to specify the combination of features (dimensions) used by the cognitive system to determine (i.e., analyze and classify) the appropriate label for each facial expression of emotion.
To properly address the problem stated in the preceding paragraph, it is worth recalling that some facial expressions of emotion may have evolved to enhance or reduce our sensory inputs (Susskind et al., 2008). For example, fear is associated with a facial expression with open mouth, nostrils, and eyes and an inhalation of air, as if to enhance the perception of our environment, while the expression of disgust closes these channels (Chapman, Kim, Susskind, & Anderson, 2009). Other emotions, though, may have evolved for communication purposes (Schmidt & Cohn, 2001). Under this assumption, the evolution of this capacity to express emotions had to be accompanied by the ability to interpret them visually. These two processes (production and recognition) would have had to coevolve. That is, if the intention of some facial expressions of emotion were to convey this information to observers, they would have had to coevolve with the visual processes in order to maximize transmission through a noisy medium. By coevolve, we mean that they both changed over time—one influencing the other.
The above arguments raise an important question. What is the resolution at which humans can successfully recognize facial expressions of emotion? Some evidence suggests that we are relatively good at recognition from various resolutions (Harmon & Julesz, 1973) and that different stimuli are better interpreted from various distances (Gold, Bennett, & Sekuler, 1999; Parish & Sperling, 1991), but little is known on how far we can go before our facial expressions can no longer be read. This question is fundamental to understand how humans process facial expressions of emotion. First, the resolution of the stimuli can tell us which features are lost when recognition is impaired. Second, the confusion table (which specifies how labels are confused with one another) of different resolutions will determine if the confusion patterns change with resolution and what this tells us about the cognitive space of facial expressions. Third, this information will help us determine if facial expressions of emotions did indeed coevolve to communicate certain emotions and from what range of resolutions.
Smith and Schyns (2009) provide a detailed study on the role of low frequencies for the recognition of distal expressions of emotion. Using a computational model and psychophysics, they show that happiness and surprise use several low-frequency bands and are, thus, the two expressions that are best recognized from a distance. They argue that these two expressions could have had an evolutionary advantage when recognized from a distance, while other emotions were mostly employed for proximal interactions. However, Laprevote, Oliva, Delerue, Thomas, and Boucart (2010) have recently reported results suggesting that both high and low frequencies are important for recognition of joy and anger, with a slight preference for the high frequencies. Thus, the questions listed above remain unanswered.
In the present study, we do not manipulate the frequency spectrum of the image directly. Rather, we start with a stimuli of 240 × 160 pixels and create four additional sets of images at different resolutions—each 1/2 the resolution of its preceding set. This simulates what happens when a person (i.e., sender) moves away from the observer. It also allows us to determine which is the minimum resolution needed for recognition and how identification and confusions change with the number of pixels. The images of the six emotions described above plus neutral are then resized back to the original resolution for visualization (Figure 1). The neutral expression is defined as having all facial muscles at rest (except for the eyelids, which can be open) and, hence, with the intention of not expressing any emotion. All images are shown as stimulus of 5.3 by 8 degrees of visual angle and avoid possible changes due to image size (Majaj, Pelli, Kurshan, & Palomares, 2002).
Figure 1.
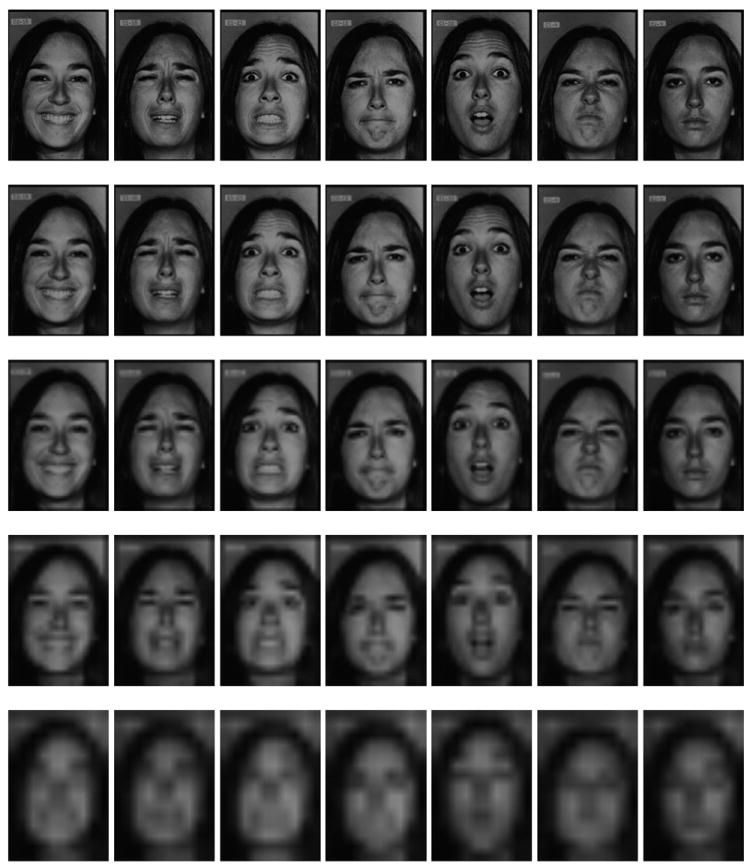
Facial expressions, from left to right: happiness, sadness, fear, anger, surprise, disgust, and neutral. Resolutions from top to bottom: 1 (240 × 160 pixels), (120 × 80 pixels), (60 × 40 pixels), (30 × 20 pixels), and (15 × 10 pixels).
A seven-alternative forced-choice (7AFC) task shows that every expression is recognized within a wide range of image resolutions (Figure 2). The main difference is that some expressions are recognized more poorly at all resolutions, while others are consistently easier (Figure 3). For example, fear and disgust are poorly recognized at every resolution, while happiness and surprise (as well as neutral) are easily identified in that same resolution range. Recognition remains quite consistent until the image is reduced to 15 × 10 pixels, where almost no useful information is left for analysis. Sadness and anger are not as easily classified as happiness and surprise but are more successfully identified than fear and disgust.
Figure 2.

Stimulus timeline. A white fixation cross in black background is shown for 500 ms. Then, a stimulus image is shown for 500 ms, followed by a random noise mask for 750 ms. A 7AFC task is used. After the subject’s response, the screen goes blank for 500 ms and the process is repeated.
Figure 3.

Recognition rates of the seven facial expressions as a function of image resolution. The horizontal axis defines the resolution and the vertical axis defines the recognition rate. For each emotion, solid lines connect the two points that are not statistically different and dashed lines connect points that are statistically different. The horizontal dash-dotted line indicates chance level, at ~14%.
Our results suggest that the computational space used to classify each emotion is robust to a wide range of image resolutions. That is, the cognitive space is defined to achieve a constant recognition for a variety of image resolutions (distances). We also show that women are significantly better at recognizing every expression at all resolutions and that their confusion of one emotion for another is less marked than those seen in men.
Importantly, the confusion tables, illustrating which emotions are mistaken for others, are shown to be asymmetric. For example, fear is typically confused for surprise but not vice versa. We show that this asymmetry cannot be explained if subjects were analyzing AUs, suggesting that the dimensions of the computational space are formed by features other than AUs or AU coding. We conclude with a discussion of how the reported results challenge existing computational models of face perception.
Experiment
We hypothesize that facial expressions of emotion are correctly recognized at a variety of image resolutions. To test this hypothesis, we develop a set of images of the six emotions listed above plus neutral at various resolutions.
Methods
Subjects
Thirty-four human subjects with normal or corrected-to-normal vision were drawn from the population of students and staff at The Ohio State University (mean age = 23, standard deviation = 3.84). They were seated in front of a personal computer with a 21″ CRT monitor. The distance between the eye and the monitor screen was approximately 50 cm. Distance was controlled and subjects were instructed not to move forward or backward during the experiment. The standard deviation from the mean distance (50 cm) was below 2 cm.
Stimuli
One hundred and five grayscale face images were used, consisting of six facial expressions of emotion (happiness, surprise, anger, sadness, fear, and disgust) plus neutral from a total of 15 people. These images were selected from two facial expression databases: the Pictures of Facial Affect (PoFA) of Ekman and Friesen (1976) and the Cohn–Kanade database (CK; Kanade, Cohn, & Tian, 2000). The former provided 70 images and the latter provided 35 images. Images were normalized to the same overall intensity and contrast.
All images were cropped around the face and down-sized to 240 × 160 pixels. The images at this resolution are referred to as resolution 1. Subsequent sets were constructed by downsizing the previous set by 1/2. This procedure yielded the following additional sets: 120 by 80 (called resolution ), 60 by 40 (resolution ), 30 by 20 (resolution ), and 15 by 10 pixels (resolution ). All images were downsized using linear averaging over neighboring of 2 by 2 pixels.
To provide a common visual angles of 5.3° horizontally and 8° vertically, all five sizes were scaled back to 240 × 160 pixels using bilinear interpolation, which preserves most of the spatial frequency components (Figure 1). Images from the same column in Figure 1 were not presented in the same trial to prevent subjects from judging one image based on having previously seen the same image at a larger resolution. Thus, each experiment was composed of 105 images consisting of 7 facial expressions of 15 identities. The 5 resolutions were evenly distributed. The resolution–identity correspondence was randomly generated for each trial.
Design and procedure
The experiment began with a short introductory session where subjects were shown face images of the seven facial expressions and were told the emotion of each image. A short practice session followed, consisting of 14 trials. The images of the subjects used in this practice session were not used in the actual test.
The test session followed. A white fixation cross in black background was shown for 500 ms prior to the stimulus whose display duration was also 500 ms, followed by a random noise mask shown for 750 ms. A 7AFC task was used, where subjects had to select one of the six emotion labels or neutral. After the subject’s response, the screen went black for 500 ms before starting the process again. Figure 2 illustrates a typical stimulus timeline. The entire experiment lasted about 10 min with no breaks. The trials with reaction times larger than two standard deviations from the average were discarded. This left approximately 95 to 100 trials per condition for analysis.
Results
Table 1 shows the confusion matrices, with columns defining the true emotion shown and rows defining subjects’ responses. Entries with an asterisk indicate that the results are statistically significant (p ≤ 0.05) from noise. The relationship between image resolution and perception was examined to address how recognition and error rates changed with image detail reduction.
Table 1.
Confusion matrices. The leftmost column is the response (perception) and the first row of each matrix specifies the emotion class of the stimulus. The diagonal elements are the recognition rates and the off-diagonal entries correspond to the error rates. Resolutions from top to bottom: 1, , , , and . The chance level is 14%. An asterisk highlights the entries that are statistically different from noise. A grayscale color palette of 10 scales was used to color code the percentages from 0 (light) to 1 (dark).
|
| |||||||
|---|---|---|---|---|---|---|---|
| Resolution 1 | Happiness | Sadness | Fear | Anger | Surprise | Disgust | Neutral |
| Happiness | .99* | .02 | .03 | .01 | .01 | .01 | .02 |
| Sadness | .00 | .71* | .00 | .12* | .00 | .01 | .03 |
| Fear | .00 | .05 | .49* | .02 | .04 | .00 | .00 |
| Anger | .00 | .02 | .03 | .63* | .01 | .42* | .05 |
| Surprise | .01 | .01 | .29* | .04 | .93* | .02 | .00 |
| Disgust | .00 | .12* | .15* | .12* | .01 | .53* | .02 |
| Neutral | .00 | .06 | .00 | .05 | .00 | .01 | .88* |
| Resolution | Happiness | Sadness | Fear | Anger | Surprise | Disgust | Neutral |
| Happiness | .99* | .00 | .02 | .00 | .01 | .00 | .01 |
| Sadness | .00 | .79* | .03 | .06 | .00 | .08 | .05 |
| Fear | .00 | .06 | .56* | .02 | .08 | .01 | .00 |
| Anger | .01 | .00 | .07 | .75* | .01 | 0.41* | .05 |
| Surprise | .00 | .00 | .20* | .04 | .89* | .00 | .00 |
| Disgust | .00 | .06 | .11* | .09 | .01 | .48* | .03 |
| Neutral | .00 | .08 | .00 | .03 | .00 | .01 | .86* |
| Resolution | Happiness | Sadness | Fear | Anger | Surprise | Disgust | Neutral |
| Happiness | .99* | .00 | .04 | .00 | .00 | .00 | .01 |
| Sadness | .00 | .70* | .04 | .10* | .00 | .03 | .04 |
| Fear | .00 | .03 | .50* | .04 | .03 | .00 | .02 |
| Anger | .01 | .03 | .05 | .58* | .01 | .52* | .03 |
| Surprise | .00 | .01 | .23* | .02 | .95* | .00 | .00 |
| Disgust | .00 | .08 | .12* | .20* | .01 | .44* | .02 |
| Neutral | .00 | .15* | .01 | .06 | .00 | .01 | .88* |
| Resolution | Happiness | Sadness | Fear | Anger | Surprise | Disgust | Neutral |
| Happiness | .98* | .03 | .15* | .05 | .03 | .01 | .05 |
| Sadness | .01 | .39* | .15* | .12* | .01 | .05 | .05 |
| Fear | .00 | .06 | .44* | .00 | .04 | .01 | .06 |
| Anger | .01 | .08 | .03 | .49 | .02 | .40* | .05 |
| Surprise | .00 | .00 | .11 | .04 | .88* | .00 | .02 |
| Disgust | .00 | .03 | .09 | .19* | .01 | .26* | .04 |
| Neutral | .00 | .40* | .03 | .10* | .01 | .27* | .72* |
| Resolution | Happiness | Sadness | Fear | Anger | Surprise | Disgust | Neutral |
| Happiness | .70* | .12 | .21* | .08 | .07 | .13* | .09 |
| Sadness | .04 | .11 | .14 | .16* | .04 | .08 | .09 |
| Fear | .04 | .07 | .12 | .04 | .12* | .01 | .10 |
| Anger | .07 | .10 | .04 | .16* | .03 | .09 | .11 |
| Surprise | .06 | .10 | .06 | .01 | .55* | .00 | .04 |
| Disgust | .00 | .06 | .06 | .14* | .01 | .11* | .03 |
| Neutral | .08 | .42* | .37* | .41* | .18* | .58* | .53* |
Recognition rates
It is observed from the confusion matrices that some resolution reductions affect recognition rates while others do not. To further study this, the test of equality of proportions was applied to the average recognition rates of each facial expression. Figure 3 shows the recognition rates and the statistical test results. The continuous lines indicate that there was no statistical difference between the results of the two resolutions connected by the lines, while the dashed lines indicate the opposite.
There were no significant recognition loss at resolutions 1 to for all emotions but anger. Sadness, disgust, and neutral showed a decrease at resolution . Without exceptions, significant degradation of perception occurred at . In addition, perception of sadness, fear, anger, and disgust dropped to chance level. One concern was whether the decrease of perception was linear with respect to size reduction. This was tested using the log-linear model of Poisson regression r = β × resolution + γ, where r is the recognition rate, β is the coefficient, and γ is the intercept. The values used for resolution are 1, , , , and because the ratios among these numbers are equal to the ratios among the actual numbers of pixels in the five resolutions. Thus, this model evaluates the linearity of recognition rates given the quantity of pixels. The null hypothesis β = 0 was rejected, p ≥ 0.73. Therefore, recognition rates did not decrease linearly with image resolution.
Next, we tested a logarithmical fit, given by r = α × log (resolution) + γ, where r is the recognition rate, α is the coefficient, and γ is the intercept. In this case, the null hypothesis α = 0 is not rejected for happiness (p = 0.16), fear (p = 0.12), anger (p = 0.07), and surprise (p = 0.15). The null hypothesis is, however, rejected for sadness (p = 0.04) and disgust (p = 0.01). These results show that the recognition of emotions is not seriously impaired until after size 1/8 for four out of the six emotions studied (happy, fear, anger, surprise).
Error rates: Confusions
The error rates are a measure of perceptual confusion between facial expressions. It is clear from these results that at resolution 1/16, recognition is no longer possible. For this reason, in this section, we study the confusion patterns seen in resolutions 1 to 1/8.
The clearest misclassification is that of disgust for anger. At resolution 1, images of disgust are classified as angry 42% of the time by human subjects. This pattern remains clear at the other resolutions. In fact, at resolutions 1/4 and 1/8, disgust is classified as anger more often that it is to disgust. Most interestingly, anger is rarely confused for disgust. This asymmetry in the confusion table is not atypical. To enumerate another example, fear is consistently confused for disgust and surprise but not vice versa.
Not surprisingly, happy and surprise are the only two expressions that are never (consistently) confused for other expressions, regardless of the resolution. These two expressions are commonly used in communication and is, thus, not surprising that they can be readily recognized at different resolutions.
Sadness and anger are well recognized at close proximity, but they get confused by other expressions as the distance between the sender and the receiver increases. Sadness is most often confused for neutral (i.e., the absence of emotion), while anger is confused for sadness, disgust, and, to a lesser degree, neutral.
It may be possible to learn to distinguish some expressions better over time, or it could be that evolution equipped one of the genders with better recognition capabilities as suggested by some authors (Gitter, Black, & Mostofsky, 1972; Rotter & Rotter, 1988). To test this hypothesis, we plotted the confusion patterns for men and women in two separate tables (Tables 2 and 3).
Table 2.
Confusion matrices of 14 female subjects. Same notation as in Table 1.
|
| |||||||
|---|---|---|---|---|---|---|---|
| Size 1 | Happiness | Sadness | Fear | Anger | Surprise | Disgust | Neutral |
| Happiness | 1.00* | .03 | .05 | .03 | .00 | .00 | .05 |
| Sadness | .00 | .78* | .00 | .10 | .00 | .00 | .00 |
| Fear | .00 | .08 | .55* | .03 | .02 | .00 | .00 |
| Anger | .00 | .00 | .03 | .70* | .02 | .37* | .02 |
| Surprise | .00 | .00 | .23* | .03 | .95* | .05 | .00 |
| Disgust | .00 | .08 | .15 | .05 | .00 | .59* | .02 |
| Neutral | .00 | .05 | .00 | .08 | .00 | .00 | .90* |
| Size | Happiness | Sadness | Fear | Anger | Surprise | Disgust | Neutral |
| Happiness | .97* | .00 | .02 | .00 | .00 | .00 | .00 |
| Sadness | .00 | .78* | .02 | .08 | .00 | .03 | .03 |
| Fear | .00 | .13 | .68* | .03 | .05 | .03 | .00 |
| Anger | .03 | .00 | .00 | .79* | .00 | 0.43* | .10 |
| Surprise | .00 | .00 | .17 | .10 | .93* | .00 | .00 |
| Disgust | .00 | .03 | .10 | .05 | .03 | .53* | .05 |
| Neutral | .00 | .08 | .00 | .03 | .00 | .00 | .82* |
| Size | Happiness | Sadness | Fear | Anger | Surprise | Disgust | Neutral |
| Happiness | 1.00* | .00 | .10 | .00 | .00 | .00 | .03 |
| Sadness | .00 | .70* | .03 | .03 | .00 | .03 | .00 |
| Fear | .00 | .03 | .54* | .00 | .02 | .00 | .03 |
| Anger | .00 | .05 | .02 | .59* | .00 | .40* | .05 |
| Surprise | .00 | .00 | .17 | .05 | .95* | .00 | .00 |
| Disgust | .00 | .05 | .12 | .22* | .02 | .55* | .05 |
| Neutral | .00 | .16 | .02 | .12 | .00 | .03 | .85* |
| Size | Happiness | Sadness | Fear | Anger | Surprise | Disgust | Neutral |
| Happiness | 1.00* | .05 | .08 | .03 | .03 | .03 | .05 |
| Sadness | .00 | .30* | .10 | .10 | .00 | .03 | .05 |
| Fear | .00 | .05 | .58* | .00 | .05 | .03 | .07 |
| Anger | .00 | .15 | .03 | .62* | .03 | .46* | .02 |
| Surprise | .00 | .00 | .10 | .03 | .88* | .00 | .05 |
| Disgust | .00 | .03 | .10 | .18 | .03 | .23* | .00 |
| Neutral | .00 | .43* | .03 | .05 | .00 | .23* | .76* |
| Size | Happiness | Sadness | Fear | Anger | Surprise | Disgust | Neutral |
| Happiness | .74* | .11 | .26* | .05 | .08 | .15 | .10 |
| Sadness | .00 | .05 | .10 | .19 | .00 | .10 | .05 |
| Fear | .05 | .08 | .18 | .08 | .10 | .03 | .12 |
| Anger | .08 | .19 | .03 | .22 | .00 | .10 | .17 |
| Surprise | .05 | .11 | .08 | .00 | .63* | .00 | .02 |
| Disgust | .00 | .05 | .08 | .05 | .03 | .10 | .02 |
| Neutral | .08 | .40* | .28* | .41* | .18 | .53* | .51* |
Table 3.
Confusion matrices of 19 male subjects.
|
| |||||||
|---|---|---|---|---|---|---|---|
| Size 1 | Happiness | Sadness | Fear | Anger | Surprise | Disgust | Neutral |
| Happiness | .98* | .02 | .02 | .00 | .02 | .02 | .00 |
| Sadness | .00 | .69* | .00 | .12 | .00 | .02 | .06 |
| Fear | .00 | .04 | .46* | .02 | .05 | .00 | .00 |
| Anger | .00 | .02 | .04 | .60* | .00 | .46* | .08 |
| Surprise | .02 | .02 | .35* | .05 | .91* | .00 | .00 |
| Disgust | .00 | .16 | .13 | .18 | .02 | .50* | .02 |
| Neutral | .00 | .05 | .00 | .02 | .00 | .00 | .85* |
| Size | Happiness | Sadness | Fear | Anger | Surprise | Disgust | Neutral |
| Happiness | 1.00* | .00 | .02 | .00 | .02 | .00 | .02 |
| Sadness | .00 | .83* | .04 | .06 | .00 | .13 | .07 |
| Fear | .00 | .02 | .45* | .02 | .11 | .00 | .00 |
| Anger | .00 | .00 | .13 | .72* | .02 | 0.43* | .02 |
| Surprise | .00 | .00 | .23* | .04 | .86* | .00 | .00 |
| Disgust | .00 | .09 | .13 | .13 | .00 | .44* | .02 |
| Neutral | .00 | .06 | .00 | .04 | .00 | .00 | .87* |
| Size | Happiness | Sadness | Fear | Anger | Surprise | Disgust | Neutral |
| Happiness | .98* | .00 | .00 | .00 | .00 | .00 | .00 |
| Sadness | .00 | .71* | .05 | .16 | .00 | .04 | .07 |
| Fear | .00 | .04 | .47* | .07 | .04 | .00 | .02 |
| Anger | .02 | .02 | .07 | .57* | .02 | .57* | .02 |
| Surprise | .00 | .02 | .27* | .00 | .94* | .00 | .00 |
| Disgust | .00 | .11 | .13 | .20 | .00 | .39* | .00 |
| Neutral | .00 | .11 | .00 | .00 | .00 | .00 | .89* |
| Size | Happiness | Sadness | Fear | Anger | Surprise | Disgust | Neutral |
| Happiness | .96* | .02 | .21* | .07 | .04 | .00 | .06 |
| Sadness | .02 | .46* | .19* | .15 | .02 | .07 | .06 |
| Fear | .00 | .07 | .36* | .00 | .04 | .00 | .06 |
| Anger | .02 | .04 | .04 | .40* | .02 | .36* | .07 |
| Surprise | .00 | .00 | .09 | .05 | .87* | .00 | .00 |
| Disgust | .00 | .04 | .08 | .18 | .00 | .29* | .07 |
| Neutral | .00 | .37* | .04 | .15 | .02 | .27* | .69* |
| Size | Happiness | Sadness | Fear | Anger | Surprise | Disgust | Neutral |
| Happiness | .66* | .11 | .17 | .11 | .06 | .10 | .07 |
| Sadness | .07 | .15 | .15 | .13 | .08 | .08 | .13 |
| Fear | .04 | .07 | .06 | .02 | .12 | .00 | .07 |
| Anger | .07 | .05 | .06 | .11 | .06 | .10 | .07 |
| Surprise | .07 | .09 | .06 | .02 | .50* | .00 | .06 |
| Disgust | .00 | .07 | .06 | .20 | .00 | .12 | .04 |
| Neutral | .09 | .46* | .46* | .42* | .19 | .62* | .56* |
The results showed that women are consistently better at recognizing every emotion and that the percentages of error are diminished in women, although these confusions follow the same patterns seen in men. That was so at every image resolution. The only exception was sadness. Women were better at resolution 1. Men were more accurate and made less confusions at smaller resolutions. The female advantage in reading expressions of emotion was generally above the 1.5 standard deviations from the men average. In comparison, the differences between the confusion tables of Caucasian (Table 4) and non-Caucasian subjects (Table 5) were very small and not statistically significant from one another.
Table 4.
Confusion matrices of 16 Caucasian subjects.
|
| |||||||
|---|---|---|---|---|---|---|---|
| Size 1 | Happiness | Sadness | Fear | Anger | Surprise | Disgust | Neutral |
| Happiness | .98* | .02 | .04 | .00 | .00 | .02 | .00 |
| Sadness | .00 | .76* | .00 | .11 | .00 | .00 | .00 |
| Fear | .00 | .04 | .55* | .00 | .07 | .00 | .00 |
| Anger | .00 | .00 | .04 | .64* | .00 | .40* | .07 |
| Surprise | .02 | .00 | .30* | .04 | .91* | .00 | .00 |
| Disgust | .00 | .13 | .06 | .17 | .02 | .57* | .02 |
| Neutral | .00 | .04 | .00 | .04 | .00 | .00 | .91* |
| Size | Happiness | Sadness | Fear | Anger | Surprise | Disgust | Neutral |
| Happiness | 1.00* | .00 | .02 | .00 | .00 | .00 | .02 |
| Sadness | .00 | .89* | .00 | .02 | .00 | .07 | .09 |
| Fear | .00 | .04 | .57* | .00 | .06 | .00 | .00 |
| Anger | .00 | .00 | .06 | .80* | .02 | 0.43* | .04 |
| Surprise | .00 | .00 | .17 | .02 | .91* | .00 | .00 |
| Disgust | .00 | .04 | .17 | .11 | .00 | .50* | .00 |
| Neutral | .00 | .02 | .00 | .04 | .00 | .00 | .85* |
| Size | Happiness | Sadness | Fear | Anger | Surprise | Disgust | Neutral |
| Happiness | 1.00* | .00 | .04 | .00 | .00 | .00 | .00 |
| Sadness | .00 | .67* | .02 | .11 | .00 | .00 | .04 |
| Fear | .00 | .07 | .50* | .04 | .02 | .00 | .04 |
| Anger | .00 | .02 | .09 | .61* | .00 | .53* | .02 |
| Surprise | .00 | .00 | .22* | .02 | .98* | .00 | .00 |
| Disgust | .00 | .11 | .11 | .22* | .00 | .47* | .02 |
| Neutral | .00 | .13 | .02 | .00 | .00 | .00 | .88* |
| Size | Happiness | Sadness | Fear | Anger | Surprise | Disgust | Neutral |
| Happiness | .98* | .02 | .20 | .09 | .02 | .00 | .09 |
| Sadness | .02 | .41* | .11 | .11 | .00 | .00 | .02 |
| Fear | .00 | .04 | .39* | .00 | .02 | .00 | .07 |
| Anger | .00 | .00 | .05 | .49* | .00 | .39* | .04 |
| Surprise | .00 | .00 | .09 | .04 | .96* | .00 | .00 |
| Disgust | .00 | .04 | .11 | .23* | .00 | .35* | .07 |
| Neutral | .00 | .48* | .05 | .04 | .00 | .26* | .71* |
| Size | Happiness | Sadness | Fear | Anger | Surprise | Disgust | Neutral |
| Happiness | .67* | .13 | .21* | .09 | .09 | .09 | .11 |
| Sadness | .04 | .11 | .07 | .16 | .02 | .09 | .11 |
| Fear | .04 | .07 | .14 | .00 | .13 | .00 | .09 |
| Anger | .07 | .11 | .02 | .18 | .02 | .07 | .07 |
| Surprise | .07 | .04 | .07 | .00 | .51* | .00 | .07 |
| Disgust | .00 | .04 | .09 | .20 | .00 | .13 | .04 |
| Neutral | .11 | .50* | .40* | .38* | .22* | .63* | .51* |
Table 5.
Confusion matrices of 15 non-Caucasian subjects.
|
| |||||||
|---|---|---|---|---|---|---|---|
| Size 1 | Happiness | Sadness | Fear | Anger | Surprise | Disgust | Neutral |
| Happiness | 1.00* | .02 | .02 | .02 | .02 | .00 | .05 |
| Sadness | .00 | .69* | .00 | .12 | .00 | .02 | .07 |
| Fear | .00 | .04 | .42* | .05 | .02 | .00 | .00 |
| Anger | .00 | .02 | .02 | .63* | .02 | .46* | .05 |
| Surprise | .00 | .02 | .33* | .05 | .93* | .05 | .00 |
| Disgust | .00 | .13 | .21* | .09 | .00 | .48* | .02 |
| Neutral | .00 | .07 | .00 | .05 | .00 | .00 | .81* |
| Size | Happiness | Sadness | Fear | Anger | Surprise | Disgust | Neutral |
| Happiness | .98* | .00 | .02 | .00 | .02 | .00 | .00 |
| Sadness | .00 | .71* | .07 | .12 | .00 | .12 | .02 |
| Fear | .00 | .10 | .54* | .02 | .11 | .02 | .00 |
| Anger | .02 | .00 | .10 | .69* | .00 | 0.37* | .05 |
| Surprise | .00 | .00 | .20* | .05 | .84* | .00 | .00 |
| Disgust | .00 | .10 | .07 | .10 | .02 | .49* | .07 |
| Neutral | .00 | .10 | .00 | .02 | .00 | .00 | .85* |
| Size | Happiness | Sadness | Fear | Anger | Surprise | Disgust | Neutral |
| Happiness | .98* | .00 | .05 | .00 | .00 | .00 | .02 |
| Sadness | .00 | .74* | .07 | .11 | .00 | .07 | .05 |
| Fear | .00 | .00 | .50* | .04 | .05 | .00 | .00 |
| Anger | .02 | .05 | .02 | .56* | .02 | .49* | .05 |
| Surprise | .00 | .02 | .25* | .02 | .90* | .00 | .00 |
| Disgust | .00 | .07 | .11 | .18 | .02 | .44* | .02 |
| Neutral | .00 | .12 | .00 | .09 | .00 | .00 | .86* |
| Size | Happiness | Sadness | Fear | Anger | Surprise | Disgust | Neutral |
| Happiness | .98* | .05 | .09 | .02 | .05 | .02 | .02 |
| Sadness | .00 | .35* | .18* | .14 | .02 | .09 | .07 |
| Fear | .00 | .09 | .52* | .00 | .07 | .02 | .07 |
| Anger | .02 | .16 | .02 | .49* | .05 | .37* | .07 |
| Surprise | .00 | .00 | .09 | .05 | .77* | .00 | .05 |
| Disgust | .00 | .02 | .07 | .14 | .02 | .21* | .02 |
| Neutral | .00 | .33* | .02 | .16 | .02 | .28* | .70* |
| Size | Happiness | Sadness | Fear | Anger | Surprise | Disgust | Neutral |
| Happiness | .73* | .09 | .20* | .09 | .05 | .15 | .07 |
| Sadness | .05 | .14 | .18* | .14 | .07 | .10 | .09 |
| Fear | .05 | .09 | .09 | .09 | .10 | .03 | .11 |
| Anger | .09 | .07 | .07 | .12 | .05 | .10 | .11 |
| Surprise | .05 | .14 | .07 | .02 | .61* | .00 | .00 |
| Disgust | .00 | .09 | .02 | .09 | .02 | .10 | .02 |
| Neutral | .05 | .39* | .36* | .44* | .10 | .53* | .59* |
Discussion
Understanding how humans analyze facial expressions of emotion is key in a large number of scientific disciplines—from cognition to evolution to computing. An important question in the journey to understanding the perception of emotions is to determine how these expressions are perceived at different image resolutions or distances. In the present work, we have addressed this question.
The results reported above uncovered the recognition rates for six of the most commonly seen emotional expressions (i.e., happy, sad, angry, disgust, fear, surprise) and neutral as seen at five distinct resolutions. We have also studied the confusion tables, which indicate which emotions are mistaken for others and how often. We have seen that two of the emotions (happy and surprise) are easily recognized and rarely mistaken for others. Two other emotions (sadness and anger) are less well recognized and show strong asymmetric confusion with other emotions. Sadness is most often mistaken for neutral, anger for sadness and disgust. Yet, neutral is almost never confused for sadness, and sadness is extremely rarely mistaken for anger. The last two emotions (fear and disgust) were poorly recognized by our subjects. Nonetheless, their confusion patterns are consistent. Anger is very often mistaken for disgust. In fact, anger is sometimes classified more often as disgust than in its own category. Fear is commonly mistaken for surprise and, to a lesser degree, disgust, at short and mid-resolutions (i.e., 1 to 1/4). At small resolutions (i.e., 1/8), fear is also taken to be joy and sadness.
The results summarized in the preceding paragraph suggest three groups of facial expression of emotions. The first group (happy and surprise) is formed by expressions that are readily classified at any resolution. This could indicate that the production and perception systems of these facial expressions of emotion coevolved to maximize transmission of information (Fridlund, 1991; Schmidt & Cohn, 2001). The second group (angry and sad) is well recognized at high resolutions only. However, with their reduced recognition rates even at the highest resolution, the mechanisms of production and recognition of these expressions may not have coevolved. Rather, perception may have followed production, since recognition of these emotions at proximal distance could prove beneficial for survival to either the sender or receiver. The third group (fear and disgust) includes expressions that are poorly recognized at any distance. One hypothesis (Susskind et al., 2008) is that they are used as a sensory enhancement and blocking mechanism. Under this view, without the cooperation of a sender willing to modify her expression, the visual system has had the hardest work in trying to define a computational space that can recognize these expressions from a variety of distances. As in the first group, the emotions in this third group are recognized similarly at all distances—except when the percept is no longer distinguishable at resolution 1/16.
An alternative explanation for the existence of these three groups could be given by the priors assigned to each emotion. For example, University students and staff fell generally safe and happy. As a consequence, expressions such as happy could be expected, whereas fear may not.
Perhaps more intriguing is the asymmetric patterns in the confusion tables. Why should fear be consistently mistaken for surprise but not vice versa? One hypothesis comes from studies of letter recognition (Appelman & Mayzner, 1982; James & Ashby, 1982). Under this model, people may add unseen features to the percept but will only rarely delete those present in the image. For instance, the letter F is more often confused by an E than an E is for an F. The argument is that E can be obtained from F by adding a non-existing feature, whereas to perceive F from an E would require to eliminate a feature. Arguably, the strongest evidence against this model comes from the perception of neutral in sad faces, which would require eliminating all image features indicating to the contrary.
However, to properly consider the above model, it would be necessary to know the features (dimensions) of the computational space of these emotions. One possibility is that we decode the movement of the muscles of the face, i.e., the AUs correspond to the dimensions of the computational space (Kohler et al., 2004; Tian, Kanade, & Cohn, 2001). For example, surprise generally involves AUs 1 + 2 + 5 + 26 or 27. Fear usually activates 1 + 2 + 5 + 25 + 26 or 27 and it may also include AUs 4 and 20. Note that the AUs in surprise are a subset of those of fear. Hence, according to the model under consideration, it is expected that surprise will be mistaken for fear but not the other way around. Yet, surprise is not confused as fear, but fear is mistaken for surprise quite often. This means that active AUs such as 4, 20, or 25 should be omitted from the analysis. A more probable explanation is that the image features extracted to classify facial expressions of emotion do not code AUs. Further support for this latest point is given by the rest of the mistakes identified in Table 1. Sadness is confused for disgust, even though they do not share any common AU. Disgust and anger only share AUs that are not required to display the emotion. In addition, for anger to be mistaken as sadness, several active AUs should be omitted.
We have also considered the subtraction model (Appelman & Mayzner, 1982; Geyer & DeWald, 1973), where E is most likely confused for F because it is easier to delete a few features than to add them. This model is consistent with the confusion of fear for surprise but is inconsistent with all other misclassifications and asymmetries. The results summarized in the last two paragraphs are consistent with previous reports of emotion perception in the absence of any active AU (Hess, Adams, Grammer, & Kleck, 2009; Neth & Martinez, 2009; Zebrowitz, Kikuchi, & Fellous, 2007). In some instances, features seem to be added while others are omitted even as distance changes (Laprevote et al., 2010).
It could also be expected that expressions involving larger deformation are easier to identify (Martinez, 2003). The largest shape displacement belongs to surprise. This makes sense, since this expression is easily identified at any resolution. The recognition of surprise at images of 15 × 10 pixels is actually better than that of fear and disgust in the full resolution images (240 × 160 pixels). Happiness also has a large deformation and is readily successfully classified. However, fear and disgust include deformations that are as large (or larger) than happiness. Yet, these are the two expressions that are recognized most poorly.
Another possibility is that only a small subset of AUs is diagnostic. Happy is the only expression with AU 12, which uplifts the lip corners. This can make it readily recognizable. Happy plays a fundamental role in human societies (Russell, 2003). One hypothesis is that it had to evolve a clearly distinct expression. Some AUs in surprise seem to be highly diagnostic too, making it easy to confuse fear (which may have evolved to minimize sensory input) for surprise. In contrast, sadness activates AU 4 (which lowers the inner corners of the brows) and disgust activates AU 9 (which wrinkles the nose). These two AUs are commonly confused for one another (Ekman & Friesen, 1978), suggesting that they are not very diagnostic.
Differences in the use of diagnostic features seem to be further suggested by our results of women versus men. Women are generally significantly better in correctly identifying emotions and make less misclassifications. Other studies suggest that women are also more expressive than men (Kring & Gordon, 1998). Understanding gender differences is important not only to define the underlying model of face processing but also in a variety of social studies (Feingold, 1994).
Before further studies can properly address these important questions, we need a better understanding of the features defining the computational model of facial expressions of emotion. The above discussion strongly suggests that faces are not AU-coded, meaning that the dimensions of the cognitive space are unlikely to be highly correlated with AUs. Neth and Martinez (2010) have shown that shape has a significant contribution in the perception of sadness and anger in faces and that these are loosely correlated to AUs. Similarly, Lundqvist, Esteves, and Öhman (1999) found that eyebrows are generally best to detect threatening faces, followed by the mouth and eyes. The results reported above suggest that this order would be different for each emotion class.
Acknowledgments
The authors are grateful to Irv Biderman for discussion about this work. This research was supported in part by the National Institutes of Health under Grants R01-EY-020834 and R21-DC-011081 and by a grant from the National Science Foundation (IIS-07-13055). S. Du was also partially supported by a fellowship from the Center for Cognitive Sciences at The Ohio State University.
Footnotes
Commercial relationships: none.
Contributor Information
Shichuan Du, The Ohio State University, Columbus, OH, USA.
Aleix M. Martinez, The Ohio State University, Columbus, OH, USA
References
- Adolphs R. Regret in decision making. Cognitive Neuroscience of Human Social Behaviour. 2003;4:165–178. doi: 10.1038/nrn1056. [DOI] [PubMed] [Google Scholar]
- Appelman IB, Mayzner MS. Application of geometric models to letter recognition: Distance and density. Journal of Experimental Psychology. 1982;111:60–100. doi: 10.1037//0096-3445.111.1.60. [DOI] [PubMed] [Google Scholar]
- Burrows A, Cohn JF. Anatomy of the face. In: Li SZ, editor. Encyclopedia of Biometrics. Berlin, Germany: Springer; 2009. pp. 16–23. [Google Scholar]
- Chapman HA, Kim DA, Susskind JM, Anderson AK. In bad taste: Evidence for the oral origins of moral disgust. Science. 2009;323:1222–1226. doi: 10.1126/science.1165565. [DOI] [PubMed] [Google Scholar]
- Connolly T, Zeelenberg M. Regret in decision making. Current Directions in Psychological Science. 2002;11:212–216. [Google Scholar]
- Damassio AR. Descartes’ error: Emotion, reason, and the human brain. New York: Putnam’s Sons, G.P; 1995. [Google Scholar]
- Duchenne G-B. The mechanism of human facial expression. Paris: Jules Renard/Cambridge University Press; 1990. Original work published 1862. [Google Scholar]
- Ekman P, Friesen WV. Pictures of facial affect. Palo Alto, CA: Consulting Psychologists Press; 1976. [Google Scholar]
- Ekman P, Friesen WV. Facial action coding system: A technique for the measurement of facial movement. Palo Alto, CA: Consulting Psychologists Press; 1978. [Google Scholar]
- Feingold A. Gender differences in personality: A meta-analysis. Psychological Bulletin. 1994;116:429–456. doi: 10.1037/0033-2909.116.3.429. [DOI] [PubMed] [Google Scholar]
- Fridlund AJ. Evolution and facial action is reflex, social motive, and paralanguage. Biological Psychology. 1991;32:3–100. doi: 10.1016/0301-0511(91)90003-y. [DOI] [PubMed] [Google Scholar]
- Geyer LH, DeWald CG. Feature lists and confusion matrices. Perception & Psychophysics. 1973;14:471–482. [Google Scholar]
- Gitter AG, Black H, Mostofsky D. Race and sex in the perception of emotion. Journal of Social Issues. 1972;28:63–78. doi: 10.1080/00224545.1972.9918684. [DOI] [PubMed] [Google Scholar]
- Gold J, Bennett PJ, Sekuler AB. Identification of band-pass filtered letters and faces by human and ideal observers. Vision Research. 1999;39:3537–3560. doi: 10.1016/s0042-6989(99)00080-2. [DOI] [PubMed] [Google Scholar]
- Harmon LD, Julesz B. Masking in visual recognition: Effects of two-dimensional filtered noise. Science. 1973;180:1194–1197. doi: 10.1126/science.180.4091.1194. [DOI] [PubMed] [Google Scholar]
- Hess U, Adams RB, Grammer K, Kleck RE. Face gender and emotion expression: Are angry women more like men? Journal of Vision. 2009;9(12):19, 1–8. doi: 10.1167/9.12.19. http://www.journalofvision.org/content/9/12/19. [DOI] [PubMed] [Google Scholar]
- James TT, Ashby FG. Experimental test of contemporary mathematical models of visual letter recognition. Human Perception & Performance. 1982;8:834–864. doi: 10.1037//0096-1523.8.6.834. [DOI] [PubMed] [Google Scholar]
- Kanade T, Cohn J, Tian Y. Comprehensive database for facial expression analysis. Proceedings of the International Conference on Automatic Face and Gesture Recognition. 2000:46–53. [Google Scholar]
- Kohler CG, Turner T, Stolar NM, Bilker WB, Brensinger CM, Gur RE, et al. Differences in facial expressions of four universal emotions. Psychiatry Research. 2004;128:235–244. doi: 10.1016/j.psychres.2004.07.003. [DOI] [PubMed] [Google Scholar]
- Kring AM, Gordon AH. Sex differences in emotion: Expression, experience, and physiology. Journal of Personality and Social Psychology. 1998;74:686–703. doi: 10.1037//0022-3514.74.3.686. [DOI] [PubMed] [Google Scholar]
- Laprevote V, Oliva A, Delerue C, Thomas P, Boucart M. Patients with schizophrenia are biased toward low spatial frequency to decode facial expression at a glance. Neuropsychologia. 2010;48:4164–4168. doi: 10.1016/j.neuropsychologia.2010.10.017. [DOI] [PubMed] [Google Scholar]
- LeDoux JE. Emotion circuits in the brain. Annual Review of Neuroscience. 2000;23:155–184. doi: 10.1146/annurev.neuro.23.1.155. [DOI] [PubMed] [Google Scholar]
- Lundqvist D, Esteves F, Öhman A. The face of wrath: Critical features for conveying facial threat. Cognition and Emotion. 1999;13:691–711. doi: 10.1080/02699930244000453. [DOI] [PubMed] [Google Scholar]
- Majaj NJ, Pelli DG, Kurshan P, Palomares M. The role of spatial frequency channels in letter identification. Vision Research. 2002;42:1165–1184. doi: 10.1016/s0042-6989(02)00045-7. [DOI] [PubMed] [Google Scholar]
- Martinez AM. Matching expression variant faces. Vision Research. 2003;43:1047–1060. doi: 10.1016/s0042-6989(03)00079-8. [DOI] [PubMed] [Google Scholar]
- Massey DS. A brief history of human society: The origin and role of emotion in social life. American Sociological Review. 2002;67:1–29. [Google Scholar]
- Neth D, Martinez AM. Emotion perception in emotionless face images suggests a norm-based representation. Journal of Vision. 2009;9(1):5, 1–11. doi: 10.1167/9.1.5. http://www.journalofvision.org/content/9/1/5. [DOI] [PubMed] [Google Scholar]
- Neth D, Martinez AM. A computational shape-based model of anger and sadness justifies a configural representation of faces. Vision Research. 2010;50:1693–1711. doi: 10.1016/j.visres.2010.05.024. [DOI] [PMC free article] [PubMed] [Google Scholar]
- Parish DH, Sperling G. Object spatial frequencies, retinal spatial frequencies, noise, and the efficiency of letter discrimination. Vision Research. 1991;31:1399–1415. doi: 10.1016/0042-6989(91)90060-i. [DOI] [PubMed] [Google Scholar]
- Pentland A. Looking at people: Sensing for ubiquitous and wearable computing. IEEE Transactions on Pattern Analysis and Machine Intelligence. 2000;22:107–119. [Google Scholar]
- Rotter NG, Rotter GS. Sex differences in the encoding and decoding of negative facial emotions. Journal of Nonverbal Behavior. 1988;12:139–148. [Google Scholar]
- Russell JA. Core affect and the psychological construction of emotion. Psychological Review. 2003;110:145–172. doi: 10.1037/0033-295x.110.1.145. [DOI] [PubMed] [Google Scholar]
- Schmidt KL, Cohn JF. Human facial expressions as adaptations: Evolutionary questions in facial expression. Yearbook of Physical Anthropology. 2001;44:3–24. doi: 10.1002/ajpa.2001. [DOI] [PMC free article] [PubMed] [Google Scholar]
- Smith FW, Schyns PG. Smile through your fear and sadness: Transmitting and identifying facial expression signals over a range of viewing distances. Psychology Science. 2009;20:1202–1208. doi: 10.1111/j.1467-9280.2009.02427.x. [DOI] [PubMed] [Google Scholar]
- Susskind J, Lee D, Cusi A, Feinman R, Grabski W, Anderson AK. Expressing fear enhances sensory acquisition. Nature Neuroscience. 2008;11:843–850. doi: 10.1038/nn.2138. [DOI] [PubMed] [Google Scholar]
- Tian YI, Kanade T, Cohn JF. Recognizing action units for facial expression analysis. IEEE Transactions on Pattern Analysis and Machine Intelligence. 2001;23:97–115. doi: 10.1109/34.908962. [DOI] [PMC free article] [PubMed] [Google Scholar]
- Zebrowitz LA, Kikuchi M, Fellous JM. Are effects of emotion expression on trait impressions mediated by babyfaceness? Evidence from connectionist modeling. Personality and Social Psychology Bulletin. 2007;33:648–662. doi: 10.1177/0146167206297399. [DOI] [PubMed] [Google Scholar]