

Abstract
Intracellular Ca2+ is a key regulator of life or death decisions in cultured neurons and sensory cells. The role of Ca2+ in these processes is less clear in vivo, as the location of these cells often impedes visualization of intracellular Ca2+ dynamics. We generated transgenic zebrafish lines that express the genetically encoded Ca2+ indicator GCaMP in mechanosensory hair cells of the lateral line. These lines allow us to monitor intracellular Ca2+ dynamics in real time during aminoglycoside-induced hair cell death. After exposure of live larvae to aminoglycosides, dying hair cells undergo a transient increase in intracellular Ca2+ that occurs shortly after mitochondrial membrane potential collapse. Inhibition of intracellular Ca2+ elevation through either caged chelators or pharmacological inhibitors of Ca2+ effectors mitigates toxic effects of aminoglycoside exposure. Conversely, artificial elevation of intracellular Ca2+ by caged Ca2+ release agents sensitizes hair cells to the toxic effects of aminoglycosides. These data suggest that alterations in intracellular Ca2+ homeostasis play an essential role in aminoglycoside-induced hair cell death, and indicate several potential therapeutic targets to stem ototoxicity.
Introduction
Ca2+ is a ubiquitous, highly versatile second messenger, responsible for a broad range of physiological responses. The diversity of its roles is exemplified in the seemingly contradictory role of intracellular Ca2+ ([Ca2+]i) in response to cell stressors, where it can act as an initiator and effector of both prosurvival and procell death responses (Orrenius et al., 2003; Harr and Distelhorst, 2010). Ca2+ homeostasis in the cytosol is particularly critical, where Ca2+ concentration ([Ca2+]cyt) is orders of magnitude lower than in the extracellular environment (Clapham, 2007). Elevated [Ca2+]cyt has been observed in vitro in a number of cell types exposed to apoptogenic agents (Kaiser and Edelman, 1977; Schanne et al., 1979; Orrenius et al., 2003), implicating [Ca2+]cyt overload in cell death processes.
Despite the breadth of in vitro studies on the topic, little is known about [Ca2+]i dynamics during cell death in vivo, particularly as they relate to cytotoxic side effects associated with clinical therapeutics. Hair cells are ideal for studying in vivo [Ca2+]i dynamics because their function and survival depend on proper titration of [Ca2+]i during detection and transmission of acoustic information. Hair cells contain a number of mobile Ca2+ buffers and extrusion mechanisms to deal with these demands (Rabie et al., 1983; Baird et al., 1997; Steyger et al., 1997; Hackney et al., 2003; Hackney et al., 2005). Disruption of [Ca2+]i balance impairs hair cell function (LeMasurier and Gillespie, 2005; Vollrath et al., 2007; Gillespie and Muller, 2009; Jaalouk and Lammerding, 2009), and is implicated in several types of familial nonsyndromic hearing loss (Cryns et al., 2003; Osman et al., 2003; Schultz et al., 2005; Amr et al., 2007; Eisen and Ryugo, 2007; Giacomello et al., 2012). Elevated [Ca2+]i has been observed in chick and mouse cochlear explants after exposure to ototoxic agents (Hirose et al., 1999; Matsui et al., 2004). Support cells also release waves of extracellular Ca2+ after hair cell damage (Piazza et al., 2007; Lahne and Gale, 2008; Mann et al., 2009; Lahne and Gale, 2010), implicating Ca2+ signaling in clearing damaged hair cells. However, the location of inner ear hair cells unfortunately obscures study of [Ca2+]i dynamics surrounding manipulations in vivo.
We have taken advantage of the surface location of hair cells in the zebrafish lateral line system to study [Ca2+]i dynamics during ototoxin exposure in vivo. Lateral line hair cells, like those in mammalian inner ear, undergo dose-dependent degeneration when exposed to aminoglycoside antibiotics (Harris et al., 2003; Coffin et al., 2010). We generated transgenic zebrafish lines containing the genetically encoded Ca2+ indicator GCaMP3.0 (Tian et al., 2009) targeted to hair cells to quantitatively study [Ca2+]i dynamics in both surviving and dying hair cells in the same neuromasts after aminoglycoside exposure. Dying hair cells demonstrate dramatic elevation in [Ca2+]i immediately after mitochondrial membrane potential collapse. [Ca2+]i remains stable in surviving hair cells. In addition, pharmacological modulation of [Ca2+]i dynamics modifies aminoglycoside-induced hair cell death in a manner consistent with the conclusion that the events leading to elevation of [Ca2+]i are necessary and sufficient for aminoglycoside toxicity.
Materials and Methods
Fish.
Adult Danio rerio (zebrafish) were maintained in the University of Washington zebrafish facility. Experiments were performed on larvae of either sex raised to 5 d postfertilization (dpf) in E3 embryo media (14.97 mm NaCl, 500 μm KCl, 42 μm Na2HPO4, 150 μm KH2PO4, 1 mm CaCl dehydrate, 1 mm MgSO4, 0.714 mm NaHCO3, pH 7.2) unless otherwise indicated. All experiments were approved by the University of Washington Institution Animal Care and Use Committee.
Transgenesis constructs.
To establish the Tg(myo6b:GCaMP3)w78 transgenic line (hereafter cytoGCaMP), GCaMP3.0 was used as a [Ca2+]i sensor (Tian et al., 2009). Standard Gateway (Invitrogen) cloning techniques were used to generate transgenesis constructs under the control of the hair cell-specific myosin6b promoter (Obholzer et al., 2008). Briefly, embryos were injected at the one cell stage with ∼200 pg of transgenesis construct and 40 ng of transposase mRNA. Embryos were screened for GCaMP-positive hair cells at 3 dpf and were grown to adulthood. Adults were screened for germline incorporation through pairwise matings, and a founder line was chosen based on fluorescence intensity. Offspring were subsequently generated through pairwise matings to wild-type (*AB) adults.
Vital dyes.
To monitor changes in mitochondrial membrane potential, larvae were incubated in 20 nm tetramethylrhodamine ethyl ester (TMRE; Invitrogen) in E3 for 20 min and were washed 3× in embryo media before imaging. For hair cell survival analyses, 2-[4-(dimethylamino)styryl]-N-ethylpyridinium iodide (DASPEI) was used to stain hair cells within neuromasts. Larvae were incubated in embryo medium containing 0.005% DASPEI for 15 min. The zebrafish were then rinsed 3× in embryo medium, anesthetized in MESAB (MS-222; ethyl-m-aminobenzoate methanesulphonate), and analyzed under an epifluorescence dissecting microscope equipped with a DASPEI filter set (excitation 450–490 nm and barrier 515 nm).
Drug treatment.
Neomycin and gentamicin (Sigma-Aldrich) were used at indicated concentrations in embryo media. For all experiments, larvae were exposed to aminoglycoside for either 30 or 60 min.
Leupeptin (Calbiochem) and the CaM inhibitors A7 and W7 (Tocris Bioscience) were dissolved in DMSO. Optimal concentrations were determined by the concentrations found to confer maximal protection in the presence of 200 μm neomycin (see Figs. 10A and 11A). These were as follows: leupeptin, 500 μm; A7, 30 μm; W7, 20 μm. Controls were treated identically with 0.5% DMSO.
Figure 10.

Pharmacological inhibitors of calmodulin protect lateral line hair cells from aminoglycoside-induced hair cell death. A, Optimal doses of A7 and W7 were determined by pretreatment of inhibitor followed by coadministration with 200 μm neomycin. B, Lateral line hair cell survival after pretreatment of the calmodulin inhibitors A7 (30 μm) and W7 (20 μm) and subsequent coadministration with increasing doses of neomycin. Hair cell counts are of parvalbumin-positive hair cells. Error bars indicate SD; n = 6 neuromasts from each of 5 treated larvae. ***p < 0.0001 (two-way ANOVA, Tukey post-test).
Figure 11.

Pharmacological inhibitors of Ca2+-activated serine proteases protect lateral line hair cells from aminoglycoside-induced hair cell death. A, Optimal doses of leupeptin determined by pretreatment of inhibitor followed by coadministration with 200 μm neomycin. B, Lateral line hair cell survival after pretreatment of leupeptin (500 μm) and subsequent coadministration with increasing doses of neomycin. Hair cell survival was assessed with DASPEI scoring (Harris et al., 2003). Error bars indicate SD; n = 10 neuromasts from each of 12 treated larvae. ***p < 0.0001 (two-way ANOVA, Tukey post-test).
Hair cell survival.
Larvae were pretreated in Ca2+ modulators for 60 min, followed by coadministration with the specified concentration of neomycin for either 30 or 60 min. They were then washed 3× in E3 and allowed to recover for 30 min. Hair cell survival was assayed either with DASPEI (Harris et al., 2003) or with anti-parvalbumin antisera (Steyger et al., 1997). For DASPEI assessment, relative fluorescent intensity was examined for 10 neuromasts per fish and 12 animals per treatment group (Harris et al., 2003), whereas for anti-parvalbumin labeling the mean hair cell counts across five neuromasts (IO4, M2, MI1, O1, and O2) (Raible and Kruse, 2000) were calculated across at least five larvae. All survival measures are reported as percentage survival after normalization to controls. Controls for each experiment were treated identically, except for the compound of interest.
Imaging.
A total of 5 dpf larvae were immersed in E3-containing 0.2% MESAB (MS-222; ethyl-m-aminobenzoate methanesulphonate) and stabilized using nylon mesh and a brain slice anchor harp (Harvard Instruments) as a stabilizing weight so that neuromasts on immobilized larvae had free access to surrounding media. Baseline fluorescence readings were taken before aminoglycoside exposure in 30 s intervals for 5 min (a total of 10 readings). For images presented here, baseline readings were shortened to five readings. Aminoglycoside was added as a 4× concentrated stock to achieve the indicated final concentration, and additional fluorescence intensity readings were acquired in 30 s intervals for 60 min. Images were taken using a Marianas spinning disk system (Intelligent Imaging Innovations) equipped with an Evolve 10 MHz EMCCD camera (Photometrics) and a C-Apochromat 63×/1.2 NA Water Objective (Carl Zeiss). Camera intensification was set to keep exposure times <50 ms for GCaMP and 250 ms for TMRE; pixel intensities were <25% of saturation. Z-sections were taken at 2 μm intervals through the depth of the neuromast, typically over a total of 12 μm. GCaMP fluorescence was acquired with a 488 nm laser and 535/30 emission filter. TMRE fluorescence was acquired with a 561 nm laser and 617/73 emission filter.
cytoGCaMP calibration.
Ca2+ responsiveness of GCaMP in cytoGCaMP transgenic animals was determined by first exposing larvae to E3-containing 0 mm Ca2+ and 5 mm EGTA in the presence of 5 μm ionomycin (in 0.1% DMSO; Sigma-Aldrich) for 30 min. This led to a reduction in [Ca2+]i and subsequent stabilization in GCaMP fluorescence, confirmed through imaging and analysis (data not shown). The 40, 70, 540, 610, 700, 1.1, and 1.2 μm Ca2+ was then added back (as 0.14, 0.22, 0.9, 1.76, 1.96, 2.2, 3.28, 3.6, 3.8, 3.95, 4.1, and 4.5 mm E3 stocks, with 5 mm EGTA), and images were taken as described above for 30 min, with baseline imaging for 5 frames (2.5 min) before extracellular Ca2+ application. Additional neuromast imaging was performed for 1 h with 0 mm Ca2+/EGTA in the presence of 5 μm ionomycin to confirm that Ca2+-free conditions were nontoxic to hair cells. After addition of Ca2+, hair cell number at the end of imaging was compared with hair cell number present during baseline imaging. Dying cells were not used in cytoGCaMP response analyses.
Fluorescence image analysis.
Each neuromast was imaged for a total of ≥65 min. Images were collected at 30 s intervals. Unless otherwise indicated, aminoglycoside (neomycin or gentamicin) was added after a baseline imaging period of 5 min. This yielded 10 baseline images and ≥120 images with the drug or drugs present.
The 4-D stacks were converted to projection images for analysis of fluorescence intensity. Average and maximum intensity projections of the same regions of interest were evaluated, both displaying similar trends and a good linear fit between maximal fluorescence of projection types when graphed against one another (r2 = 0.94; data not shown). We opted to analyze maximum intensity projections to minimize small (<2 μm) variances in Z drift across neuromasts. The cytoplasm of each hair cell contained ∼160 pixels within each Z plane, minimizing concerns of possible undersampling with this projection method.
Each individual hair cell was categorized as living or dying based on its survival or clearance from the neuromast during the 60 min aminoglycoside exposure. Previous studies indicate that hair cell loss resulting from neomycin exposure in the concentration range used here is complete by this time (Owens et al., 2007). cytoGCaMP and TMRE fluorescence intensity were calculated relative to the mean baseline intensity of each individual hair cell before aminoglycoside exposure. For each treatment condition, at least three experiments were performed on different days. Unless otherwise noted, fluorescence intensity of no more than three cells per neuromast and two neuromasts per larvae from the IO4, M2, MI1, O1, or O2 neuromasts were used in the analyses. Dying cells were randomly chosen independent of their position, starting intensity, or time of clearance.
Typically, there was <50 pixel (at 0.207 μm/pixel under our imaging conditions) XY drift and <2 μm Z drift of image field in raw time-lapse movies. Images with ≥2 μm Z drift were discarded. Image auto-alignment was performed with SlideBook software (Intelligent Imaging Innovations). After alignment, there was typically <5 pixel XY drift. ROIs outlining the cell of interest were drawn by hand, enabling us to correct for individual cell movement when necessary. In some cases, a sudden increase in pixel intensity confused the alignment algorithm, resulting in XY jitter. In these instances, ROIs were redrawn frame-by-frame to encompass the same cell throughout the interval of analysis.
Photolysis of caged diazo2 and EGTA.
Embryos were injected at the one cell stage with either ∼1 nl of 25 mm NP-EGTA (dissolved in 100 mm KCl, 40 mm HEPES, pH 7.2) or ∼1 nl of 25 mm diazo-2 (dissolved in 100 mm KCl, 10 mm EGTA, 10 mm MOPS, pH 7.2) as previously described (Leung et al., 2009). At 5 dpf, compounds were activated via photolysis. For hair cell counts, larvae were exposed to UV light from a transilluminator for 30 s, where they were then allowed to rest for 5 min and subsequently exposed to the indicated concentration of neomycin for 60 min. To measure the effectiveness of uncaging, caged compounds were coinjected with cytoGCaMP transgenesis constructs. Larvae were mounted for imaging, and baseline fluorescence readings were taken as described above, after which they were exposed to a 1–3 ms pulse from a 405 nm photoactivation laser. Although not directly comparable to our more global method of uncaging via transilluminator, we were nonetheless able to confirm the activity of our caged compounds in this manner (see Fig. 8).
Figure 8.
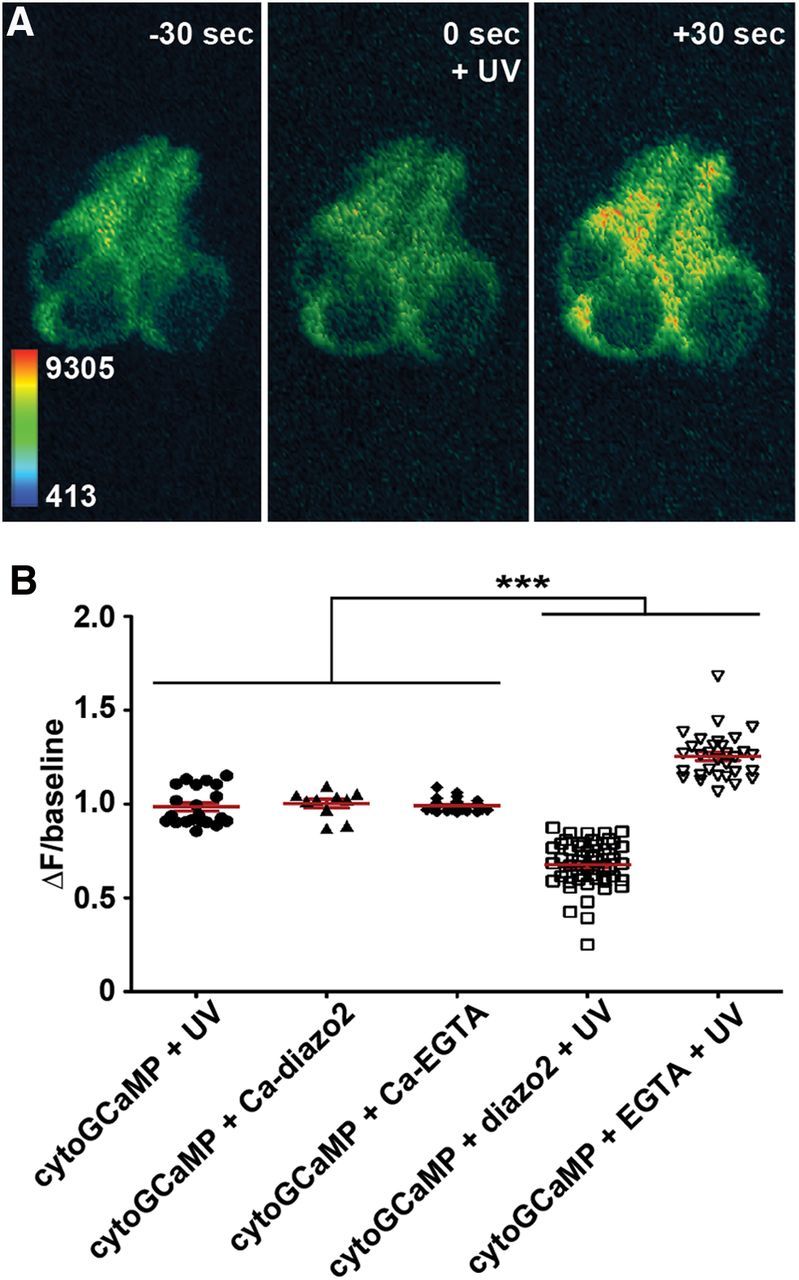
Effectiveness of caged Ca2+ modulators at altering intracellular Ca2+ within lateral line hair cells. A, ΔF/baseline of Tg(myo6b:GCaMP3) 1 min after exposure to UV light. Where indicated, larvae were injected with caged diazo2 or caged EGTA at the one cell stage, and then uncaged at 5 dpf. ***p < 0.0001 between uncaged cells and controls (one-way ANOVA, Bonferroni post-tests). UV/diazo-2 cells are also as expected significantly different from UV/EGTA cells (p < 0.0001). Error bars indicate SEM. B, Heat-mapped, time-lapse images of the lateral line neuromast of a Tg(myo6b:GCaMP3) larvae injected with caged EGTA at one cell stage and exposed at 5 dpf to UV light. cytoGCaMP fluorescence increases after UV exposure (uncaging). Time indicates seconds elapsed in relation to UV exposure.
Hair cell position and initial cytoGCaMP intensity.
Hair cell positions were defined as central or peripheral based on the distance of their nuclei from the center of the clustered hair cell stereocilia bundles. Central hair cells were defined as containing nuclei within a 5 μm radius from the center of the stereocilia bundle cluster, and peripheral hair cells containing nuclei 5–10 μm away. For comparison of initial intensities, mean baseline intensities of the first 10 frames were compared either between central and peripheral cells or living and dying cells. For this analysis, all hair cells within a neuromast were included.
Statistics.
Graphpad Prism Software (version 5.0) was used for the statistical analyses indicated. Error bars indicate either SEM or SD, as indicated.
Results
Elevated [Ca2+]cyt occurs during aminoglycoside-induced hair cell death
Previous studies of [Ca2+]i regulation in hair cells in response to aminoglycoside exposure have used inner ear sensory epithelium explants. These studies were limited to cross-sectional analyses (Hirose et al., 1999; Matsui et al., 2004). To determine whether aminoglycoside-induced hair cell death triggers elevated [Ca2+]i in zebrafish hair cells in vivo, we generated a transgenic zebrafish line driving GCaMP3.0 under the control of the hair cell-specific myosin 6b (myo6b) promoter [Tg(myo6b:GCaMP3), hereafter referred to as cytoGCaMP] to monitor changes in [Ca2+]cyt after aminoglycoside exposure.
We initially attempted to translate the in vitro biophysical characterization of GCaMP3 (Tian et al., 2009; Akerboom et al., 2012) into a meaningful physiological context within hair cells. We first depleted free Ca2+ within hair cells by exposing transgenic cytoGCaMP larvae to embryo medium containing 0 mm Ca2+ and 5 mm EGTA in the presence of 5 μm ionomycin. Under these conditions, cytoGCaMP fluorescence dropped significantly below baseline levels and reached a steady state within 30 min after exposure (data not shown). We then added extracellular Ca2+ at increasing concentrations to determine the minimum changes in [Ca2+] that cytoGCaMP was capable of detecting under our imaging conditions (Fig. 1). Representative and mean changes in fluorescence after addition of 70 nm, 270 nm, and 610 nm Ca2+ are shown in Figure 1A. cytoGCaMP of most hair cells within a neuromast responded quickly to addition of [Ca2+] >40 nm, although the strength and timing of the initial response depended on [Ca2+] added. In all cases, fluorescence increased and plateaued, reaching maximal fluorescence [(ΔF/background)max] within 3 min after Ca2+ addition. Average changes in fluorescence over time after 1–270 nm Ca2+ addition, represented as the ratio to SD of control data, are illustrated in Figure 1B, C. These measurements show the approximate threshold of detectable response to exogenous Ca2+: 40 nm Ca2+ elicited a slight cytoGCaMP response 2–3 SDs above baseline, whereas 70 nm Ca2+ elicited a more substantial response of 4–8 SDs above baseline (Fig. 1B,C). Overall, maximal cytoGCaMP fluorescence responded to 40 nm to 2.1 μm Ca2+ in a dose-dependent manner (r = 0.93, p < 0.001; Fig. 1D). At 540 nm Ca2+, slightly above the 400 nm Kd of GCaMP3 (Akerboom et al., 2012), we detected maximal fluorescence of 0.5-fold above baseline levels. At 1.2 μm Ca2+, above the saturation point of purified GCaMP3 in vitro (Tian et al., 2009), we detected maximal fluorescence of 0.8-fold above baseline levels (Fig. 1D). Between 1.2 and 2.1 μm Ca2+, we observed the sharpest rise in maximal fluorescence to 3.3-fold above baseline levels. Maximal fluorescence of fivefold above baseline did not increase at concentrations >2.5 μm Ca2+, indicating saturation of the sensor. Together, these data indicate that we are capable of detecting [Ca2+]cyt fluctuations as low as 70 nm with cytoGCaMP and that the maximal fluorescent GCaMP response of 6 is not achieved until saturation occurs at >2.1 μm extracellular Ca2+.
Figure 1.
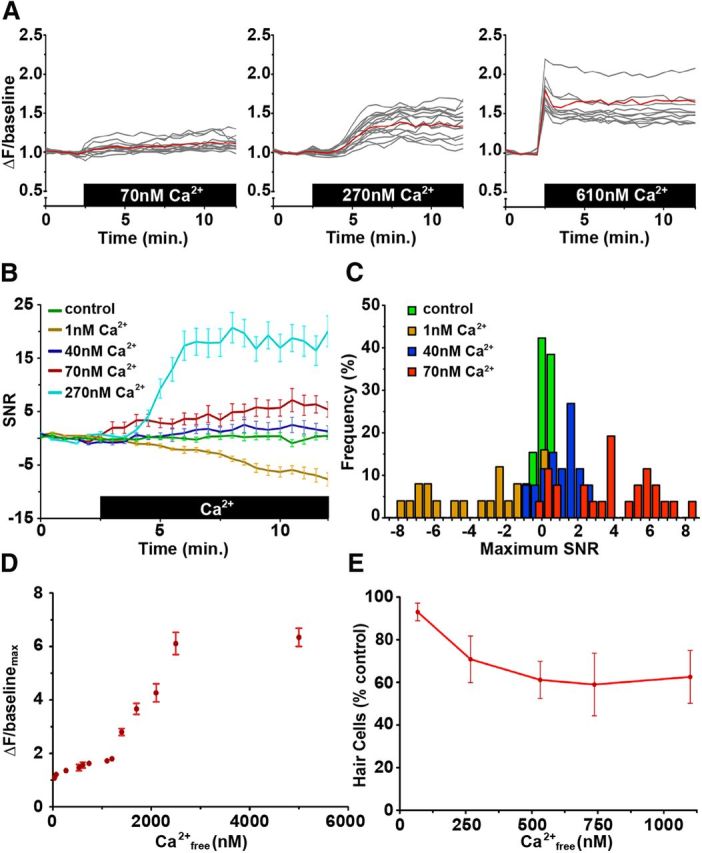
Calibration of cytoGCaMP within lateral line hair cells. A, Change in fluorescence (ΔF/baseline) of living Tg(myo6b:GCaMP3) lateral line hair cells during exposure to 5 μm ionomycin and 70 nm, 270 nm, or 610 nm extracellular Ca2+. Baseline is taken in 1 nm Ca2+/5 mm EGTA and 5 μm ionomycin. Gray lines indicate data from individual cells, and red lines indicate the mean response; n = 10 cells from one neuromast. B, Mean responses of living Tg(myo6b:GCaMP3) lateral line hair cells during exposure to 5 μm ionomycin and varying levels of extracellular Ca2+. Baseline is taken in 1 nm Ca2+/5 mm EGTA and 5 μm ionomycin, and values are expressed as SDs around baseline (signal-to-noise ratio [SNR]). C, Frequency of SDs around baseline (expressed as maximum SNR) of the mean cytoGCaMP response after addition of indicated extracellular [Ca2+] and EGTA in the presence of ionomycin. D, Plot of maximal fluorescence [(ΔF/baseline)max] and extracellular Ca2+. Error bars indicate SEM; n = 7–40 cells from ≥3 neuromasts. E, Hair cell survival after 30 min exposure to extracellular Ca2+. Error bars indicate SEM; n >7 neuromasts. Dying cells were not used in data acquired in A to D.
Exposure to 0 mm Ca2+ in the presence of ionomycin was not toxic to hair cells over the time assayed. Addition of [Ca2+] >70 nm induced hair cell death in ∼25% of hair cells within a neuromast over the course of imaging (Fig. 1E). Dying cells were not used in the evaluation of cytoGCaMP responsiveness. However, these observations begin to implicate increased [Ca2+]cyt and altered [Ca2+]i homeostasis in hair cell death.
To evaluate [Ca2+]cyt within individual hair cells of a mixed population of living and dying cells uniformly exposed to aminoglycoside, we administered 50 μm neomycin, a concentration that induces hair cell death in 20–40% of the lateral line hair cells within a neuromast (Harris et al., 2003). Figure 2 shows a representative example over the period where three hair cells that will die and be extruded show a marked increase in [Ca2+]cyt. We found that all dying hair cells exposed to neomycin or gentamicin exhibited sharp peaks in cytoGCaMP fluorescence shortly before neuromast clearance. Typical fluorescence measurements of nine dying hair cells from three neuromasts are shown in Figure 3A, E. Note that sharp peaks in cytoGCaMP fluorescence 2- to 4-fold above baseline are seen just before clearance. In contrast, the typical behaviors of nine living cells from three neuromasts are shown in Figure 3B, F; as illustrated here, cytoGCaMP fluorescence typically fluctuated ±0.2-fold within hair cells that did not die. Neither dying nor living cells from within the same neuromast appeared to undergo coordinated [Ca2+]i changes during our imaging period.
Figure 2.

Cytoplasmic Ca2+ transients precede cell death in lateral line hair cells exposed to aminoglycoside antibiotics. Heat-mapped, time-lapse image of a Tg(myo6b:GCaMP3) anterior lateral line neuromast exposed to 50 μm neomycin. Time (min:sec) after neomycin administration is indicated. Cells that die and are extruded from the neuromast are highlighted with dashed lines. Note that cytoGCaMP fluorescence in living cells remains largely static, whereas that of dying cells peaks shortly before clearance from the neuromast.
Figure 3.
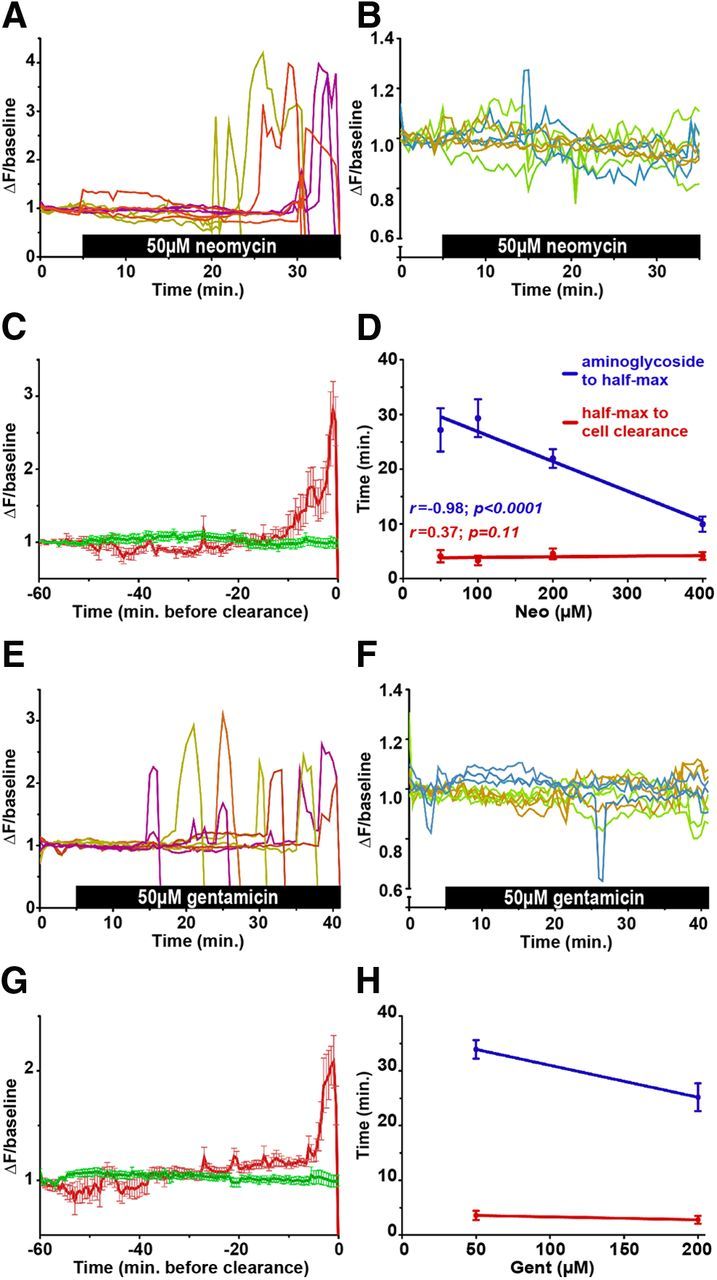
Cytoplasmic Ca2+ dynamics in lateral line hair cells after aminoglycoside exposure. A, B, E, F, Transformed (ΔF/baseline) fluorescence intensity data of individual dying (A, E) or living (B, F) Tg(myo6b:GCaMP3) hair cells exposed to 50 μm neomycin (A, B) or 50 μm gentamicin (E, F). Three cells each from three neuromasts are depicted; traces are color-coded to illustrate neuromast of origin. Dying cells were chosen to highlight variability in the timing of cell death. C, G, Mean intensity data of living (green) or dying (red) Tg(myo6b:GCaMP3) hair cells exposed to 50 μm neomycin (C) or 50 μm gentamicin (G) aligned to the time point at which they are cleared from the neuromast. Because living cells are not cleared, they are aligned to the end of imaging (i.e., the last 60 min). D, H, Plot of the time at which half-maximal [(ΔF/baseline)half-max] Tg(myo6b:GCaMP3) intensity ratios or cell clearance occur in response to increasing neomycin (D) or gentamicin (H) concentrations. p value indicates significance of the correlation coefficient. In all grouped data, error bars indicate SEM; n = 15 from >5 neuromasts and experimental runs.
To determine whether we could detect a response to aminoglycoside exposure in surviving hair cells, we computed the fluorescent intensity mean and SD during the 5 min baseline period for each of 15 surviving hair cells that were exposed to 50 μm neomycin and 10 control hair cells exposed to embryo medium alone. For each hair cell, we then counted the number of times fluorescence increased >2 SD above baseline during the ensuing 60 min. We observed no significant differences in the number of peaks oscillating > 2 SDs around baseline compared with hair cells not exposed to aminoglycoside (23.5 ± 4.3 for controls vs 29.9 ± 5.4 for living cells, mean ± SEM).
As illustrated in Figure 3A, E, the death and extrusion of individual hair cells in a neuromast happen quickly and are not synchronized with other overt events. Aligning fluorescence intensity data to the time point at which hair cells were cleared from the neuromast allowed grouped comparisons of [Ca2+]cyt dynamics of dying hair cells within and across neuromasts exposed to either neomycin or gentamicin. Grouped data (Fig. 3C,G) aligned in this way resembled traces from individual cells, suggesting that changes in [Ca2+]cyt are stereotyped among dying hair cells. Moreover, cytoGCaMP behaviors in hair cells exposed to either neomycin or gentamicin are markedly similar. The initial cytoGCaMP fluorescence increase in dying hair cells exposed to either aminoglycoside begins ∼8 min before cell clearance. The half-maximal change in cytoGCaMP fluorescence [(ΔF/background)half-max] occurs ∼4 min before cell clearance. Increasing aminoglycoside concentration decreases the latency at which half-maximal change occurs after exposure but has little effect on the behavior of the cytoplasmic peak or its timing relative to cell clearance (Fig. 3D,H). This observation indicates that aminoglycoside concentration directly affects the timing of large-scale [Ca2+]i dysregulation observed within dying cells. That the peak occurs before clearance and independent of aminoglycoside concentration suggests that such dysregulation may be instrumental in the cell death process.
Early [Ca2+]cyt is not predictive of aminoglycoside susceptibility
The reasons for incomplete aminoglycoside toxicity are poorly understood and perplexing because all hair cells within a neuromast are presumably exposed to nearly identical aminoglycoside concentrations. We analyzed grouped data aligned at the onset of imaging to determine whether aminoglycosides initiate early [Ca2+]cyt responses that influence cell death or survival (Fig. 4). We observed no significant difference in cytoGCaMP response between cells that would eventually die and their living counterparts after exposure to either 50 μm neomycin (Fig. 4A) or 50 μm gentamicin (Fig. 4B). No differences were observed when cumulative ΔF/baseline ratios were compared (Fig. 4C).
Figure 4.

Early cytoplasmic Ca2+ response is indistinguishable between cells that are resistant or susceptible to aminoglycosides. A, B, Mean cytoGCaMP response of cells that are resistant (gray) or susceptible (black) for the initial 10 min after 50 μm neomycin (A) or 50 μm gentamicin (B) exposure. C, Cumulative cytoGCaMP fluorescence (expressed as cumulative ΔF/baseline) of aminoglycoside resistant (gray) or susceptible (black) cells. Error bars indicate SEM; n = 18 and 20 neomycin-treated resistant and susceptible cells, respectively, from >6 neuromasts, and 15 each of gentamicin-treated resistant or susceptible cells from 5 neuromasts.
We next examined whether hair cell location or initial [Ca2+]cyt had any bearing on aminoglycoside susceptibility. We divided hair cells within a neuromast into central or peripheral categories based on the distance of hair cell nuclei from center of the stereocilia bundles. No significant relationship between toxicity and hair cell location could be discerned after exposure to 50 μm neomycin (Fig. 5A). Range of baseline cytoGCaMP intensities between central and peripheral location overlapped when all hair cells within a neuromast were compared (Fig. 5B). Moreover, we were unable to detect a difference in baseline cytoGCaMP intensity between dying hair cells hair cells in neuromasts exposed to 50 μm neomycin (Fig. 5C). We conclude that neither cytoGCaMP fluorescence before or after initial aminoglycoside addition nor hair cell position is predictive of whether a cell lives or dies.
Figure 5.

Initial cytoplasmic Ca2+ levels are not indicative of cell position within a neuromast or aminoglycoside susceptibility. A, Percentage of dying hair cells within a neuromast exposed to 50 μm neomycin. Central hair cells were defined as containing nuclei within a 5 μm radius from the center of the stereocilia bundle cluster, and peripheral hair cells containing nuclei 5–10 μm away. Error bars indicate SEM; n = 7 neuromasts. B, Mean (inner bar) and range (outer bars) of mean baseline intensity of all centrally and peripherally located hair cells of 5 neuromasts. C, Mean (inner bar) and range (outer bars) of mean baseline intensity of all dying and living hair cells of 5 neuromasts exposed to 50 μm neomycin.
[Ca2+]cyt increases during hair cell death independent of aminoglycoside concentration
We next sought to determine how [Ca2+]i varies with the degree of aminoglycoside exposure (Fig. 6). We first compared changes in cytoGCaMP fluorescence between hair cells from the same neuromasts that were destined to live or die from exposure to intermediate concentrations of either neomycin or gentamicin. Maximum fluorescence of living cells exposed to either neomycin or gentamicin was similar and not significantly different from controls (Fig. 6A). As expected, dying cells exposed to either 50 μm neomycin or 50 μm gentamicin exhibited significant elevations in fluorescence intensity compared with living counterparts or to controls (all p < 0.0001; Fig. 6A). Maximal cytoGCaMP intensities among dying cells were on average approximately threefold above baseline, regardless of the concentration of neomycin or gentamicin exposure (Fig. 6A). Maximal cytoGCaMP values of dying hair cells did not show dose-dependent behavior with respect to increasing concentrations of neomycin (r = −0.08; Fig. 6B). This is unlikely to be the result of saturation of the Ca2+ sensor as we were able to achieve ΔF/baseline as high as 8 in other contexts (data not shown).
Figure 6.
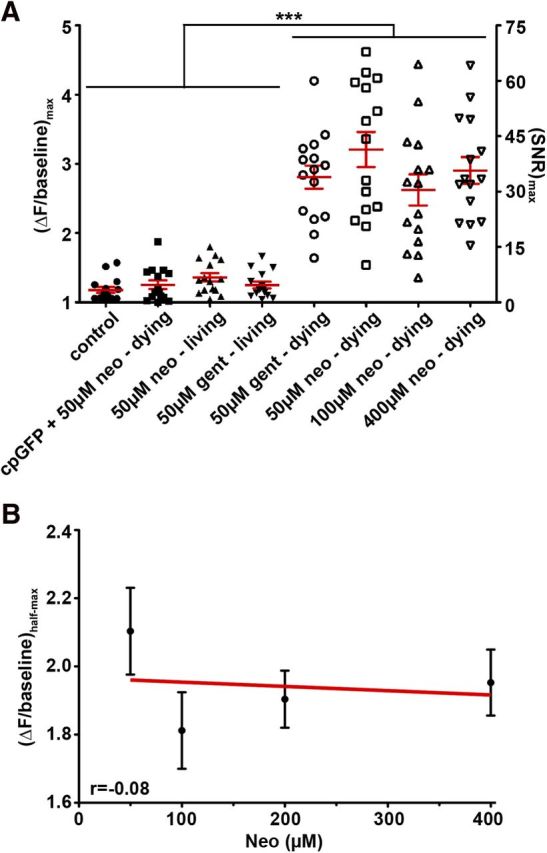
Dose-independent response of cytoplasmic Ca2+ within dying lateral line hair cells to aminoglycoside exposure. A, Maximal intensity ratios of Tg(myo6b:GCaMP3) compared between living and dying cells exposed to increasing concentrations of neomycin and gentamicin. Corresponding signal-to-noise ratios (SNR) are indicated on the right axis. Data are mean ± SEM indicated for each group. Cells expressing cpGFP die after exposure to 50 μm neomycin. Note that there is little variability in [Ca2+]i response in hair cells that live (or in cpGFP-expressing cells that die) regardless of condition, whereas the variability of the GCaMP3.0 response is much greater, although the level of the response does not depend on neomycin concentration. ***p < 0.0001 (one-way ANOVA, Dunnett post-test). B, Linear regression analysis of maximal intensity ratios in response to increasing neomycin concentrations. Error bars indicate SEM; n = 15 from >5 experimental runs.
To address whether the microenvironment of dying cells might influence GCaMP fluorescence regardless of Ca2+, and therefore complicate the interpretation of the GCaMP signal, we engineered fluorophores that lack the Ca2+ binding domain of GCaMP (cpGFP). Fluorescence of these targeted cpGFP constructs did not change in dying cells exposed to 50 μm neomycin (Fig. 6A), demonstrating that cellular events that occur during death (e.g., acidification, proteolysis, membrane permeabilization) do not affect Ca2+ measurements by altering GCaMP fluorescence in a non-Ca2+-dependent manner.
Elevated [Ca2+]i occurs after mitochondrial potential collapse
Aminoglycosides are capable of direct interaction with mitochondrial translation machinery (Wirmer and Westhof, 2006; Hobbie et al., 2008). In addition, changes in mitochondrial proton gradient and morphology accompany aminoglycoside exposure in zebrafish and mammalian hair cells (Dehne et al., 2002; Owens et al., 2007; Tiede et al., 2009; Jensen-Smith et al., 2012), supporting the hypothesis that such interactions may underlie aminoglycoside toxicity in sensitive cells. To visualize changes in Ca2+ compared with dynamic behaviors of mitochondria after aminoglycoside exposure, we monitored cytoGCaMP fluorescence in hair cells colabeled with the potentiometric mitochondrial dye, TMRE. Increased TMRE loading is indicative of increased mitochondrial membrane potential, whereas its redistribution into cytoplasm indicates opening of mitochondrial transition pore and loss of membrane potential (Pinton et al., 2008; Giorgi et al., 2012).
We measured TMRE and [Ca2+]i responses in hair cells after exposure to 400 μm neomycin, a concentration that results in death of all hair cells in neuromasts (Harris et al., 2003). After neomycin exposure, mitochondrial TMRE labeling remained stable for a brief time. Approximately 15 min before cell clearance, labeling increased ∼0.5-fold to onefold above baseline. TMRE label then redistributed to the cytoplasm before cell clearance, and cytoGCaMP peaks were consistently observed after TMRE redistribution (Fig. 7A,B). When group data were aligned to TMRE redistribution [(ΔF/background)half-min], half-maximal cytoGCaMP levels were reached ∼1 min later (Fig. 7C,D). Cell clearance occurred ∼5 min after TMRE redistribution (Fig. 7C,D). These data demonstrate that the increase in [Ca2+]cyt directly follows mitochondrial potential collapse.
Figure 7.

Timing of cytoplasmic Ca2+ peaks relative to loss of mitochondrial membrane potential. A, Heat-mapped, time-lapse image of Tg(myo6b:GCaMP3) anterior lateral line neuromasts colabeled with the potentiometric vital dye TMRE and exposed to 400 μm neomycin. Time indicates seconds relative to TMREhalf-min of the outlined cell, corresponding with TMRE redistribution from mitochondria into cytoplasm. Note that TMRE redistribution occurs before elevated cytoGCaMP fluorescence. B, Transformed (ΔF/baseline) fluorescence intensity data of individual dying Tg(myo6b:GCaMP3) hair cells (solid lines) labeled with TMRE (dashed lines) and exposed to 400 μm neomycin. Cells were chosen to highlight variability in both TMRE response and cell death. Note the reduction in TMRE fluorescence, corresponding with cytoplasmic TMRE redistribution, before cytoGCaMP peaks. C, Mean fluorescent intensity data of Tg(myo6b:GCaMP3) in dying anterior lateral line hair cells colabeled with TMRE and exposed to 400 μm neomycin. Data are aligned to TMREhalf-min, corresponding with TMRE redistribution from mitochondria into cytoplasm. D, Comparison of the timing at which cytoGCaMP reaches half-maximal intensity relative to TMREhalf-min as they occur within the same cells. Error bars indicate SEM; n = 10 from >3 experimental runs.
Modulation of [Ca2+]i alters aminoglycoside toxicity
We next sought to determine how directly modulating [Ca2+]i affects aminoglycoside-induced toxicity. To do so without disrupting hair cell development or function, we injected caged modulators of [Ca2+]i. These modulators remain inactive until exposed to UV light. Caged compounds were injected at the one cell stage; at 5 dpf, we confirmed that they modulate [Ca2+]i within hair cells. Caged EGTA preloaded with Ca2+ was used as a Ca2+ release agent (Ellis-Davies et al., 1996; Ellis-Davies and Barsotti, 2006) to artificially elevate [Ca2+]i within hair cells. Conversely, the caged Ca2+ chelator diazo2 (Zucker, 1994) was used to artificially depress [Ca2+]i within hair cells. Ultraviolet exposure of hair cells containing caged EGTA caused cytoGCaMP fluorescence to increase ∼30% above baseline within 1 min (Fig. 8A,B). Introduction of inactive caged compound or exposure to UV light alone had no effect on cytoGCaMP fluorescence (Fig. 8A) or susceptibility to neomycin (Fig. 9A). Activation of caged EGTA had two important results, also shown in Figure 9A. First, as expected, elevation of [Ca2+]i, even in the absence of neomycin, was moderately toxic to hair cells, resulting in the death of ∼25% of the hair cells in each neuromast. Second, activation of caged EGTA before neomycin treatment resulted in ∼30% increased hair cell death across all neomycin concentrations assayed (p < 0.0001; two-way ANOVA). These data indicate that relatively moderate increases in [Ca2+]i can be toxic to hair cells and that elevated [Ca2+]i sensitizes hair cells to the toxic effects of aminoglycoside exposure.
Figure 9.

Ca2+ modulation alters toxicity of aminoglycoside antibiotics. A, B, Lateral line hair cell survival after injection and activation of caged EGTA preloaded with Ca2+ (A) or the caged Ca2+ chelator diazo2 (B) after exposure to increasing concentrations of neomycin. Hair cell counts are of parvalbumin-positive hair cells. Error bars indicate SD; n = 6 neuromasts from each of five treated larvae. *p < 0.05 (two-way ANOVA, Tukey post-test). ***p < 0.0001 (two-way ANOVA, Tukey post-test). C, Hair cells of 5 dpf zebrafish larvae stained with antisera against parvalbumin after UV activation of the caged Ca2+ chelator diazo-2 and exposure to 200 μm neomycin. Lateral views of the zebrafish lateral line system under low magnification (10× magnification). Red clusters (such as the one labeled in the box) label anterior lateral line neuromasts. The anterior of the zebrafish larvae faces left. High-magnification (63× magnification) views are of boxed neuromasts. Lateral and apical views are indicated. Experimental treatments are as indicated.
In contrast, artificially depressing [Ca2+]i protected hair cells from damage by aminoglycosides. Exposure of hair cells with caged diazo2 to UV light decreased cytoGCaMP fluorescence 0.3-fold below baseline within 1 min after UV exposure (Fig. 8B), confirming that activation chelates Ca2+. Activation of caged diazo2 before neomycin exposure reduced neomycin-induced hair cell death across all concentrations assayed (Fig. 9B,C). The most robust protection occurred at neomycin concentrations >100 μm (p < 0.0001; two-way ANOVA). Neither UV light alone nor caged (inactive) compound had an effect on cytoGCaMP fluorescence (Fig. 8B) or hair cell number, either alone or in the presence of neomycin (Fig. 9B,C). Although we cannot directly compare cytoGCaMP fluorescence after uncaging with hair cell survival, they confirm that these caged modulators are capable of altering [Ca2+]i after UV exposure.
Ca2+ proteins promote aminoglycoside-induced hair cell death
Initiation of Ca2+-dependent responses frequently relies upon the activation of Ca2+ effectors within a cell. Of these, calmodulin is perhaps the most common and well characterized. Because it can mount both pro-survival and pro-cell death responses during Ca2+-induced cytotoxicity (Clapham, 2007), we sought to determine whether calmodulin inhibition influenced aminoglycoside toxicity in a manner consistent with that seen by diazo2 activation. Coadministration of neomycin with A-7 or W-7, specific pharmacological inhibitors of calmodulin (Hidaka and Tanaka, 1983; Itoh and Hidaka, 1984), reduced hair cell death across all concentrations of neomycin exposure (p < 0.0001; two-way ANOVA; Fig. 10B). A-7 and W-7 afforded the most protection against hair cell death at neomycin concentrations >100 μm, where hair cell numbers were ∼60% greater than in the presence of neomycin alone. Together, these data suggest that calmodulin does not activate pro-cell survival responses in response to elevated [Ca2+]i; instead, they are consistent with a pro-cell death role of [Ca2+]i during aminoglycoside-induced hair cell death.
In its role as an orchestrator of cell death, Ca2+ also activates a number of proteins involved in cellular degradation. These include calpains, a family of cysteine proteases that are nonlysosomal in origin (Goll et al., 2003). The rise in [Ca2+]i observed during hair cell death raised the possibility that aminoglycoside exposure promotes the activity of Ca2+-activated proteases. To evaluate this possibility, we examined aminoglycoside toxicity in the presence of leupeptin, a broad-spectrum cysteine protease inhibitor (Wang, 1990). Coadministration of neomycin with leupeptin abrogated hair cell death by ∼40% across multiple concentrations of neomycin (p < 0.0001; two-way ANOVA; Fig. 11), resembling the protection observed in mammalian hair cells in vitro with gentamicin treatment (Ding et al., 2002; Shimizu et al., 2003; Momiyama et al., 2006). Together, these results suggest that Ca2+ effectors act downstream of the [Ca2+]i elevation we observed in dying hair cells exposed to aminoglycosides to promote cell death progression.
Discussion
Ca2+regulation is a key process in the life and death of a cell. Mechanisms involved in the control of [Ca2+]i homeostasis have been extensively studied, but longstanding challenges persist, particularly in validating in vitro studies in in vivo systems. Although transient changes in [Ca2+]cyt have been observed when in vitro cochlear hair cell preparations are exposed to aminoglycosides (Hirose et al., 1999; Matsui et al., 2004), technical limitations have prevented the precise establishment of the roles for [Ca2+]i in hair cell death. We generated transgenic zebrafish lines expressing hair cell-specific Ca2+ indicators that enable us to visualize [Ca2+]cyt dynamics during aminoglycoside-induced hair cell death in vivo. The highly reliable nature of the dose–response relationship between aminoglycoside exposure and degree of cell death in larval zebrafish neuromasts has allowed direct comparisons of [Ca2+]i homeostasis in cells destined to live and those destined to die within the same neuromast. Cytoplasmic GCaMP fluorescence in these conditions increases approximately threefold above baseline levels in dying cells. The activation of caged Ca2+ modulators within hair cells alters both [Ca2+]cyt and susceptibility to aminoglycoside toxicity, and we conclude that [Ca2+]i is important for both the initiation and progression of hair cell death induced by aminoglycosides.
Although our evidence appears to establish a role of [Ca2+]i in the death process, [Ca2+]cyt involvement in hair cell survival is far less clear. Low-level [Ca2+]cyt oscillations, such as the ones described here, are capable of encoding survival responses in other contexts (Rong and Distelhorst, 2008) and raise the possibility that a similar mechanism is instrumental here. Under the appropriate conditions, [Ca2+]cyt oscillations can initiate transcriptional activation of stress response genes (Miyawaki et al., 1996; Oukka et al., 1998; Randriamampita et al., 2003; White et al., 2005; Zhong et al., 2006), inhibition of membrane channels (Umemiya et al., 2001; Reidl et al., 2006), and inhibit Ca2+ movement within the cell (Politi et al., 2006; Matsu-ura et al., 2006). All of these responses seem a plausible strategy for mounting aminoglycoside resistance within hair cells. However, the oscillations we describe here were not distinguishable in frequency or magnitude from those in untreated hair cells, which prevents us from attributing protective effects to low-level [Ca2+]cyt fluctuations. Although we were capable of detecting [Ca2+]cyt as low as 70 nm, more sensitive genetically encoded Ca2+ indicators may be necessary to delve further into this issue. It is possible that future members of the GCaMP family will prove useful in this regard.
Analysis of GCaMP fluorescence in hair cells treated with ionomycin demonstrates that cytoGCaMP in vivo is responsive in range from ∼100 nm to 2 μm extracellular [Ca2+] after initial ionomycin exposure in 1 nm extracellular Ca2+/EGTA. Sensitivity ranges presented here differ from those observed with purified GCaMP3, with detection limits at ∼160 nm and saturation at 1 μm free Ca2+ (Tian et al., 2009). Similarly, maximal fluorescence changes of cytoGCaMP were half those of purified GCaMP3 (Tian et al., 2009). Such differences may be attributable to those inherent in an intact biological organism. Multiple factors are likely to alter the intracellular exposure of cytoGCaMP within hair cells to our calibration media, including the gelatinous cupula on the apical surface of lateral line hair cells that is thought to regulate external [Ca2+] (Russell and Sellick, 1976). For these reasons, we are cautious about estimating the absolute levels of [Ca2+]i changes after ionomycin treatment as we do not know the actual extracellular [Ca2+] to which hair cells are exposed. Similarly, we are not able to accurately estimate the absolute levels of [Ca2+]i changes after aminoglycoside exposure.
Contribution of extracellular Ca2+ during hair cell death
Ca2+-mediated signal transduction is a common means of initiating cellular processes in response to stimuli. This has been observed in many systems, where transient extracellular and intercellular Ca2+ waves spread quickly over a short distance to surrounding cells (Hofer and Lefkimmiatis, 2007; Decrock et al., 2011). Both mechanical and drug-induced stimuli elicit intercellular Ca2+ waves from cochlear support cells in vitro and activate stress pathways in a manner dependent upon stimulus amplitude and [Ca2+]i handling capabilities of the insulted cell (Piazza et al., 2007; Lahne and Gale, 2008; Mann et al., 2009; Lahne and Gale, 2010).
Although there exists no direct evidence of extracellular Ca2+ release by support cells, one intriguing possibility to explain the Ca2+ spikes we observe during hair cell death is that they originate within support cells and enter hair cells upon channel activation. Voltage-gated Ca2+ channels are primarily responsible for Ca2+ influx across the plasma membrane. Because of their slow inactivation kinetics and [Ca2+]i regulation during neuronal excitotoxicity, L-type (Cav1) voltage-gated Ca2+ channels are often regarded as the best candidates for regulating Ca2+ influx during aminoglycoside-induced hair cell death (Lipscombe et al., 2004; Ali et al., 2011). Inhibition of Ca2+ influx/efflux machinery brings with it an additional level of complexity. L-type Ca2+ channel blockers, such as nifedipine and verapamil, also inhibit mechanotransduction (Jorgensen, 1983; Baumann and Roth, 1986; Jorgensen and Kroese, 1995) and therefore aminoglycoside uptake and toxicity (Alharazneh et al., 2011), making it difficult to efficiently separate Ca2+ entry in this manner from aminoglycoside-induced hair cell death.
In the kidney, another aminoglycoside-sensitive tissue, pharmacological inhibitors of L-type Ca2+ channels have yielded mixed results in protection against aminoglycoside exposure. Modest protection against nephrotoxicity is afforded in the presence of some blockers, whereas others potentiate toxicity (Li et al., 2009). The protective effects of these drugs have largely been attributed to antioxidant properties unrelated to their role in Ca2+ regulation (Berkels et al., 2005; Ali et al., 2011). The contribution of extracellular Ca2+ to cell death after aminoglycoside exposure remains unclear.
Disruption of [Ca2+]cyt homeostasis during hair cell death
There is ample evidence linking disruptions in [Ca2+]i homeostasis with hair cell death. For example, the plasma membrane Ca2+ ATPase isoform 2 (PMCA2) is defective is some cases of human or murine sensorineural hearing loss (Street et al., 1998; Penheiter et al., 2001; McCullough and Tempel, 2004; Schultz et al., 2005; Carafoli, 2011; Giacomello et al., 2011; Mammano, 2011; Giacomello et al., 2012). Extensive hair cell death is observed in mice carrying mutant alleles of PMCA2, which lack the ability to efficiently extrude Ca2+ from the cytoplasm of hair cells (Dumont et al., 2001; Penheiter et al., 2001; Spiden et al., 2008; Bortolozzi et al., 2010). These data are consistent with our observations that elevated [Ca2+]i alone is sufficient to induce hair cell death.
Dysregulation of [Ca2+]i homeostasis has been implicated in cell death in a large number of neural conditions, including neurotrophin withdrawal (Franklin and Johnson, 1992; De Bernardi et al., 1996; Soler et al., 1998; Perez-Garcia et al., 2004; Perez-Garcia et al., 2008), excitotoxicity (Bading et al., 1993; Lerea and McNamara, 1993; Sattler et al., 1998; Szydlowska and Tymianski, 2010), and afferent deprivation during development (Zirpel et al., 1995, 1998; Zirpel and Rubel, 1996). The occurrence of a short, high intensity peak of [Ca2+]cyt in dying hair cells is also observed in neurons shortly after mitochondrial potential collapse (Nicholls et al., 1999; Nicholls and Budd, 2000). This subcellular Ca2+ increase is termed delayed Ca2+ deregulation (Nicholls and Budd, 2000), and such [Ca2+]cyt changes are capable of activating serine proteases, such as calpain (Moldoveanu et al., 2002), resulting in the degredation of dying cells. Calpains can be activated through other means, and some of these, such as phospholipid binding (Leloup et al., 2010), are also known targets of aminoglycoside interaction (Orsulakova et al., 1976; Schacht et al., 1977; Wang et al., 1984a, 1984b; Goodyear et al., 2008). Elevated [Ca2+]cyt within dying cells would, however, argue that delayed Ca2+ deregulation is at least a partial mechanism for their activation.
Despite the reduction of aminoglycoside-induced hair cell toxicity when [Ca2+]i is artificially reduced or Ca2+ effectors are compromised, such protection is incomplete. Although the disruption of [Ca2+]cyt appears to be one causative factor underlying aminoglycoside cytotoxicity, there are undoubtedly other subcellular events occurring during hair cell death that contribute to this process. Other events that promote cell death, such as ROS production, have been observed in inner ear hair cell explants after aminoglycoside exposure (Conlon and Smith, 1998; Hirose et al., 1999; Wei et al., 2005). It is tempting to speculate that ROS and elevated [Ca2+]cyt are combinatorial in nature and converge upon a common mechanism of cell death progression. If so, such events would lend in vivo support to the two-hit model of [Ca2+]i-induced cell death originally proposed by Hajnoczky and colleagues (Szalai et al., 1999), whereby elevated [Ca2+]i sensitizes the cell to other damaging events that, when combined, trigger death.
Ototoxicity is a side effect associated with many therapeutic agents (Ou et al., 2010; Warchol, 2010; Cianfrone et al., 2011; Audo and Warchol, 2012; Ou et al., 2012). It will be interesting to determine whether [Ca2+]i responses to these ototoxic agents are conserved. Understanding the details of [Ca2+]i regulation and mobilization may help in the design of drugs that avoid the ototoxicity seen in clinical uses of therapeutics.
Footnotes
This work was supported by NIDCD Grant DC05987 and NRSA Grants DC012244, DC010940, and DC99312. We thank Kay Williamson and Tor Linbo for technical assistance and Dave White for fish care.
The authors declare no competing financial interests.
References
- Akerboom J, Chen TW, Wardill TJ, Tian L, Marvin JS, Mutlu S, Calderon NC, Esposti F, Borghuis BG, Sun XR, Gordus A, Orger MB, Portugues R, Engert F, Macklin JJ, Filosa A, Aggarwal A, Kerr RA, Takagi R, Kracun S, et al. Optimization of a GCaMP calcium indicator for neural activity imaging. J Neurosci. 2012;32:13819–13840. doi: 10.1523/JNEUROSCI.2601-12.2012. [DOI] [PMC free article] [PubMed] [Google Scholar]
- Alharazneh A, Luk L, Huth M, Monfared A, Steyger PS, Cheng AG, Ricci AJ. Functional hair cell mechanotransducer channels are required for aminoglycoside ototoxicity. PLoS One. 2011;6:e22347. doi: 10.1371/journal.pone.0022347. [DOI] [PMC free article] [PubMed] [Google Scholar]
- Ali BH, Al Za'abi M, Blunden G, Nemmar A. Experimental gentamicin nephrotoxicity and agents that modify it: a mini-review of recent research. Basic Clin Pharmacol Toxicol. 2011;109:225–232. doi: 10.1111/j.1742-7843.2011.00728.x. [DOI] [PubMed] [Google Scholar]
- Amr S, Heisey C, Zhang M, Xia XJ, Shows KH, Ajlouni K, Pandya A, Satin LS, El-Shanti H, Shiang R. A homozygous mutation in a novel zinc-finger protein, ERIS, is responsible for Wolfram syndrome 2. Am J Hum Genet. 2007;81:673–683. doi: 10.1086/520961. [DOI] [PMC free article] [PubMed] [Google Scholar]
- Audo I, Warchol ME. Retinal and cochlear toxicity of drugs: new insights into mechanisms and detection. Curr Opin Neurol. 2012;25:76–85. doi: 10.1097/WCO.0b013e32834ed882. [DOI] [PubMed] [Google Scholar]
- Bading H, Ginty DD, Greenberg ME. Regulation of gene expression in hippocampal neurons by distinct calcium signaling pathways. Science. 1993;260:181–186. doi: 10.1126/science.8097060. [DOI] [PubMed] [Google Scholar]
- Baird RA, Steyger PS, Schuff NR. Intracellular distributions and putative functions of calcium-binding proteins in the bullfrog vestibular otolith organs. Hear Res. 1997;103:85–100. doi: 10.1016/S0378-5955(96)00167-0. [DOI] [PubMed] [Google Scholar]
- Baumann M, Roth A. The Ca++ permeability of the apical membrane in neuromast hair cells. J Comp Physiol A Neuroethol Sens Neural Behav Physiol. 1986;158:681–688. doi: 10.1007/BF00603825. [DOI] [PubMed] [Google Scholar]
- Berkels R, Breitenbach T, Bartels H, Taubert D, Rosenkranz A, Klaus W, Roesen R. Different antioxidative potencies of dihydropyridine calcium channel modulators in various models. Vascul Pharmacol. 2005;42:145–152. doi: 10.1016/j.vph.2004.11.003. [DOI] [PubMed] [Google Scholar]
- Bortolozzi M, Brini M, Parkinson N, Crispino G, Scimemi P, De Siati RD, Di Leva F, Parker A, Ortolano S, Arslan E, Brown SD, Carafoli E, Mammano F. The novel PMCA2 pump mutation Tommy impairs cytosolic calcium clearance in hair cells and links to deafness in mice. J Biol Chem. 2010;285:37693–37703. doi: 10.1074/jbc.M110.170092. [DOI] [PMC free article] [PubMed] [Google Scholar]
- Carafoli E. The plasma membrane calcium pump in the hearing process: physiology and pathology. Sci China Life Sci. 2011;54:686–690. doi: 10.1007/s11427-011-4200-z. [DOI] [PubMed] [Google Scholar]
- Cianfrone G, Pentangelo D, Cianfrone E, Mazzei F, Turchetta R, Orlando MP, Altissimi G. Pharmacological drugs inducing ototoxicity, vestibular symptoms and tinnitus: a reasoned and updated guide. Eur Rev Med Pharmacol Sci. 2011;15:601–636. [PubMed] [Google Scholar]
- Clapham DE. Calcium signaling. Cell. 2007;131:1047–1058. doi: 10.1016/j.cell.2007.11.028. [DOI] [PubMed] [Google Scholar]
- Coffin AB, Ou H, Owens KN, Santos F, Simon JA, Rubel EW, Raible DW. Chemical screening for hair cell loss and protection in the zebrafish lateral line. Zebrafish. 2010;7:3–11. doi: 10.1089/zeb.2009.0639. [DOI] [PMC free article] [PubMed] [Google Scholar]
- Conlon BJ, Smith DW. Supplemental iron exacerbates aminoglycoside ototoxicity in vivo. Hear Res. 1998;115:1–5. doi: 10.1016/S0378-5955(97)00171-8. [DOI] [PubMed] [Google Scholar]
- Cryns K, Sivakumaran TA, Van den Ouweland JM, Pennings RJ, Cremers CW, Flothmann K, Young TL, Smith RJ, Lesperance MM, Van Camp G. Mutational spectrum of the WFS1 gene in Wolfram syndrome, nonsyndromic hearing impairment, diabetes mellitus, and psychiatric disease. Hum Mutat. 2003;22:275–287. doi: 10.1002/humu.10258. [DOI] [PubMed] [Google Scholar]
- De Bernardi MA, Rabins SJ, Colangelo AM, Brooker G, Mocchetti I. TrkA mediates the nerve growth factor-induced intracellular calcium accumulation. J Biol Chem. 1996;271:6092–6098. doi: 10.1074/jbc.271.11.6092. [DOI] [PubMed] [Google Scholar]
- Decrock E, Vinken M, Bol M, D'Herde K, Rogiers V, Vandenabeele P, Krysko DV, Bultynck G, Leybaert L. Calcium and connexin-based intercellular communication, a deadly catch? Cell Calcium. 2011;50:310–321. doi: 10.1016/j.ceca.2011.05.007. [DOI] [PubMed] [Google Scholar]
- Dehne N, Rauen U, de Groot H, Lautermann J. Involvement of the mitochondrial permeability transition in gentamicin ototoxicity. Hear Res. 2002;169:47–55. doi: 10.1016/S0378-5955(02)00338-6. [DOI] [PubMed] [Google Scholar]
- Ding D, Stracher A, Salvi RJ. Leupeptin protects cochlear and vestibular hair cells from gentamicin ototoxicity. Hear Res. 2002;164:115–126. doi: 10.1016/S0378-5955(01)00417-8. [DOI] [PubMed] [Google Scholar]
- Dumont RA, Lins U, Filoteo AG, Penniston JT, Kachar B, Gillespie PG. Plasma membrane Ca2+-ATPase isoform 2a is the PMCA of hair bundles. J Neurosci. 2001;21:5066–5078. doi: 10.1523/JNEUROSCI.21-14-05066.2001. [DOI] [PMC free article] [PubMed] [Google Scholar]
- Eisen MD, Ryugo DK. Hearing molecules: contributions from genetic deafness. Cell Mol Life Sci. 2007;64:566–580. doi: 10.1007/s00018-007-6417-3. [DOI] [PMC free article] [PubMed] [Google Scholar]
- Ellis-Davies GC, Barsotti RJ. Tuning caged calcium: photolabile analogues of EGTA with improved optical and chelation properties. Cell Calcium. 2006;39:75–83. doi: 10.1016/j.ceca.2005.10.003. [DOI] [PubMed] [Google Scholar]
- Ellis-Davies GC, Kaplan JH, Barsotti RJ. Laser photolysis of caged calcium: rates of calcium release by nitrophenyl-EGTA and DM-nitrophen. Biophys J. 1996;70:1006–1016. doi: 10.1016/S0006-3495(96)79644-3. [DOI] [PMC free article] [PubMed] [Google Scholar]
- Franklin JL, Johnson EM., Jr Suppression of programmed neuronal death by sustained elevation of cytoplasmic calcium. Trends Neurosci. 1992;15:501–508. doi: 10.1016/0166-2236(92)90103-F. [DOI] [PubMed] [Google Scholar]
- Giacomello M, De Mario A, Lopreiato R, Primerano S, Campeol M, Brini M, Carafoli E. Mutations in PMCA2 and hereditary deafness: a molecular analysis of the pump defect. Cell Calcium. 2011;50:569–576. doi: 10.1016/j.ceca.2011.09.004. [DOI] [PubMed] [Google Scholar]
- Giacomello M, De Mario A, Primerano S, Brini M, Carafoli E. Hair cells, plasma membrane Ca(2) (+) ATPase and deafness. Int J Biochem Cell Biol. 2012;44:679–683. doi: 10.1016/j.biocel.2012.02.006. [DOI] [PubMed] [Google Scholar]
- Gillespie PG, Müller U. Mechanotransduction by hair cells: models, molecules, and mechanisms. Cell. 2009;139:33–44. doi: 10.1016/j.cell.2009.09.010. [DOI] [PMC free article] [PubMed] [Google Scholar]
- Giorgi C, Baldassari F, Bononi A, Bonora M, De Marchi E, Marchi S, Missiroli S, Patergnani S, Rimessi A, Suski JM, Wieckowski MR, Pinton P. Mitochondrial Ca(2+) and apoptosis. Cell Calcium. 2012;52:36–43. doi: 10.1016/j.ceca.2012.02.008. [DOI] [PMC free article] [PubMed] [Google Scholar]
- Goll DE, Thompson VF, Li H, Wei W, Cong J. The calpain system. Physiol Rev. 2003;83:731–801. doi: 10.1152/physrev.00029.2002. [DOI] [PubMed] [Google Scholar]
- Goodyear RJ, Gale JE, Ranatunga KM, Kros CJ, Richardson GP. Aminoglycoside-induced phosphatidylserine externalization in sensory hair cells is regionally restricted, rapid, and reversible. J Neurosci. 2008;28:9939–9952. doi: 10.1523/JNEUROSCI.1124-08.2008. [DOI] [PMC free article] [PubMed] [Google Scholar]
- Hackney CM, Mahendrasingam S, Jones EM, Fettiplace R. The distribution of calcium buffering proteins in the turtle cochlea. J Neurosci. 2003;23:4577–4589. doi: 10.1523/JNEUROSCI.23-11-04577.2003. [DOI] [PMC free article] [PubMed] [Google Scholar]
- Hackney CM, Mahendrasingam S, Penn A, Fettiplace R. The concentrations of calcium buffering proteins in mammalian cochlear hair cells. J Neurosci. 2005;25:7867–7875. doi: 10.1523/JNEUROSCI.1196-05.2005. [DOI] [PMC free article] [PubMed] [Google Scholar]
- Harr MW, Distelhorst CW. Apoptosis and autophagy: decoding calcium signals that mediate life or death. Cold Spring Harb Perspect Biol. 2010;2:a005579. doi: 10.1101/cshperspect.a005579. [DOI] [PMC free article] [PubMed] [Google Scholar]
- Harris JA, Cheng AG, Cunningham LL, MacDonald G, Raible DW, Rubel EW. Neomycin-induced hair cell death and rapid regeneration in the lateral line of zebrafish (Danio rerio) J Assoc Res Otolaryngol. 2003;4:219–234. doi: 10.1007/s10162-002-3022-x. [DOI] [PMC free article] [PubMed] [Google Scholar]
- Hidaka H, Tanaka T. Naphthalenesulfonamides as calmodulin antagonists. Methods Enzymol. 1983;102:185–194. doi: 10.1016/S0076-6879(83)02019-4. [DOI] [PubMed] [Google Scholar]
- Hirose K, Westrum LE, Stone JS, Zirpel L, Rubel EW. Dynamic studies of ototoxicity in mature avian auditory epithelium. Ann N Y Acad Sci. 1999;884:389–409. doi: 10.1111/j.1749-6632.1999.tb08657.x. [DOI] [PubMed] [Google Scholar]
- Hobbie SN, Akshay S, Kalapala SK, Bruell CM, Shcherbakov D, Böttger EC. Genetic analysis of interactions with eukaryotic rRNA identify the mitoribosome as target in aminoglycoside ototoxicity. Proc Natl Acad Sci U S A. 2008;105:20888–20893. doi: 10.1073/pnas.0811258106. [DOI] [PMC free article] [PubMed] [Google Scholar]
- Hofer AM, Lefkimmiatis K. Extracellular calcium and cAMP: second messengers as “third messengers?”. Physiology (Bethesda) 2007;22:320–327. doi: 10.1152/physiol.00019.2007. [DOI] [PubMed] [Google Scholar]
- Itoh H, Hidaka H. Direct interaction of calmodulin antagonists with Ca2+/calmodulin-dependent cyclic nucleotide phosphodiesterase. J Biochem. 1984;96:1721–1726. doi: 10.1093/oxfordjournals.jbchem.a135004. [DOI] [PubMed] [Google Scholar]
- Jaalouk DE, Lammerding J. Mechanotransduction gone awry. Nat Rev Mol Cell Biol. 2009;10:63–73. doi: 10.1038/nrm2597. [DOI] [PMC free article] [PubMed] [Google Scholar]
- Jensen-Smith HC, Hallworth R, Nichols MG. Gentamicin rapidly inhibits mitochondrial metabolism in high-frequency cochlear outer hair cells. PLoS One. 2012;7:e38471. doi: 10.1371/journal.pone.0038471. [DOI] [PMC free article] [PubMed] [Google Scholar]
- Jørgensen F. Influence of Ca2+ on the mechanosensitivity of the hair cells in the lateral line organs of Necturus maculosus. Acta Physiol Scand. 1983;118:423–431. doi: 10.1111/j.1748-1716.1983.tb07292.x. [DOI] [PubMed] [Google Scholar]
- Jørgensen F, Kroese AB. Ca selectivity of the transduction channels in the hair cells of the frog sacculus. Acta Physiol Scand. 1995;155:363–376. doi: 10.1111/j.1748-1716.1995.tb09986.x. [DOI] [PubMed] [Google Scholar]
- Kaiser N, Edelman IS. Calcium dependence of glucocorticoid-induced lymphocytolysis. Proc Natl Acad Sci U S A. 1977;74:638–642. doi: 10.1073/pnas.74.2.638. [DOI] [PMC free article] [PubMed] [Google Scholar]
- Lahne M, Gale JE. Damage-induced activation of ERK1/2 in cochlear supporting cells is a hair cell death-promoting signal that depends on extracellular ATP and calcium. J Neurosci. 2008;28:4918–4928. doi: 10.1523/JNEUROSCI.4914-07.2008. [DOI] [PMC free article] [PubMed] [Google Scholar]
- Lahne M, Gale JE. Damage-induced cell–cell communication in different cochlear cell types via two distinct ATP-dependent Ca waves. Purinergic Signal. 2010;6:189–200. doi: 10.1007/s11302-010-9193-8. [DOI] [PMC free article] [PubMed] [Google Scholar]
- Leloup L, Shao H, Bae YH, Deasy B, Stolz D, Roy P, Wells A. m-Calpain activation is regulated by its membrane localization and by its binding to phosphatidylinositol 4,5-bisphosphate. J Biol Chem. 2010;285:33549–33566. doi: 10.1074/jbc.M110.123604. [DOI] [PMC free article] [PubMed] [Google Scholar]
- LeMasurier M, Gillespie PG. Hair-cell mechanotransduction and cochlear amplification. Neuron. 2005;48:403–415. doi: 10.1016/j.neuron.2005.10.017. [DOI] [PubMed] [Google Scholar]
- Lerea LS, McNamara JO. Ionotropic glutamate receptor subtypes activate c-fos transcription by distinct calcium-requiring intracellular signaling pathways. Neuron. 1993;10:31–41. doi: 10.1016/0896-6273(93)90239-N. [DOI] [PubMed] [Google Scholar]
- Leung CF, Miller AL, Korzh V, Chong SW, Sleptsova-Freidrich I, Webb SE. Visualization of stochastic Ca2+ signals in the formed somites during the early segmentation period in intact, normally developing zebrafish embryos. Dev Growth Differ. 2009;51:617–637. doi: 10.1111/j.1440-169X.2009.01123.x. [DOI] [PubMed] [Google Scholar]
- Li J, Li QX, Xie XF, Ao Y, Tie CR, Song RJ. Differential roles of dihydropyridine calcium antagonist nifedipine, nitrendipine and amlodipine on gentamicin-induced renal tubular toxicity in rats. Eur J Pharmacol. 2009;620:97–104. doi: 10.1016/j.ejphar.2009.08.021. [DOI] [PubMed] [Google Scholar]
- Lipscombe D, Helton TD, Xu W. L-type calcium channels: the low down. J Neurophysiol. 2004;92:2633–2641. doi: 10.1152/jn.00486.2004. [DOI] [PubMed] [Google Scholar]
- Mammano F. Ca2+ homeostasis defects and hereditary hearing loss. Biofactors. 2011;37:182–188. doi: 10.1002/biof.150. [DOI] [PubMed] [Google Scholar]
- Mann ZF, Duchen MR, Gale JE. Mitochondria modulate the spatio-temporal properties of intra- and intercellular Ca2+ signals in cochlear supporting cells. Cell Calcium. 2009;46:136–146. doi: 10.1016/j.ceca.2009.06.005. [DOI] [PubMed] [Google Scholar]
- Matsui JI, Gale JE, Warchol ME. Critical signaling events during the aminoglycoside-induced death of sensory hair cells in vitro. J Neurobiol. 2004;61:250–266. doi: 10.1002/neu.20054. [DOI] [PubMed] [Google Scholar]
- Matsu-ura T, Michikawa T, Inoue T, Miyawaki A, Yoshida M, Mikoshiba K. Cytosolic inositol 1,4,5-trisphosphate dynamics during intracellular calcium oscillations in living cells. J Cell Biol. 2006;173:755–765. doi: 10.1083/jcb.200512141. [DOI] [PMC free article] [PubMed] [Google Scholar]
- McCullough BJ, Tempel BL. Haplo-insufficiency revealed in deafwaddler mice when tested for hearing loss and ataxia. Hear Res. 2004;195:90–102. doi: 10.1016/j.heares.2004.05.003. [DOI] [PubMed] [Google Scholar]
- Miyawaki H, Zhou X, Ashraf M. Calcium preconditioning elicits strong protection against ischemic injury via protein kinase C signaling pathway. Circ Res. 1996;79:137–146. doi: 10.1161/01.RES.79.1.137. [DOI] [PubMed] [Google Scholar]
- Moldoveanu T, Hosfield CM, Lim D, Elce JS, Jia Z, Davies PL. A Ca(2+) switch aligns the active site of calpain. Cell. 2002;108:649–660. doi: 10.1016/S0092-8674(02)00659-1. [DOI] [PubMed] [Google Scholar]
- Momiyama J, Hashimoto T, Matsubara A, Futai K, Namba A, Shinkawa H. Leupeptin, a calpain inhibitor, protects inner ear hair cells from aminoglycoside ototoxicity. Tohoku J Exp Med. 2006;209:89–97. doi: 10.1620/tjem.209.89. [DOI] [PubMed] [Google Scholar]
- Nicholls DG, Budd SL. Mitochondria and neuronal survival. Physiol Rev. 2000;80:315–360. doi: 10.1152/physrev.2000.80.1.315. [DOI] [PubMed] [Google Scholar]
- Nicholls DG, Budd SL, Ward MW, Castilho RF. Excitotoxicity and mitochondria. Biochem Soc Symp. 1999;66:55–67. doi: 10.1042/bss0660055. [DOI] [PubMed] [Google Scholar]
- Obholzer N, Wolfson S, Trapani JG, Mo W, Nechiporuk A, Busch-Nentwich E, Seiler C, Sidi S, Söllner C, Duncan RN, Boehland A, Nicolson T. Vesicular glutamate transporter 3 is required for synaptic transmission in zebrafish hair cells. J Neurosci. 2008;28:2110–2118. doi: 10.1523/JNEUROSCI.5230-07.2008. [DOI] [PMC free article] [PubMed] [Google Scholar]
- Orrenius S, Zhivotovsky B, Nicotera P. Regulation of cell death: the calcium-apoptosis link. Nat Rev Mol Cell Biol. 2003;4:552–565. doi: 10.1038/nrm1150. [DOI] [PubMed] [Google Scholar]
- Orsulakova A, Stockhorst E, Schacht J. Effect of neomycin on phosphoinositide labelling and calcium binding in guinea-pig inner ear tissues in vivo and in vitro. J Neurochem. 1976;26:285–290. doi: 10.1111/j.1471-4159.1976.tb04478.x. [DOI] [PubMed] [Google Scholar]
- Osman AA, Saito M, Makepeace C, Permutt MA, Schlesinger P, Mueckler M. Wolframin expression induces novel ion channel activity in endoplasmic reticulum membranes and increases intracellular calcium. J Biol Chem. 2003;278:52755–52762. doi: 10.1074/jbc.M310331200. [DOI] [PubMed] [Google Scholar]
- Ou HC, Santos F, Raible DW, Simon JA, Rubel EW. Drug screening for hearing loss: using the zebrafish lateral line to screen for drugs that prevent and cause hearing loss. Drug Discov Today. 2010;15:265–271. doi: 10.1016/j.drudis.2010.01.001. [DOI] [PMC free article] [PubMed] [Google Scholar]
- Ou H, Simon JA, Rubel EW, Raible DW. Screening for chemicals that affect hair cell death and survival in the zebrafish lateral line. Hear Res. 2012;288:58–66. doi: 10.1016/j.heares.2012.01.009. [DOI] [PMC free article] [PubMed] [Google Scholar]
- Oukka M, Ho IC, de la Brousse FC, Hoey T, Grusby MJ, Glimcher LH. The transcription factor NFAT4 is involved in the generation and survival of T cells. Immunity. 1998;9:295–304. doi: 10.1016/S1074-7613(00)80612-3. [DOI] [PubMed] [Google Scholar]
- Owens KN, Cunningham DE, MacDonald G, Rubel EW, Raible DW, Pujol R. Ultrastructural analysis of aminoglycoside-induced hair cell death in the zebrafish lateral line reveals an early mitochondrial response. J Comp Neurol. 2007;502:522–543. doi: 10.1002/cne.21345. [DOI] [PubMed] [Google Scholar]
- Penheiter AR, Filoteo AG, Croy CL, Penniston JT. Characterization of the deafwaddler mutant of the rat plasma membrane calcium-ATPase 2. Hear Res. 2001;162:19–28. doi: 10.1016/S0378-5955(01)00356-2. [DOI] [PubMed] [Google Scholar]
- Pérez-García MJ, Ceña V, de Pablo Y, Llovera M, Comella JX, Soler RM. Glial cell line-derived neurotrophic factor increases intracellular calcium concentration: role of calcium/calmodulin in the activation of the phosphatidylinositol 3-kinase pathway. J Biol Chem. 2004;279:6132–6142. doi: 10.1074/jbc.M308367200. [DOI] [PubMed] [Google Scholar]
- Pérez-García MJ, Gou-Fabregas M, de Pablo Y, Llovera M, Comella JX, Soler RM. Neuroprotection by neurotrophic factors and membrane depolarization is regulated by calmodulin kinase IV. J Biol Chem. 2008;283:4133–4144. doi: 10.1074/jbc.M705477200. [DOI] [PubMed] [Google Scholar]
- Piazza V, Ciubotaru CD, Gale JE, Mammano F. Purinergic signalling and intercellular Ca2+ wave propagation in the organ of Corti. Cell Calcium. 2007;41:77–86. doi: 10.1016/j.ceca.2006.05.005. [DOI] [PubMed] [Google Scholar]
- Pinton P, Giorgi C, Siviero R, Zecchini E, Rizzuto R. Calcium and apoptosis: ER-mitochondria Ca2+ transfer in the control of apoptosis. Oncogene. 2008;27:6407–6418. doi: 10.1038/onc.2008.308. [DOI] [PMC free article] [PubMed] [Google Scholar]
- Politi A, Gaspers LD, Thomas AP, Höfer T. Models of IP3 and Ca2+ oscillations: frequency encoding and identification of underlying feedbacks. Biophys J. 2006;90:3120–3133. doi: 10.1529/biophysj.105.072249. [DOI] [PMC free article] [PubMed] [Google Scholar]
- Rabié A, Thomasset M, Legrand C. Immunocytochemical detection of calcium-binding protein in the cochlear and vestibular hair cells of the rat. Cell Tissue Res. 1983;232:691–696. doi: 10.1007/BF00216440. [DOI] [PubMed] [Google Scholar]
- Raible DW, Kruse GJ. Organization of the lateral line system in embryonic zebrafish. J Comp Neurol. 2000;421:189–198. doi: 10.1002/(SICI)1096-9861(20000529)421:2<189::AID-CNE5>3.0.CO;2-K. [DOI] [PubMed] [Google Scholar]
- Randriamampita C, Boulla G, Revy P, Lemaitre F, Trautmann A. T cell adhesion lowers the threshold for antigen detection. Eur J Immunol. 2003;33:1215–1223. doi: 10.1002/eji.200323844. [DOI] [PubMed] [Google Scholar]
- Reidl J, Borowski P, Sensse A, Starke J, Zapotocky M, Eiswirth M. Model of calcium oscillations due to negative feedback in olfactory cilia. Biophys J. 2006;90:1147–1155. doi: 10.1529/biophysj.104.058545. [DOI] [PMC free article] [PubMed] [Google Scholar]
- Rong Y, Distelhorst CW. Bcl-2 protein family members: versatile regulators of calcium signaling in cell survival and apoptosis. Annu Rev Physiol. 2008;70:73–91. doi: 10.1146/annurev.physiol.70.021507.105852. [DOI] [PubMed] [Google Scholar]
- Russell IJ, Sellick PM. Measurement of potassium and chloride ion concentrations in the cupulae of the lateral lines of Xenopus laevis. J Physiol. 1976;257:245–255. doi: 10.1113/jphysiol.1976.sp011366. [DOI] [PMC free article] [PubMed] [Google Scholar]
- Sattler R, Charlton MP, Hafner M, Tymianski M. Distinct influx pathways, not calcium load, determine neuronal vulnerability to calcium neurotoxicity. J Neurochem. 1998;71:2349–2364. doi: 10.1046/j.1471-4159.1998.71062349.x. [DOI] [PubMed] [Google Scholar]
- Schacht J, Lodhi S, Weiner ND. Effects of neomycin on polyphosphoinositides in inner ear tissues and monomolecular films. Adv Exp Med Biol. 1977;84:191–208. doi: 10.1007/978-1-4684-3279-4_9. [DOI] [PubMed] [Google Scholar]
- Schanne FA, Kane AB, Young EE, Farber JL. Calcium dependence of toxic cell death: a final common pathway. Science. 1979;206:700–702. doi: 10.1126/science.386513. [DOI] [PubMed] [Google Scholar]
- Schultz JM, Yang Y, Caride AJ, Filoteo AG, Penheiter AR, Lagziel A, Morell RJ, Mohiddin SA, Fananapazir L, Madeo AC, Penniston JT, Griffith AJ. Modification of human hearing loss by plasma-membrane calcium pump PMCA2. N Engl J Med. 2005;352:1557–1564. doi: 10.1056/NEJMoa043899. [DOI] [PubMed] [Google Scholar]
- Shimizu A, Takumida M, Anniko M, Suzuki M. Calpain and caspase inhibitors protect vestibular sensory cells from gentamicin ototoxicity. Acta Otolaryngol. 2003;123:459–465. doi: 10.1080/00016480310001312. [DOI] [PubMed] [Google Scholar]
- Soler RM, Egea J, Mintenig GM, Sanz-Rodriguez C, Iglesias M, Comella JX. Calmodulin is involved in membrane depolarization-mediated survival of motoneurons by phosphatidylinositol-3 kinase- and MAPK-independent pathways. J Neurosci. 1998;18:1230–1239. doi: 10.1523/JNEUROSCI.18-04-01230.1998. [DOI] [PMC free article] [PubMed] [Google Scholar]
- Spiden SL, Bortolozzi M, Di Leva F, de Angelis MH, Fuchs H, Lim D, Ortolano S, Ingham NJ, Brini M, Carafoli E, Mammano F, Steel KP. The novel mouse mutation Oblivion inactivates the PMCA2 pump and causes progressive hearing loss. PLoS Genet. 2008;4:e1000238. doi: 10.1371/journal.pgen.1000238. [DOI] [PMC free article] [PubMed] [Google Scholar]
- Steyger PS, Burton M, Hawkins JR, Schuff NR, Baird RA. Calbindin and parvalbumin are early markers of non-mitotically regenerating hair cells in the bullfrog vestibular otolith organs. Int J Dev Neurosci. 1997;15:417–432. doi: 10.1016/S0736-5748(96)00101-3. [DOI] [PubMed] [Google Scholar]
- Street VA, McKee-Johnson JW, Fonseca RC, Tempel BL, Noben-Trauth K. Mutations in a plasma membrane Ca2+-ATPase gene cause deafness in deafwaddler mice. Nat Genet. 1998;19:390–394. doi: 10.1038/1284. [DOI] [PubMed] [Google Scholar]
- Szalai G, Krishnamurthy R, Hajnóczky G. Apoptosis driven by IP(3)-linked mitochondrial calcium signals. EMBO J. 1999;18:6349–6361. doi: 10.1093/emboj/18.22.6349. [DOI] [PMC free article] [PubMed] [Google Scholar]
- Szydlowska K, Tymianski M. Calcium, ischemia and excitotoxicity. Cell Calcium. 2010;47:122–129. doi: 10.1016/j.ceca.2010.01.003. [DOI] [PubMed] [Google Scholar]
- Tian L, Hires SA, Mao T, Huber D, Chiappe ME, Chalasani SH, Petreanu L, Akerboom J, McKinney SA, Schreiter ER, Bargmann CI, Jayaraman V, Svoboda K, Looger LL. Imaging neural activity in worms, flies and mice with improved GCaMP calcium indicators. Nat Methods. 2009;6:875–881. doi: 10.1038/nmeth.1398. [DOI] [PMC free article] [PubMed] [Google Scholar]
- Tiede L, Steyger PS, Nichols MG, Hallworth R. Metabolic imaging of the organ of corti: a window on cochlea bioenergetics. Brain Res. 2009;1277:37–41. doi: 10.1016/j.brainres.2009.02.052. [DOI] [PMC free article] [PubMed] [Google Scholar]
- Umemiya M, Chen N, Raymond LA, Murphy TH. A calcium-dependent feedback mechanism participates in shaping single NMDA miniature EPSCs. J Neurosci. 2001;21:1–9. doi: 10.1523/JNEUROSCI.21-01-00001.2001. [DOI] [PMC free article] [PubMed] [Google Scholar]
- Vollrath MA, Kwan KY, Corey DP. The micromachinery of mechanotransduction in hair cells. Annu Rev Neurosci. 2007;30:339–365. doi: 10.1146/annurev.neuro.29.051605.112917. [DOI] [PMC free article] [PubMed] [Google Scholar]
- Wang BM, Weiner ND, Ganesan MG, Schacht J. Interaction of calcium and neomycin with anionic phospholipid-lecithin liposomes: a differential scanning calorimetry study. Biochem Pharmacol. 1984a;33:3787–3791. doi: 10.1016/0006-2952(84)90041-8. [DOI] [PubMed] [Google Scholar]
- Wang BM, Weiner ND, Takada A, Schacht J. Characterization of aminoglycoside-lipid interactions and development of a refined model for ototoxicity testing. Biochem Pharmacol. 1984b;33:3257–3262. doi: 10.1016/0006-2952(84)90087-X. [DOI] [PubMed] [Google Scholar]
- Wang KK. Developing selective inhibitors of calpain. Trends Pharmacol Sci. 1990;11:139–142. doi: 10.1016/0165-6147(90)90060-L. [DOI] [PubMed] [Google Scholar]
- Warchol ME. Cellular mechanisms of aminoglycoside ototoxicity. Curr Opin Otolaryngol Head Neck Surg. 2010;18:454–458. doi: 10.1097/MOO.0b013e32833e05ec. [DOI] [PubMed] [Google Scholar]
- Wei X, Zhao L, Liu J, Dodel RC, Farlow MR, Du Y. Minocycline prevents gentamicin-induced ototoxicity by inhibiting p38 MAP kinase phosphorylation and caspase 3 activation. Neuroscience. 2005;131:513–521. doi: 10.1016/j.neuroscience.2004.11.014. [DOI] [PubMed] [Google Scholar]
- White C, Li C, Yang J, Petrenko NB, Madesh M, Thompson CB, Foskett JK. The endoplasmic reticulum gateway to apoptosis by Bcl-X(L) modulation of the InsP3R. Nat Cell Biol. 2005;7:1021–1028. doi: 10.1038/ncb1302. [DOI] [PMC free article] [PubMed] [Google Scholar]
- Wirmer J, Westhof E. Molecular contacts between antibiotics and the 30S ribosomal particle. Methods Enzymol. 2006;415:180–202. doi: 10.1016/S0076-6879(06)15012-0. [DOI] [PubMed] [Google Scholar]
- Zhong F, Davis MC, McColl KS, Distelhorst CW. Bcl-2 differentially regulates Ca2+ signals according to the strength of T cell receptor activation. J Cell Biol. 2006;172:127–137. doi: 10.1083/jcb.200506189. [DOI] [PMC free article] [PubMed] [Google Scholar]
- Zirpel L, Rubel EW. Eighth nerve activity regulates intracellular calcium concentration of avian cochlear nucleus neurons via a metabotropic glutamate receptor. J Neurophysiol. 1996;76:4127–4139. doi: 10.1152/jn.1996.76.6.4127. [DOI] [PubMed] [Google Scholar]
- Zirpel L, Lachica EA, Rubel EW. Activation of a metabotropic glutamate receptor increases intracellular calcium concentrations in neurons of the avian cochlear nucleus. J Neurosci. 1995;15:214–222. doi: 10.1523/JNEUROSCI.15-01-00214.1995. [DOI] [PMC free article] [PubMed] [Google Scholar]
- Zirpel L, Lippe WR, Rubel EW. Activity-dependent regulation of [Ca2+]i in avian cochlear nucleus neurons: roles of protein kinases A and C and relation to cell death. J Neurophysiol. 1998;79:2288–2302. doi: 10.1152/jn.1998.79.5.2288. [DOI] [PubMed] [Google Scholar]
- Zucker R. Photorelease techniques for raising or lowering intracellular Ca2+ Methods Cell Biol. 1994;40:31–63. doi: 10.1016/S0091-679X(08)61109-7. [DOI] [PubMed] [Google Scholar]