Abstract
Background
Skeletal muscle sodium channel (Nav1.4) expression in border zone myocardium increases action potential upstroke velocity in depolarized isolated tissue. Because resting membrane potential in the 1 week canine infarct is reduced, we hypothesized that conduction velocity (CV) is greater in Nav1.4 dogs compared to control dogs.
Objective
To measure CV in the infarct border zone border in dogs with and without Nav1.4 expression.
Methods
Adenovirus was injected in the infarct border zone in 34 dogs. The adenovirus incorporated the Nav1.4- and a green fluorescent protein (GFP) gene (Nav1.4 group, n=16) or only GFP (n=18). After 1 week, upstroke velocity and CV were measured by sequential microelectrode recordings at 4 and 7 mM [K+] in superfused epicardial slabs. High density in vivo epicardial activation mapping was performed in a subgroup (8 Nav1.4, 6 GFP) at 3–4 locations in the border zone. Microscopy and antibody staining confirmed GFP or Nav1.4 expression.
Results
Infarct sizes were similar between groups (30.6+/−3 % of LV mass, mean+/−SEM). Longitudinal CV was greater in Nav1.4- than in GFP- sites (58.5+/−1.8 vs 53.3+/−1.2 cm/s, 20 and 15 sites, respectively, p<0.05). Transverse CV was not different between the groups. In tissue slabs dV/dtmax was higher and CV was greater in Nav1.4 than in control at 7 mM [K+] (P<0.05). Immunohistochemical Nav1.4 staining was seen at the longitudinal ends of the myocytes.
Conclusion
Nav1.4 channels in myocardium surviving 1 week infarction increases longitudinal but not transverse CV, consistent with the increased dV/dtmax and with the cellular localization of Nav1.4.
Keywords: conduction, arrhythmias, gene therapy, skeletal muscle, sodium channel, myocardial infarction
INTRODUCTION
Myocardial infarction is a major cause of life-threatening ventricular arrhythmias, most of which are reentrant1. Slowed conduction and a decreased effective refractory period facilitate the occurrence of reentry2,3. Most antiarrhythmic interventions have focused on further depressing and/or blocking local conduction or prolonging refractoriness as means to prevent or terminate reentry. However, it has been hypothesized that normalizing depressed conduction is also antiarrhythmic3,4,5.
In the 1 week old myocardial infarct in dogs reentrant activation is facilitated by the electrophysiologic properties of the surviving epicardial myocardium overlying infarcted tissue6,7,8,9. In this layer the membrane potential and dV/dtmax are reduced and hence conduction is slowed. Because the heart is amenable to epicardial mapping and intervention studies, this model is suitable for testing the hypothesis that agents that speed conduction may be antiarrhythmic.
We first tested the hypothesis by expressing the skeletal muscle sodium channel (Nav1.4) in the cardiac infarct border zone. Nav1.4 channels inactivate at less negative membrane potentials than do cardiac muscle sodium channels (Nav1.5)10. When Nav1.4 is expressed in cardiac muscle, the relation between resting membrane potential and action potential upstroke velocity is shifted to less negative membrane potentials than in control tissue11. As a result more sodium channels are available at the same resting membrane potential in the transfected than in the control tissue. In vivo experiments on dogs with a 1 week-old myocardial infarct showed that cardiac Nav1.4 expression resulted in an increase in dV/dtmax and decreased inducibility of sustained ventricular arrhythmias11. However, a direct effect on conduction velocity was not tested.
To directly test the hypothesis that conduction in the subepicardial border zone of a 1 week-old myocardial infarct is faster in regions of hearts in which Nav1.4 is locally expressed compared to conduction in sham operated control dogs (in which infarction is created but Nav1.4 is not expressed) we performed in vivo epicardial mapping in dogs with a 1 week-old myocardial infarct with and without local Nav1.4 expression.
METHODS
Nav1.4 adenovirus preparation and virus injection
We inserted the skeletal muscle Na+ channel Nav1.4 (kindly provided by Dr Gail Mandel) into the pDC516 shuttle vector (Microbix, Toronto, Canada) in 2 sections, prepared an adenovirus from this transgene using the Admax system (Microbix) and HEK293 cells, and, after plaque purification, extracted total DNA from infected cells (Qiagen, Valencia, Ca). The cDNA transgene was amplified by polymerase chain reaction, sequenced to confirm the absence of mutations, and the titer was determined using fluorescent focus assay with mouse anti-adenosine virus antiserum (Advanced ImmunoChemical, Long Beach, Ca) and goat anti-mouse antiserum (Santa Cruz Biotechnology, Santa Cruz, Ca).
Canine infarct preparation, virus injection, and electrogram recording
Protocols were approved by the Columbia University Animal Care and Use Committee. Adult male mongrel dogs (22 to 25 kg; Chestnut Ridge Kennels, Chippensburg, Pa) were anesthetized with thiopental (17 mg/kg IV), intubated and ventilated with isoflurane (1.5% to 3.0%) and oxygen (2 L/min). A fentanyl patch (releasing 0.025–0.05 µg/hr) was administered prior to surgery. A left thoracotomy was performed under aseptic conditions, and sites of coronary ligation were selected on the basis of the distribution of the left anterior descending artery and collateral circulation from the circumflex. A bipolar platinum electrode was used to record epicardial electrograms. We used a modified 30-gauge Hamilton syringe to inject adenoviral constructs expressing Nav1.4 and green fluorescent protein (GFP) (6×10¹⁰ fluorescent-focus units of each in 0.8 ml solution) in 4 separate aliquots within 5 mm of one another in a square array into the epicardial border zone at selected sites having wide local QRS complexes. The injected area was marked with small sutures. Adenovirus incorporating the Nav1.4 gene and GFP was injected in 8 dogs, and adenovirus containing only GFP was administered to 6 sham dogs. The chest was closed, lidocaine infusion (50 µg/kg/min) was initiated during surgery, and prophylactic lidocaine continued for 24 to 48 hours postoperatively. Buprenorphine (0.03 mg/kg) was given intramuscularly at veterinary discretion for pain relief up to 48 hours postoperatively. No pain medication was needed beyond 48 hours postoperatively. At 7 days of recovery, the dogs were anesthetized, the heart was exposed, and an electrophysiogical study was performed.
Electrophysiological study
A three lead ECG and local electrograms were acquired and stored on a personal computer-based data acquisition system. In each dog, unipolar electrograms were recorded with a multi-terminal electrode, containing 13×16 electrodes at an interelectrode distance of 0.5 mm. The reference signal was derived from a virtual ground electrode connected to the mediastinum. The hearts were paced with a bipolar stimulating electrode at the center of the electrode grid for determination of the longitudinal and transverse conduction velocities (VL and VT). Stimulus strength was twice diastolic threshold, pacing cycle length was 450 ms. Recordings were made at the injected sites (20 locations in the 8 Nav1.4 dogs, 15 locations in the 6 control dogs) and in normal myocardium. Selected episodes of data could be stored on the hard disk of the computer. Sampling rate was 2.048 kHz. Analysis of the signals was done offline with a custom-made data analysis program12. During analysis of the activation pattern and calculation of the conduction velocities the operator was blinded to the origin of the recordings in terms of the intervention (Nav1.4 gene or GFP expression). The measurements were reviewed by two operators (RC and FJGW-S) who were required to reach a unanimous outcome. Calculations of conduction velocities were made according to Kléber et al.13. In brief, the long and short axes of conduction, and the site of stimulation of the conduction pattern were identified, based on the anisotropic pattern created by 2.5 ms isochrones. VL was calculated along the long axis, VT along the short axis of the anisotropic activation pattern. For each site, two electrode positions were selected with the largest possible distance between the two, and separated by equidistant isochrones (in other words, no acceleration (breakthrough) or deceleration occurs in the recording area). In addition, the electrodes along the line connecting the two selected electrodes were required to demonstrate a gradual increase in activation time. The electrode most proximal to the stimulus position was selected on the basis of the presence of a detectable interval between the stimulus artifact and the local initial deflection. Laplacian electrograms were calculated from 4–8 surrounding electrodes to identify the local moment of maximum transmembrane current (except for electrodes located at the rim of the electrode grid)14. The resultant measure of propagation velocity yields a global parameter that does not exclude local discontinuous propagation at smaller levels.
After recordings were completed, extrastimulus pacing was performed with a programmable stimulator (Bloom Associates, Reading, Pa) in an effort to map the activation pattern of induced ventricular tachyarrhythmias. A large 11×11 electrode sheet (interelectrode distance 5 mm) was placed over the infarcted area. Pacing was performed from the normal zone and subsequently from the periphery of the infarct. Because of the presence of the electrode over the center of the infarct, pacing from this site could not be performed. Thus, the pacing protocol was less aggressive than in our earlier study11. After 10 beats at a cycle length of 450 ms, S2 was initiated at 250 ms and S1–S2 was decreased in 10 ms steps until loss of capture. A second and third premature beat were introduced by increasing the coupling interval by 10 ms from 100 ms until capture occurred. At the end of testing for arrhythmia induction or when VT occurred, the heart was removed and prepared for microelectrode study, histology, and infarct sizing.
Microelectrode studies
The excised hearts were immersed in Tyrode’s solution equilibrated with 95% O2/5% CO2. Epicardial strips (about 10×5×0.5 to 1 mm) were filleted parallel to the epicardial surface from sites injected with Nav1.4 and/or GFP. Preparations were pinned to the bottom of a 4-mL tissue bath (epicardial surface up) and superfused (36 °C, pH 7.35+/−0.05) at 12 mL/min. Potassium concentrations of the superfusate were varied from 4 to 7 mmol/L.
Preparations were paced at a cycle length of 500 ms and action potentials were recorded at 30 to 50 sites per preparation after 3 hours of equilibration, in order to reach steady state15. Then, the KCl concentration in the Tyrode’s solution was increased to 7 mmol/L; after 15 minutes of equilibration, multisite microelectrode mapping was repeated. Activation time of each site was determined as the time interval between stimulus artefact and action potential upstroke. Activation maps were created from sequential impalements of the tissue slabs superfused with Tyrode’s solution having [K+] = 4 and 7 mmol/L.
Infarct size
After epicardial slabs were removed for microelectrode studies and histology, the heart was cooled to 4 °C and cut into 1-cm-thick transverse slices from apex to base. Slices were incubated for 20 minutes in 1% tetrazolium red (pH 7.4 buffer at 37 °C), immersed in 10% formalin for 15 minutes, and pressed between 2 glass plates to obtain uniform 1-cm thickness. Apical sides of the slices were photographed, and a digital image was obtained. Planimetry (Image J Analysis 1.40 g, National Institutes of Health, Bethesda) was used to determine overall infarct size. The volume of infarcted myocardium was calculated by multiplying planimetered areas by slice thickness and expressed as a percentage of total left ventricular volume.
Histology and Immunochemistry
Tissue samples from 3 Nav1.4-treated dogs were embedded in O.C.T. compound (optimal cutting temperature, Tissue-Tek) and quickly frozen in liquid nitrogen. Ten micrometer thick cryostat sections were fixed with 4% paraformaldehyde for 15 minutes. After washing with phosphate buffered saline (PBS, 3 times × 10 min), sections were incubated with Nav1.4 antibody (1:200, Sigma Aldrich) alone or together with Cx43 antibody (1:500, Invitrogen) diluted with 0.5% bovine albumin serum in PBS for overnight. The next day, after washing with PBS (3 times × 10 min), tissue sections were incubated with Alexa Fluor 488 and 594 goat secondary antibody (1:500, Invitrogen) for 90 min. Sections were washed and mounted in antifade mounting medium which includes DAPI (4',6- diamidino-2-phenylindole). All the sections were observed with a laser scanning confocal microscope (Zeiss LSM 510 NLO multiphoton).
Statistics
Data are expressed as mean +/− SEM. A two factor mixed design ANOVA with repeated measures on one factor was used for comparison of the microelectrode data presented in Figure 1. Differences in conduction velocity between Nav1.4- expressing and sham-injected zones were analyzed with the Student’s t-test. Arrhythmia incidence (the ability of ventricular pacing to induce sustained VT) in sham and SkM1-treated animals was analyzed via Fisher's exact test. P<0.05 was considered significant.
Figure 1.
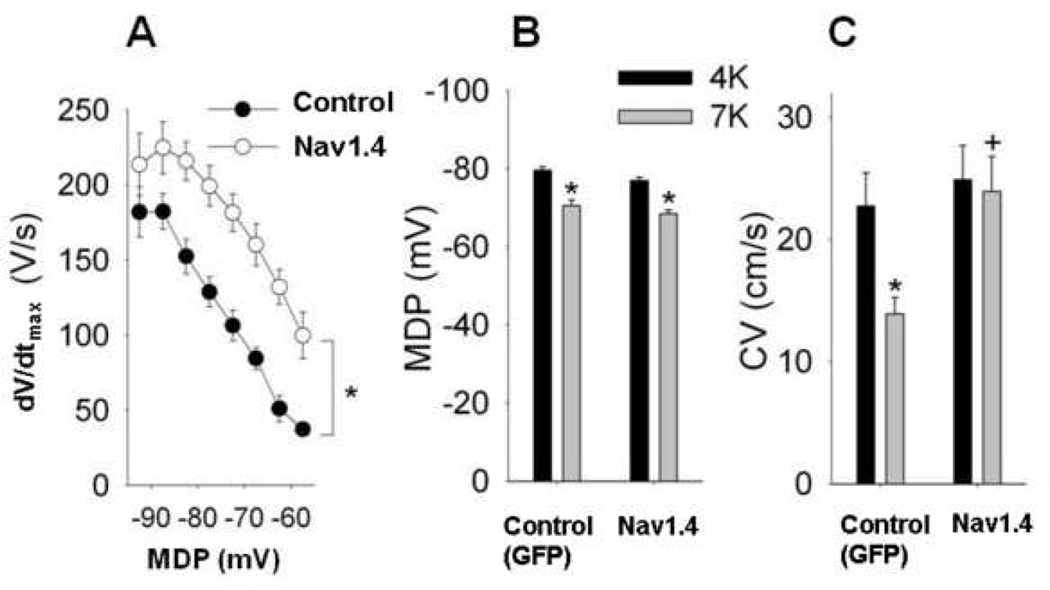
A. The dV/dt of the upstroke of the cardiac action potential recorded from isolated epicardial tissue slabs excised from the injected sites of the 1 week old myocardial infarction as a function of the maximum diastolic potential (MDP). Tissues were superfused with solutions containing various potassium concentrations to depolarize the cell. Differences between the two groups of animals are statistically significant at −85 mV and at more depolarized potentials
B and C. Respective averaged data of maximum diastolic potential (MDP) and conduction velocity (CV) in control and Nav1.4 animals, during superfusion with [K+] 4 and 7 mmol/L. Although superfusion with elevated [K+] caused a similar decrease of MDP, conduction was significantly faster in the Nav1.4-expressing tissue than in the non-Nav1.4-expressing control tissue at 7 mmol/L [K+]. Unfilled symbols: GFP-injected controls (n=18). Filled symbols: Nav1.4 (n=16). * indicates P<.05.
RESULTS
Infarct sizes were not significantly different between the two groups: 29+/−4.2% of left ventricular mass in the Nav1.4dogs versus 31+/−7.1% in the control dogs. There were, however large variations in infarct size among dogs within each group. Thus, in the Nav1.4-dogs, the smallest infarct was 15 %, the largest, 43%. In sham dogs, the range was 15 to 49%.
Figure 1A shows the dV/dtmax versus the maximum diastolic potential (MDP) in tissue slabs from Nav1.4-expressing and control (GFP only) - injected infarct zones. Even at slightly depolarized membrane potentials dV/dtmax from the Nav1.4 expressing zones are significantly higher than those from the sham dogs (p<0.05 at all potentials positive to −90 mV). These data confirm that the previously-reported relationship of dV/dtmax to membrane potential11 was seen in this study as well.
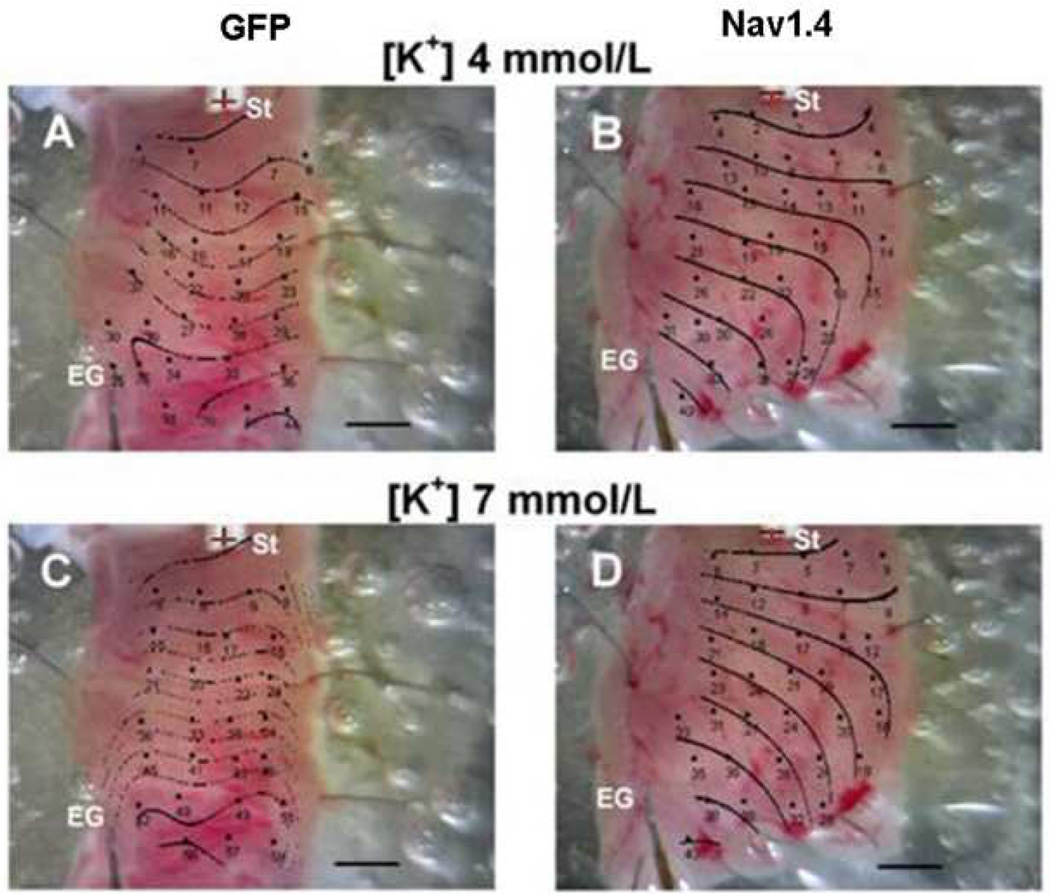
We next determined the conduction velocity at [K+] = 4 and 7 mmol /L). Figure 2 shows representative activation maps superimposed on the photographic images of the tissue slabs removed from the infarct zone (IZ) of a control animal (panels A and B) and a Nav1.4-treated dog (panels C and D). In the control animal activation across the subepicardium was markedly slowed after superfusion with elevated [K+] (note the crowding of isochrones), whereas conduction was maintained in the Nav1.4-expressing tissue (right panels).
Figure 2.
Representative activation maps superimposed on photographic images of tissue slabs excised from the infarct zones of Nav1.4 dogs (right panels) and GFP-injected control dogs (left panels). Panels A and C: activation patterns of the tissue superfused with [K+] 4 mmol/L. Panels B and D: superfusion with [K+] 7 mmol/L. Dots indicate microelectrode impalement sites. Numbers are activation times relative to the stimulus artifact. St: Stimulus site. EG: reference electrogram site. Horizontal scale 2 mm; interval between isochrones 5 ms.
Figure 1B shows that superfusing with elevated [K+] in both groups of animals resulted in a similar degree of membrane potential depolarization. No statistically significant differences were observed between the groups at [K+]/= 4 or 7 mmol/L. Despite the equivalence of membrane potentials between groups at both [K+] a significant decrease occurred in conduction velocity (p<0.05) after raising potassium concentration was observed in the control group, but not in the Nav1.4-group (Figure 1C). In addition at [K+]=7 mmol/L CV was greater in Nav1.4 than controls (p<0.05) (figure 1C).
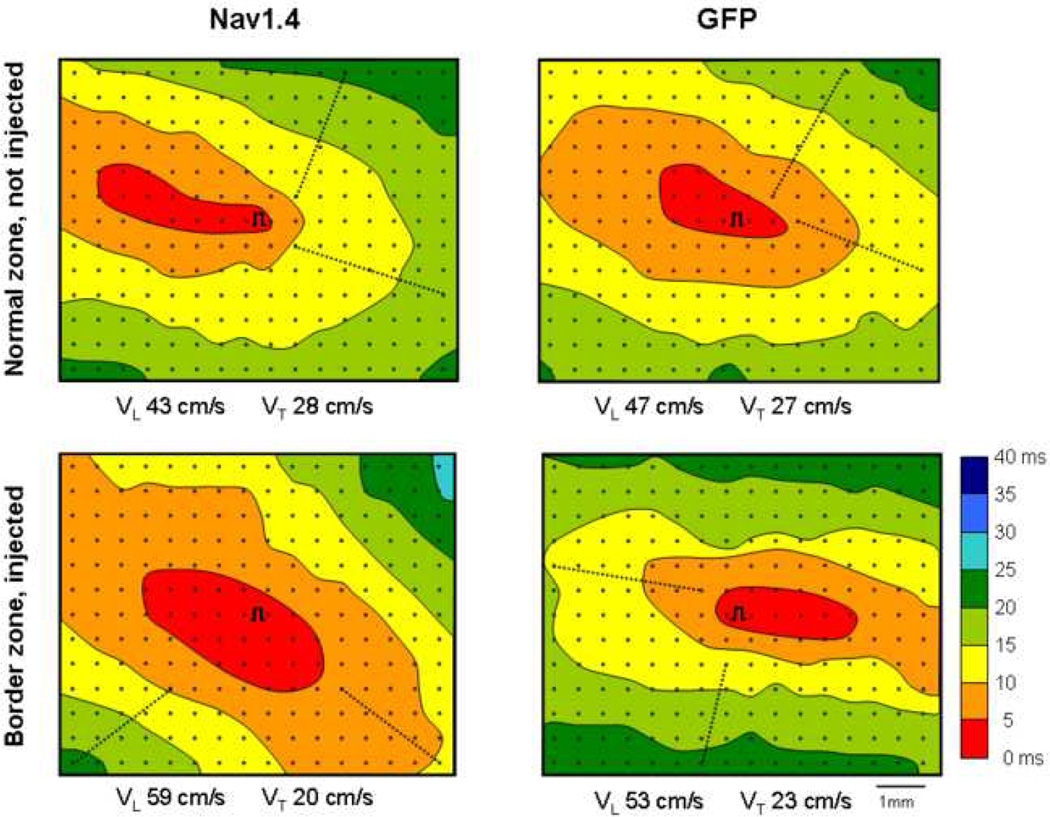
The data in figures 1 and 2 show that in isolated tissue obtained from the Nav1.4 injected dogs conduction velocity was maintained in perfusate containing K+ 7 mM. To test whether a Nav1.4-associated effect on conduction occurred in the intact animal we studied 8 Nav1.4 expressing dogs and 6 control (GFP-injected) dogs. Figure 3 shows activation maps from the normal zones and infarct zones of a Nav1.4 treated dog and a control (GFP-injected) dog. The upper panels show that the activation patterns in the non-infarcted zone (neither of which was transfected) are similar in the two animals, as expected. However, the pattern in the GFP-injected infarct site demonstrated crowding of isochrones, indicative of slowing of conduction resulting from infarction (lower right panel). In the Nav1.4 expressing infarct zone (lower left panel) the isochronic pattern resembled more that of the normal, non infarcted tissue. The differences in activation pattern were reflected by the calculated conduction velocities. Longitudinal conduction velocity in the Nav1.4 expressing infarct zone was 59 cm/sec, compared to 49 cm/sec in the infarct zone of the control dog. Transverse conduction velocities were virtually the same (20 versus 18 cm/sec). Values for longitudinal and transverse conduction velocities in the normal zones of both hearts were similar.
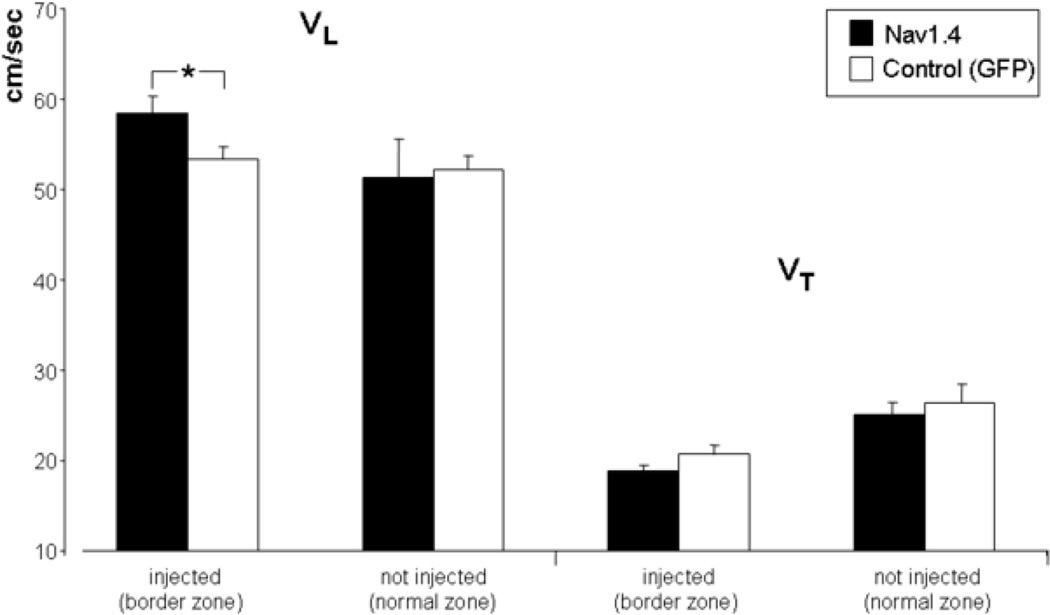
Figure 4 summarizes longitudinal and transverse conduction velocities for the 20 recording sites in the Nav1.4 expressing infarct zones, the 15 sites in GFP-expressing infarct zones and the 14 sites in normal zones (8 from Nav1.4 dogs, 6 from control dogs). Mean longitudinal CV for the Nav1.4 infarct zones was 58.5 +/− 1.8 cm/sec, for control infarct zones 53.3 +/− 1.3 cm/sec (p<.05). Transverse CV were 18.9 +/− 0.7 cm/sec for the Nav1.4 expressing infarct zones, and 20.7 +/− 1.1 cm/sec for the control infarct zones (p>0.05). For the normal zones, longitudinal CV in the Nav1.4 group was 51.4+/−4.2 cm/sec, in the control dogs 52.2+/−1.6 cm/sec. Transverse CV were 25.1+/−1.3 and 26.5+/−1.9 cm/sec respectively (all p>0.05). The anisotropic ratio (longitudinal divided by transverse CV) was subsequently calculated In the Nav1.4 expressing infarct zones this ratio was 3.1+/−0.1 whereas in the GFP-injected infarct zones it was 2.7+/−0.1 (p<0.05). In the normal zones (both non-injected) of the two groups there was no statistical difference in anisotropic ratio.
Figure 4.
Averaged longitudinal and transverse conduction velocities (VL and VT). In the noninjected normal zones longitudinal and transverse conduction velocities are not statistically different. In the Nav1.4-expressing infarcted zones the longitudinal but not the transverse conduction velocity is significantly increased. * indicates P<.05.
Programmed electrical stimulation resulted in ventricular tachycardia in 2 of the 6 control dogs, and in 1 of the 8 Nav1.4 dogs. These outcomes did not differ (p>0.05).
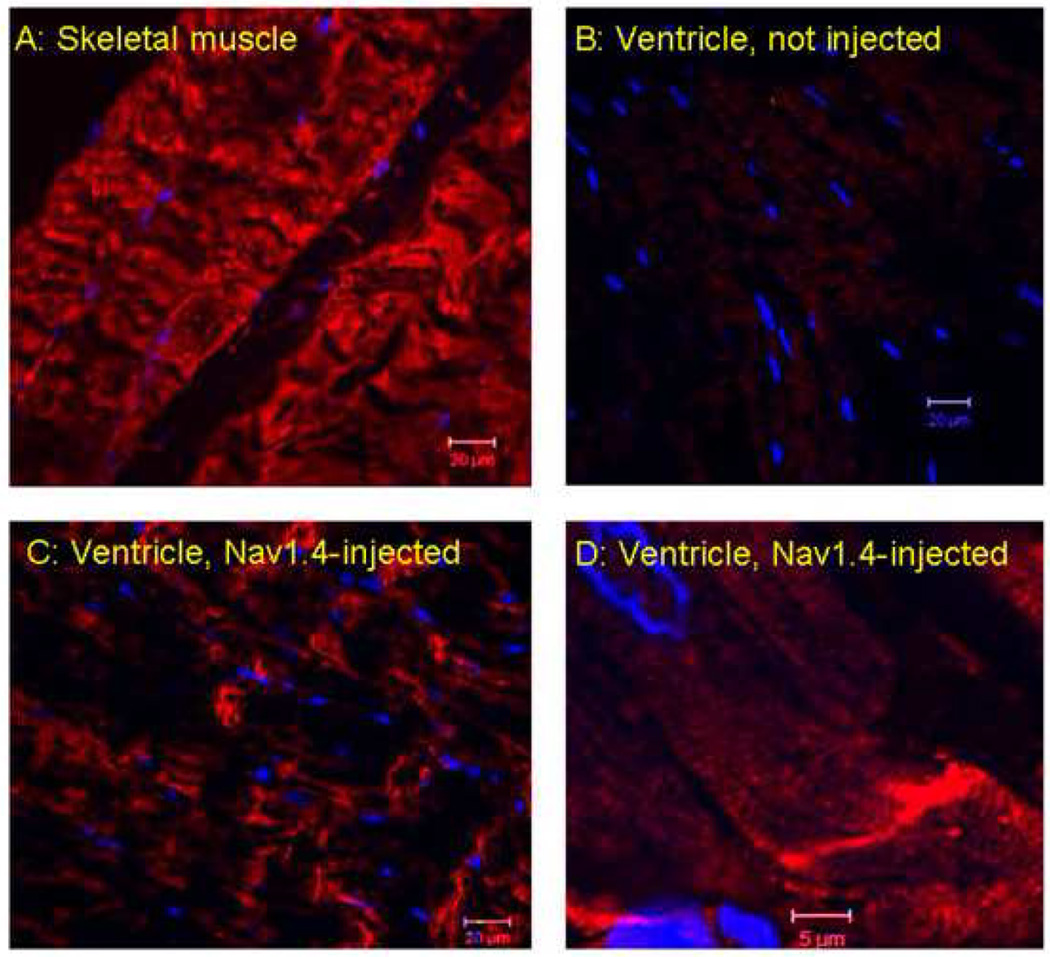
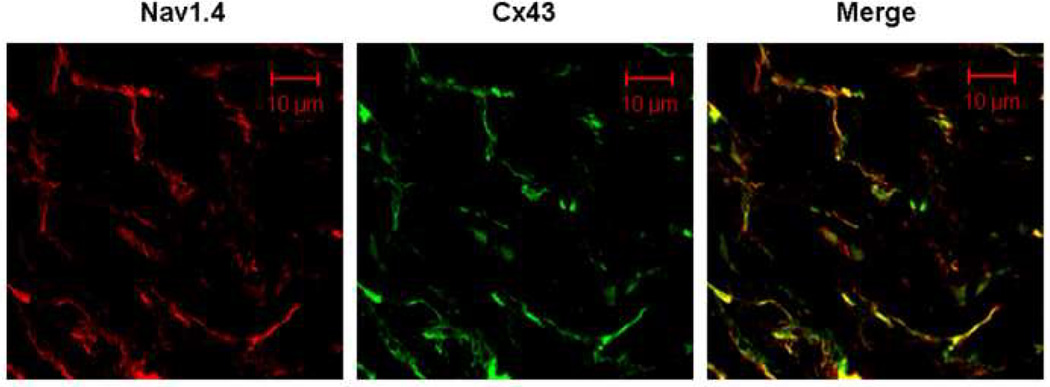
The effect of Nav1.4 expression on longitudinal conduction velocity led us to hypothesize that Nav1.4 might be localized more at the longitudinal (than the transverse) margins of the myocytes, where it might facilitate longitudinal more than transverse conduction velocity. Figures 5 and 6 explore the distribution pattern of Nav1.4. Figure 5 demonstrates positive staining for Nav1.4 in skeletal muscle but not in uninjected regions of the heart (Panels A and B respectively). Panels C and D (higher magnification) show what appears to be a longitudinal distribution of Nav1.4 staining in an injected region of the heart. Figure 6 uses co-immunofluorescence staining for Nav1.4 and Cx43 to visualize the distribution of Nav1.4 in ventricular sections from the Nav1.4 injection site in the same animal. Note the co-localization of the two (right panel). Similar results were obtained in 2 other animals.
Figure 5.
Confocal immunofluorescent labeling of Nav1.4 (red). Panel A, Positive control: a skeletal muscle section immunostained with Nav1.4 antibody. Panel B, Negative control: a left ventricular section without Nav1.4 injection, immunostained with Nav1.4 antibody. Panel C. Representative images of left ventricular sections at the injection site immunostained with Nav1.4 antibody. The antibody stained intensely at the longitudinal end of the cardiomyocytes in the Nav1.4 injected sections. Panel D, enlargement of section in panel C. DAPI (blue) was used as a nuclear stain. Scale bars are 20 microns in Panels A–C and 5 microns in Panel D.
Figure 6.
Confocal co-immunofluorescent labeling of Nav1.4 and Cx43 from same dog as in Figure 5. Representative images of left ventricular sections at the Nav1.4 injection site co-immunostained for Nav1.4 (red) and Cx43 (green) antibody. Note the co-localization of Nav1.4 and Cx43 protein in the overlay (yellow).
DISCUSSION
The major finding in this study is that conduction velocity in the epicardial border zone of myocardial infarcts in the heart in situ is significantly increased when Nav1.4 is overexpressed. While the longitudinal conduction velocity was increased by about 10% transverse conduction velocity did not differ between Nav1.4-expressing and non-expressing sites. Concordant with our in situ recordings, activation maps obtained during superfusion of isolated tissues with elevated potassium concentrations demonstrated less isochronal crowding in the Nav1.4-expressing than in non-Nav1.4-injected infarct zones. Finally, and in agreement with previous findings11, dV/dtmax of action potentials recorded from isolated Nav1.4 expressing infarct sites were higher than those from sham injected sites, particularly at reduced resting membrane potentials.
The localization of Nav1.4 channels was a critical finding. The channels were predominantly expressed at the cell-cell contact areas along the longitudinal axis, similarly to cardiac Nav1.5 channels16,17,18. In view of the homology of human Nav1.4 and dog Nav1.5 it is likely that the expression pathway and the trafficking mechanisms pertinent to the native cardiac sodium channel are used, leading to the cardiac-like expression pattern of the skeletal muscle sodium channel19. Such an expression pattern of Nav1.4 near the intercalated disks (figures 5 and 6)20 may be responsible for a larger effect of Nav1.4 expression on longitudinal than transverse conduction velocity as it would favor flow of excitatory current in the longitudinal direction. Nonetheless, because gap junctional proteins are also present at the myocyte’s lateral sides and Nav1.4 sodium channels co-localize with these gap-junctional complexes as well (see also figure 6), it cannot be excluded that a small increase in transverse conduction velocity was present but undetected.
An increase in conduction velocity is a potentially antiarrhythmic effect for arrhythmias based on reentry. Our present data provide a mechanistic link between the increase in dV/dtmax of the cardiac action potential and the antiarrhythmic effect of Nav1.4 expression described in our previous paper11, by demonstrating a direct effect of Nav1.4 expression on conduction velocity. Arrhythmogenesis in the one-week old canine myocardial infarction model depends on the occurrence of unidirectional block in the surviving subepicardial myocardium, and activation block typically occurs in the direction of the longitudinal axis of the muscle fibers1. Increase of the longitudinal flow of current will increase the safety factor for conduction to prevent activation block. A similar mechanism has been demonstrated via pharmacological modulation of gap junctional conductance21. However, in that study the increase in longitudinal conduction velocity was associated with a decrease in transverse conduction velocity, which may be proarrhythmic. In our present study, overexpression of Nav1.4 did not lead to a decrease in transverse conduction velocity.
The present study by design emphasizes the role of conduction velocity associated with Nav1.4-expression, rather than confirmation of an antiarrhythmic effect. While we attempted to map the reentrant activation pattern of the tachyarrhythmias following a stimulation protocol, the arrhythmia-induction results were inconclusive: ventricular tachycardia was induced in only 2 of 6 sham dogs versus 1 of 8 Nav1.4 dogs. Because demonstration of reentry is not to be expected in every tachycardia (as it depends on infarct size, 3D structure of the surviving layer, electrode placement) and because the incidence of arrhythmias was lower in this than our previous study, we did not reach a conclusion regarding the influence of Nav1.4 on the initiation of reentry. The lesser incidence of arrhythmias in this study is likely caused by the less aggressive pacing protocol that we used this time, mandated by the presence of the mapping electrode.
We detected a significantly higher anisotropic ratio in infarcted tissue than in normal ventricular tissue, even in the absence of Nav1.4. It is known that in the surviving epicardial layer in the canine 1 week old myocardial infarct, conduction is influenced by electrical uncoupling from the truly infarcted tissue22,23 and by the morphology of the transition between the thin surviving subepicardial myocardium and the thick normal myocardium. On the one hand, the loss of an electrotonic ‘current load’ towards the midmyocardium makes more current available for trans-epicardial conduction; on the other hand may the transition of the thick normal myocardium and the thin subepicardial layer locally speed longitudinal conduction as a result of the current-to-load mismatch (more current than load)23.
Conclusion
Nav1.4 expression in the surviving epicardial layer of the 1 week old myocardial infarct in dogs causes an increase in longitudinal but not transverse conduction velocity, potentially contributing to its antiarrhythmic efficacy that was19 previously shown. The intracellular localization of the channel near the intercalated disks of the cardiac myocytes may explain the increase in longitudinal conduction velocity and anisotropic conduction. This is the first study demonstrating that a gene therapy based on Na channel expression that was previously shown to be antiarrhythmic11 acts to increase conduction velocity.
Figure 3.
Representative activation maps from a control (GFP-injected) animal and a Nav1.4 injected animal. Each panel shows the electrode grid (dots, 0.5 mm interelectrode distance) and the site of stimulation (symbol ∏). Lines indicate 5 ms isochrones, colors are isochronal classes). Dotted lines show where conduction velocities were calculated. Close to the stimulus site, electrograms incorporated a stimulus artifact that was too large to allow identification of the moment of local activation.
Note that longitudinal but not transverse conduction velocity is increased in the Nav1.4 expressing site but not in the control site. Normal zone (non injected) maps from the same animals are shown in the top panels.
Acknowledgements
The authors are grateful to Caitlin Kelly for technical support of the study, and to drs. J.M. de Bakker and A.C Linnenbank for critical reviewing.
This study was supported by USPHS NHLBI grant HL094410 and by the Stichting Cardiovascular Research (MJ, TO, RC).
LIST OF ABBREVIATIONS
- CV
Conduction velocity
- dV/dtmax
Maximum upstroke velocity
- ECG
Electrocardiogram
- GFP
Green Fluorescent Protein
- LV
Left Ventricle
- MDP
Maximum Diastolic Potential
- Nav1.4
Skeletal sodium channel gene
- S1, S2
Basic stimulus, premature stimulus
- VL, VT
Longitudinal and transverse conduction velocity
Footnotes
Publisher's Disclaimer: This is a PDF file of an unedited manuscript that has been accepted for publication. As a service to our customers we are providing this early version of the manuscript. The manuscript will undergo copyediting, typesetting, and review of the resulting proof before it is published in its final citable form. Please note that during the production process errors may be discovered which could affect the content, and all legal disclaimers that apply to the journal pertain.
Conflicts of interest: none
REFERENCES
- 1.Janse MJ, Wit AL. Electrophysiological mechanisms of ventricular arrhythmias resulting from myocardial ischemia and infarction. Physiol Rev. 1989;69:1049–1169. doi: 10.1152/physrev.1989.69.4.1049. [DOI] [PubMed] [Google Scholar]
- 2.Wit AL, Janse MJ. Experimental models of ventricular tachycardia and fibrillation caused by ischemia and infarction. Circulation. 1992 [PubMed] [Google Scholar]
- 3.Mines GR. On circulating excitations in heart muscles and their possible relation to tachycardia and fibrillation. Trans. Royal Society of Canada. 1914;Sect.IV:43–53. [Google Scholar]
- 4.Working group on arrhythmias of the European Society of Cardiology: The Sicilian Gambit. A new approach to the classification of antiarrhythmic drugs based on their actions on arrhythmogenic mechanisms. Circulation. 1991;84:1831–1851. doi: 10.1161/01.cir.84.4.1831. [DOI] [PubMed] [Google Scholar]
- 5.Schmitt FO, Erlanger J. Directional differences in the conduction of the impulse through heart muscle and their possible relation to extrasystolic amd fibrillary contractions. Am J Physiol. 1928;87:326–347. [Google Scholar]
- 6.Wit AL, Allessie MA, Fenoglio JJ, Jr, et al. Significance of the endocardial and epicardial border zones in the genesis of myocardial infarction arrhythmias. 1981:39–68. [Google Scholar]
- 7.Ursell PC, Gardner PI, Albala A, Fenoglio JJ, Jr, Wit AL. Structural and electrophysiological changes in the epicardial border zone of canine myocardial infarcts during infarct healing. Circulation Research. 1985;56:436–451. doi: 10.1161/01.res.56.3.436. [DOI] [PubMed] [Google Scholar]
- 8.Denniss AR, Richards DA, Waywood JA, et al. Electrophysiological and anatomic differences between canine hearts with inducible ventricular tachycardia and fibrillation associated with chronic myocardial infarction. Circ Res. 1989;64:155–166. doi: 10.1161/01.res.64.1.155. [DOI] [PubMed] [Google Scholar]
- 9.Hunt GB, Ross DL. Influence of infarct age on reproducibility of ventricular tachycardia induction in a canine model. J Am Coll Cardiol. 1989;14:765–773. doi: 10.1016/0735-1097(89)90123-x. [DOI] [PubMed] [Google Scholar]
- 10.Hayward LJ, Brown RH, Cannon SC. Inactivation defects caused by monotonia-associated mutations in the sodium III–IV linker. J Gen Physiol. 1996;107:559–576. doi: 10.1085/jgp.107.5.559. [DOI] [PMC free article] [PubMed] [Google Scholar]
- 11.Lau DH, Clausen C, Sosunov EA, et al. Epicardial Border Zone Overexpression of Skeletal Muscle Sodium Channel SkM1 Normalizes Activation, Preserves Conduction, and Suppresses Ventricular Arrhythmia: An In Silico, In Vivo, In Vitro Study. Circulation. 2009;119:19–27. doi: 10.1161/CIRCULATIONAHA.108.809301. [DOI] [PMC free article] [PubMed] [Google Scholar]
- 12.Potse M, Linnenbank AC, Grimbergen CA. Software design for analysis of multichannel intracardial and body surface electrocardiograms. Computer Methods and Programs in Biomedicine. 2002;69:225–236. doi: 10.1016/s0169-2607(02)00014-7. [DOI] [PubMed] [Google Scholar]
- 13.Kleber AG, Janse MJ, Wilms-Schopman FJG, Wilde AAM, Coronel R. Changes in conduction velocity during acute ischemia in ventricular myocardial isolated porcine heart. Circulation. 1986;73:189–198. doi: 10.1161/01.cir.73.1.189. [DOI] [PubMed] [Google Scholar]
- 14.Coronel R, Wilms-Schopman FJG, de Groot JR, et al. Laplacian electrograms and the interpretation of complex ventricular activation patterns during ventricular fibrillation. J Cardiovasc Electrophysiol. 2000:1119–1128. doi: 10.1111/j.1540-8167.2000.tb01758.x. [DOI] [PubMed] [Google Scholar]
- 15.Sosunov EA, Ayukhovsky EP, Rosen MR. Effects of quinidine on repolarization in canine epicardium, midmyocardium, and endocardium. I: in vitro study. Circulation. 1997;96:4011–4018. doi: 10.1161/01.cir.96.11.4011. [DOI] [PubMed] [Google Scholar]
- 16.Zimmer T, Biskup C, Dugarmaa S, et al. Functional Expression of GFP-linked Human Heart Sodium Channel (hH1) and Subcellular Localization of the a Subunit in HEK293 Cells and Dog Cardiac Myocytes. Journal of Membrane Biology. 2002;186:1–12. doi: 10.1007/s00232-001-0130-1. [DOI] [PubMed] [Google Scholar]
- 17.Malhotra JD, Chen C, Rivolta I, et al. Characterization of Sodium Channel {{alpha}}- and {beta}-Subunits in Rat and Mouse Cardiac Myocytes. Circulation. 2001;103:1303–1310. doi: 10.1161/01.cir.103.9.1303. [DOI] [PubMed] [Google Scholar]
- 18.Cohen SA. Immunocytochemical Localization of rH1 Sodium Channel in Adult Rat Heart Atria and Ventricle: Presence in Terminal Intercalated Disks. Circulation. 1996;94:3083–3086. doi: 10.1161/01.cir.94.12.3083. [DOI] [PubMed] [Google Scholar]
- 19.Zimmer T, Bollensdorff C, Haufe V, Birch-Hirschfeld E, Benndorf K. Mouse heart Na+ channels: primary structure and function of two isoforms and alternatively spliced variants. AJP - Heart and Circulatory Physiology. 2002;282:H1007–H1017. doi: 10.1152/ajpheart.00644.2001. [DOI] [PubMed] [Google Scholar]
- 20.Kucera JP, Rohr S, Rudy Y. Localization of Sodium Channels in Intercalated Disks Modulates Cardiac Conduction. Circulation Research. 2002;91:1176–1182. doi: 10.1161/01.res.0000046237.54156.0a. [DOI] [PMC free article] [PubMed] [Google Scholar]
- 21.Wiegerinck RF, De Bakker JMT, Opthof T, et al. The effect of enhanced gap junctional conductance on ventricular conduction in explanted hearts from patients with heart failure. Basic Research in Cardiology. 2009;104:321–332. doi: 10.1007/s00395-008-0771-7. [DOI] [PubMed] [Google Scholar]
- 22.Ciaccio EJ. Localization of the slow conduction zone during reentrant ventricular tachycardia. Circulation. 2000;102:464–469. doi: 10.1161/01.cir.102.4.464. [DOI] [PubMed] [Google Scholar]
- 23.Ciaccio EJ, Ashikaga H, Kaba RA, et al. Model of reentrant ventricular tachycardia based upon infarct border zone geometry predicts reentrant circuit features as determined by activation mapping. Heart Rhythm. 2007;4:1034–1045. doi: 10.1016/j.hrthm.2007.04.015. [DOI] [PMC free article] [PubMed] [Google Scholar]


