

Abstract
We describe the use of near-infrared nanoparticle probes for in vivo imaging of metastatic ovarian cancer models. The system is highly efficient for labeling cells, and it is retained for several passages without any observed toxicity. Following injection into the mouse, labeled tumors were detected after three weeks. Visualization of multiple sites around the animals was enhanced with the use of the Carestream Multimodal Animal Rotation System.
Introduction
Ovarian cancer is the leading cause of gynecological cancer deaths1. Recurrence and chemoresistance are the major hurdles in the management of patients with ovarian cancer. This is because even with a successful first-line therapy, almost 90% of patients develop recurrence, which is the cause of most ovarian cancer deaths2,3. Furthermore, recurrent ovarian cancer is generally characterized by carcinomatosis or widespread metastatic disease—often not amenable to surgical debulking—and it is chemoresistant.
A limiting factor preventing the appropriate treatment and removal of metastatic progenitors is the lack of sensitive approaches to detect micrometastases. Furthermore, there is no animal model that can be used to evaluate new technologies that could be used for the screening and monitoring of recurrent disease. Many of the ovarian cancer animal models are based on subcutaneous (SC) injection of ovarian cancer cells. Although this localization is most convenient for monitoring tumor growth and response to potential therapies, it does not reflect the natural environment of ovarian cancer in the peritoneal cavity. Furthermore, although there have been advances in the development of intra-peritoneal (IP) tumor models, only upon post mortem analysis can one determine the extent of xenograft formation or the success of the administered chemotherapies.
We described the development of an IP model based on the injection of human ovarian cancer stem cells, which were able to form metastatic lesions4. However, monitoring the growth and spread of these lesions is limited by the lack of an adequate imaging approach.
Materials/Methods
Cell Labeling
KODAK X-SIGHT 549 or 761 Nanospheres (Carestream Molecular Imaging, Woodbridge, CT USA) were diluted to a final concentration of 1 μM in 3 mL of RPMI containing 2% FBS. Ovarian cancer stem-like cells (OCSCs) were trypsinized and washed 3 times with 2% RPMI. After the final centrifugation, the media was removed, replaced with the diluted nanospheres, and incubated at 37°C, 5% CO2, with gentle shaking for 6 hr. The cells were spun, resuspended in 10% RPMI, and returned to the tissue culture plates overnight. The cells were then imaged for fluorescence using a Zeiss Axio Imager (Carl Zeiss Thornwood, NY). To obtain growth curves, the labeled and unlabeled cells were plated in low confluence in a 6-well plate. Images were taken at pre-set intervals using an IncuCyte real-time imaging system (Essen BioScience, Ann Arbor, MI USA).
FACS Analysis
OCSCs labeled with X-SIGHT 549 Nanospheres (as above) were trypsinized, washed with PBS, and prepared for flow cytometric analysis. Cell labeling with X-SIGHT Nanospheres was confirmed by microscopy, and both labeled and unlabeled cells were incubated for 1 hour at 4°C with either anti-human CD44 FITC or rat anti-human FITC isotype control (1:100) (eBioscience, San Diego, CA USA). Data were acquired using a BD FACSCalibur and analyzed with Cell Quest Pro software (BD Biosciences, San Jose, CA USA).
In vitro Vessel Formation
In vitro vessel formation was previously described 5,6. Briefly, OCSCs were labeled with X-SIGHT 549 Nanospheres (as above) and plated as follows. Monolayer cultures were plated at a density of 70,000 cells per well in a 48-well plate in RPMI with 10% FBS. To test for vessel formation, cells were plated at a density of 70,000 cells per well in a 48-well plate onto BD Matrigel Basement Membrane Matrix (BD, Franklin Lakes, NJ USA). Vessel formation was imaged using a Zeiss AxioImager.
In vivo Imaging
OCSCs labeled with Kodak X-SIGHT 761 Nanospheres (Carestream Health Inc, Woodbridge, CT USA) were injected subcutaneously at the left flank (3 × 10⁶ cells) and intra-peritoneally (3 × 10⁶ cells) into female athymic nude mice (NCr-Foxn1nu homozygous, Taconic Farms, Germantown, NY USA). The Carestream In-Vivo MS FX PRO Imaging System was used to obtain X-ray and, concurrently, near-infrared fluorescence (NIRF) images. Animals were anesthetized with 2% isoflurane, and tumors were imaged (X-ray and fluorescence) at days 7, 14, and 21 post inoculation utilizing the Carestream Multimodal Animal Rotation System (MARS). The functionality of the MARS has been previously described1.
Highlights include the ability to capture both X-ray and optical (bright field or fluorescence) images of small animals (i.e., mice) at precise and repeatable positioning angles. This enhances the ability to find the optimized orientation of the animal to minimize the tissue distance between the internal signal and the external detection device (i.e., CCD camera). Once identified, the animal can be easily returned to the exact position to facilitate observation in longitudinal studies.
To begin, the mouse was loaded into the system in a prone position and images were taken at every 10° position of a full clockwise rotation of the mouse to arrive at a complete 360° representation of the optical signal. NIRF images were then co-registered with an X-ray image for anatomic localization. On Day 21, the animals were sacrificed and tumor fluorescence was analyzed ex vivo.
Quantitative analysis of the optical signal capture was completed in Carestream MI software v5.0.5.29 (Carestream Health, Inc., Woodbridge CT). Fluorescence intensity from subcutaneous and intra-peritoneal tumors was measured by creating an automatic ROI thresholded to 30% of each tumor’s maximum intensity and measuring that area’s mean intensity. Fluorescence intensities were normalized to the peak angle of detection, and figures were then created in Microsoft Excel (2007). Images were batch exported as 16-bit tiffs, and overlays were completed in ImageJ software (v1.44).
Results and Discussion
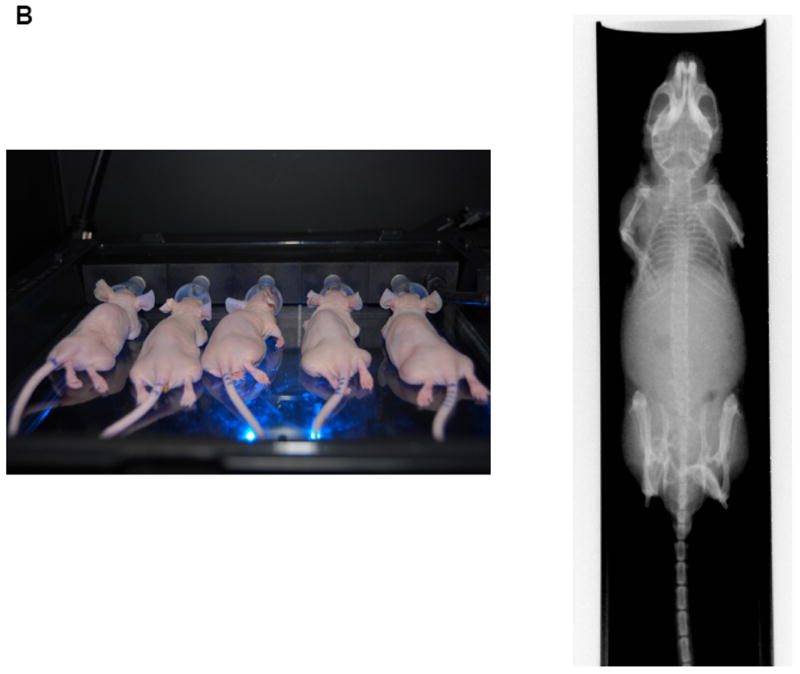
The In-Vivo MS FX PRO system (Carestream Molecular Imaging, Woodbridge, CT) allows for the sensitive, accurate imaging of fluorescent labels in mice while concurrently obtaining X-ray images (Fig. 1A and B). Additionally, the In-Vivo MS FX PRO system can now be used with the Multimodal Animal Rotation System (MARS), which allows for the automatic rotation of the mouse to capture fluorescent signals and concurrent X-rays at specified angles (Fig. 1A). The functionality and integration of this accessory with the In-Vivo MS FX PRO system was originally described by Feke et al. and has been extended here to describe its application to preclinical cancer research7. The system contains three seamless software modules that guide the user through the acquisition of images, separation of individual signal profiles for spectral unmixing, and finally, the compilation of individual two-dimensional images into an .avi movie format for viewing. The acquisition software is programmable such that multiple image capture sequences (i.e., fluorescence followed by X-ray) can be collected at defined angles in as small as 10° increments. The spectral unmixing module provides the user with the ability to model signals from background autofluorescence and subtract them from experimental signals from in vivo probes. Finally, the rotation viewer module provides a quick and easy workflow toward viewing the final overlay.
Figure 1.
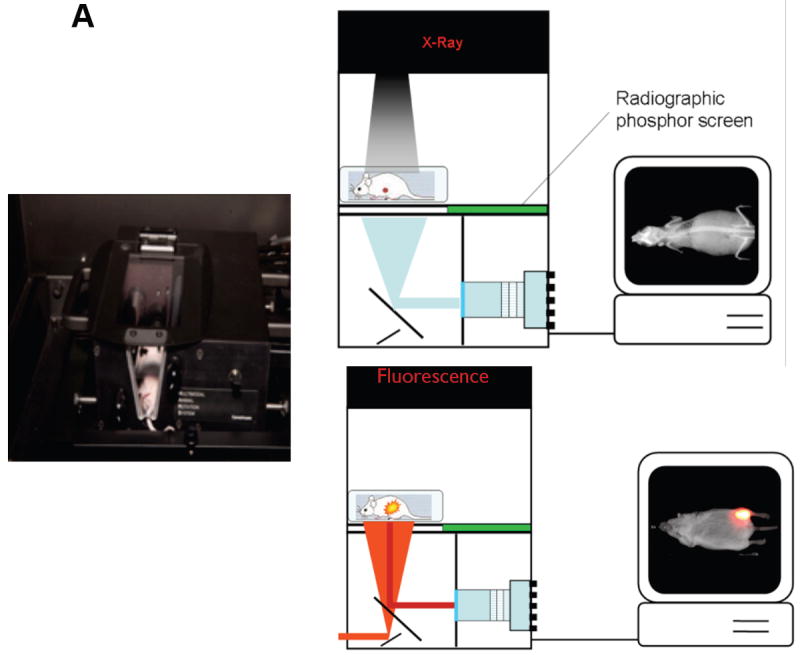
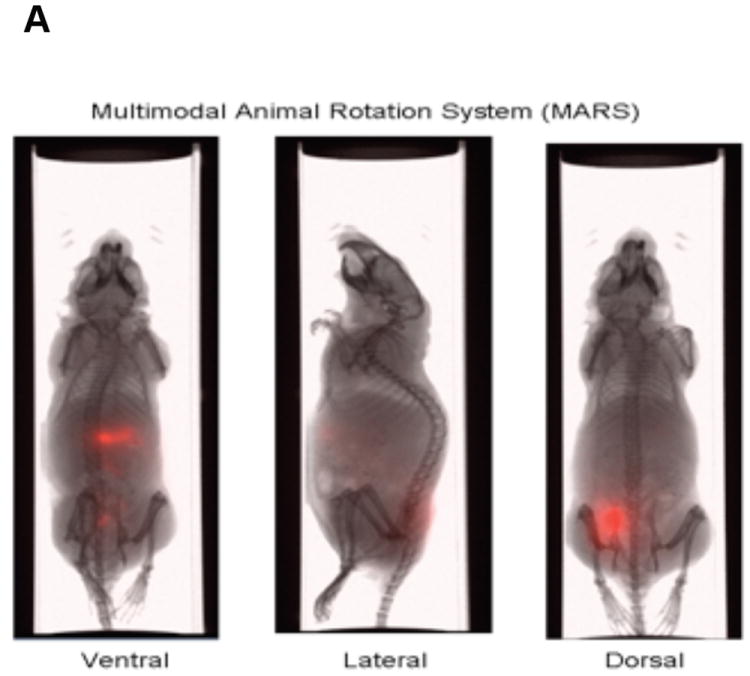
(A) The MARS is fully automated and compatible with the Carestream In-Vivo imaging systems. It provides the ability to rotate an animal 360°, precisely and consistently, facilitating a user’s ability to ensure the optimized position for image acquisition. Schematic showing the In-Vivo MS FX PRO system setup for X-ray imaging (left) and fluorescence imaging (right).
(B) The fluorescent/X-ray chamber can analyze multiple animals and provide sensitive X-ray images.
This system was used in combination with appropriate fluorescent reagents, i.e., Kodak X-SIGHT Nanospheres (Carestream Molecular Imaging), to longitudinally monitor the development and progression of intra-peritoneal tumors. The result was 360° coverage of a mouse while obtaining multispectral data sets (Supplementary video 1). While several good near-infrared (NIR) probes are now available that facilitates deeper penetration of excitation light and greater return of emitted signal to the surface of the skin, identifying and consistently returning to the optimal angle to minimize the tissue depth remains a challenge. We used Kodak X-SIGHT Nanospheres, which are bright latex nanoparticles coated with polyethylene glycol chains that make the nanoparticle water soluble and biocompatible, in conjunction with the MARS to identify human primary ovarian cancer cells labeled with X-SIGHT 761 Nanospheres (X-SIGHT 761 or 761 Nanoparticles), in the intra-peritoneal cavity. The polyethylene glycol chains on the 761 Nanoparticles are terminated with primary amines to facilitate the ability to penetrate into cells without the need for additional conjugation to proteins or peptides.
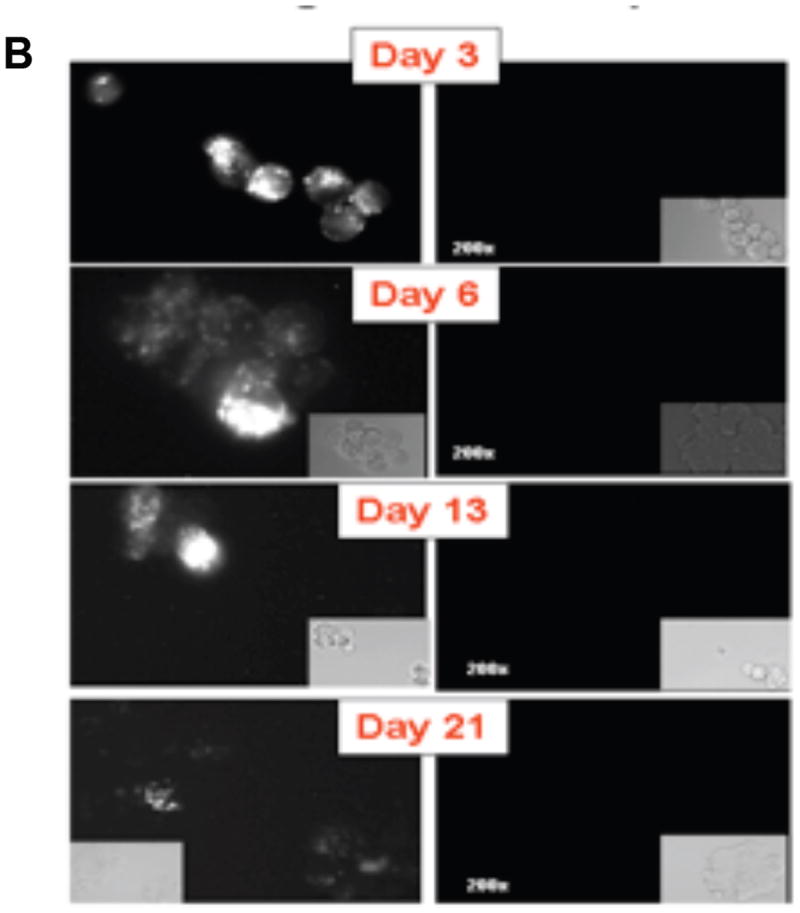
First, we determined whether the nanoparticles loaded with fluorescent dye X-SIGHT 761, would be taken up by mammalian cells and therefore be valuable in monitoring their presence. As shown in Figure 2A, four different cell types, (human embryonic kidney (HEK 293T), ovarian surface epithelial cells (OSE 21i), ovarian cancer spheroid progenitors (SR182), and epithelial ovarian cancer cells (MR182)), were successfully labeled with the X-SIGHT 761 Nanospheres. The labeled cells retained the fluorescent nanospheres label for up to 21 days in culture (Fig. 2B).
Figure 2.
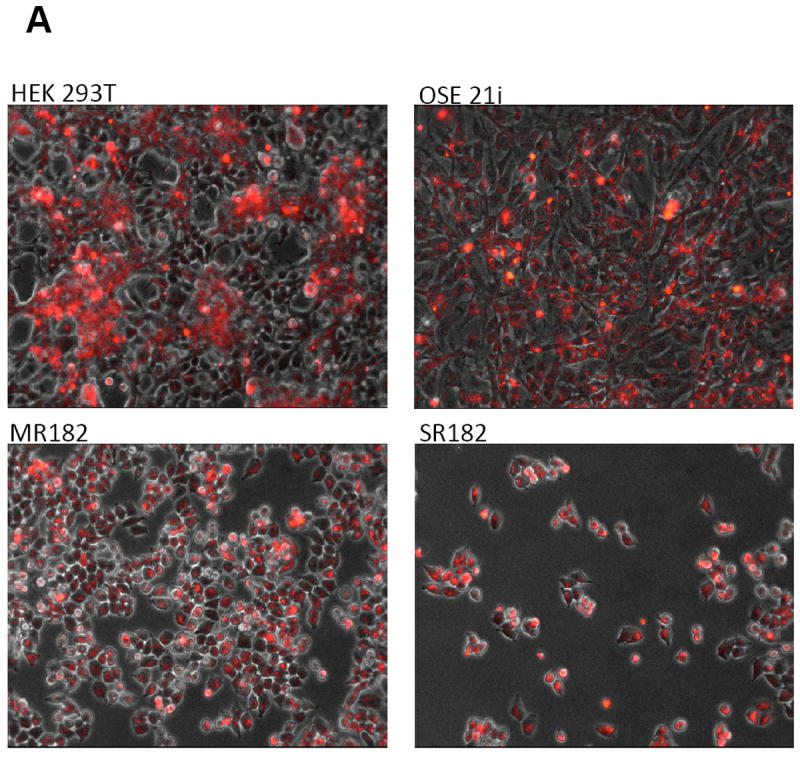
(A) Labeling of cells with X-SIGHT 761 Nanoparticles. Different cell types, including normal cells (ovarian surphase epithelial cells OSE21), as well as cancer cells (MR182 and SR182) are capable of uptaking the labeled nanoparticles and are detectable by fluorescent microscopy.
(B) Labeled nanoparticles are detectable in the cells up to 21 days post labeling.
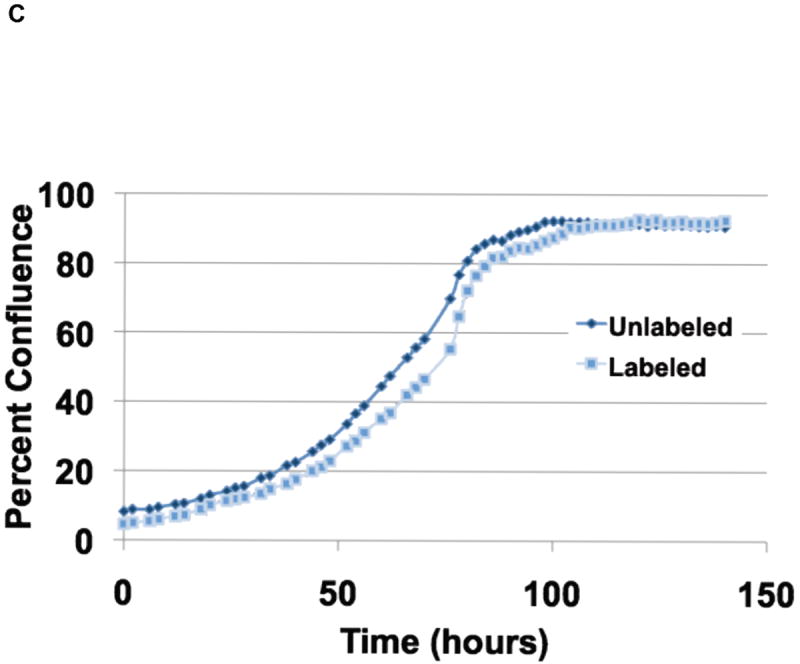
(C) Labeling of cells with X-SIGHT 761 Nanoparticles had no effect on cell growth.
To determine if the X-SIGHT 761 Nanospheres affect the growth rate of cells, we compared the growth of both labeled and unlabeled cells in a real-time imaging system. We found no difference in the growth rate of the X-SIGHT 761 Nanosphere-labeled cells when compared to unlabeled cells (Fig. 2C).
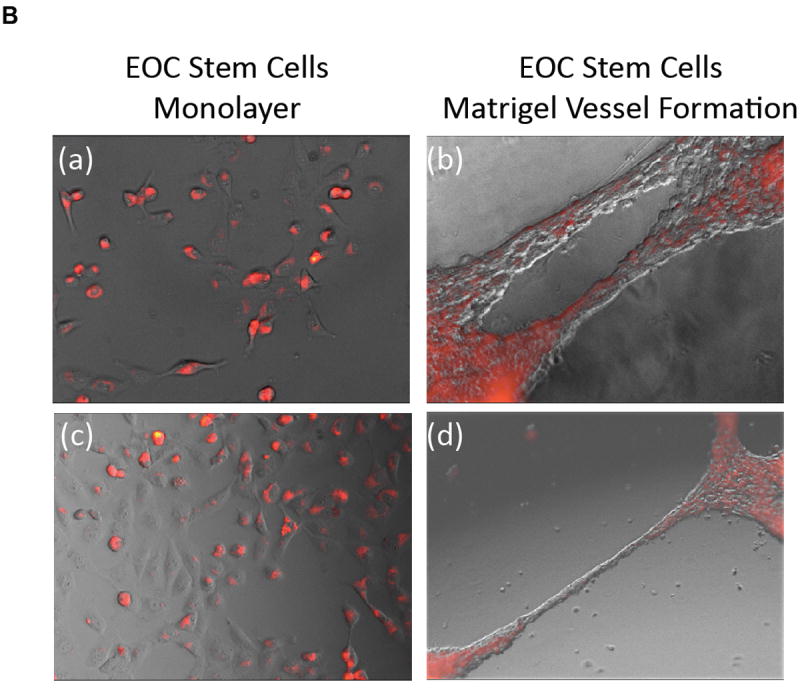
Next we evaluated whether the incorporation of the labeled nanoparticles could affect self-renewal or induce differentiation of ovarian cancer stem cells. Thus, we labeled CD44+ EPC stem cells with X-SIGHT 761 Nanospheres and determined the percentage of CD44+ cells during and after labeling by flow cytometry (Fig. 3A). We did not observe any change in the percentage of CD44+ cells following labeling with X-SIGHT 761 Nanospheres, and the percentage remained without change after 13 days. Further, the maintenance of the stems after labeling was verified by testing the capacity of EOC stem cells to differentiate into endothelial-like cells8. X-SIGHT 761 Nanosphere-labeled EOC stem cells are able to form vessel-like structures when plated upon Matrigel (Fig. 3B).
Figure 3.
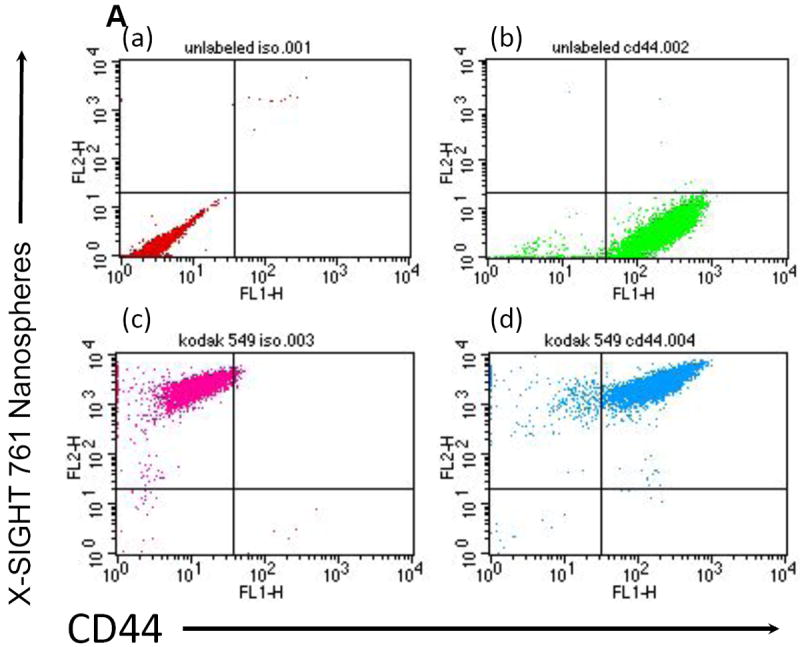
(A) Flow cytometry demonstrates ovarian cancer stem-like cells, labeled with Kodak X-SIGHT Nanospheres, retain CD44 expression. Unlabeled cells (upper left), Kodak X-SIGHT Nanosphere-only labeled cells (upper right), CD44-only labeled (lower left), and both X-SIGHT and CD44 labeled cells (lower right).
(B) Nanosphere-labeled EOC stem cells are able to form vessel-like structures when plated upon Matrigel.
Once established in vitro that cancer stem cells can be labeled and are not affected by X-SIGHT 761 Nanospheres, the ovarian cancer cells were injected both IP and SC into athymic nude mice. At days 7, 14, and 21 post injection, mice were anesthetized and observed under the Carestream In-Vivo MS FX PRO system. The functionality of the MARS includes the ability to capture both X-ray and optical (brightfield or fluorescence) images of small animals, such as mice, at precise and repeatable positioning angles. This enhances the ability to find the optimized orientation of the animal to minimize the tissue distance between the internal signal and the external detection device (i.e., CCD camera). Once identified, the animal can be easily returned to the exact position to facilitate observation in longitudinal studies. To begin, the mouse was loaded into the system (See Fig. 1a) in a prone position, and images were taken at every 10° position in a full clockwise rotation of the mouse to arrive at a complete 360° representation of the optical signal. Near infrared fluorescent (NIRF) images were then co-registered with an X-ray image for anatomic localization. Images were obtained using X-rays and, concurrently, NIRF (Fig. 1a). Fluorescence images were taken at 10° increments and overlaid onto the corresponding X-ray image. Quantitative analysis of the optical signal capture was completed in Carestream MI software v5.0.5.29 (Carestream Health, Inc., Woodbridge, CT). Fluorescence intensity from SC and IP tumors was measured by creating an automatic ROI with a threshold set to 30% of each tumor’s maximum intensity and measuring that area’s mean intensity. Fluorescence intensities were normalized to the peak angle of detection. The imaging sequence begins with the animal in the prone position. A plot of the measured normalized intensity vs. rotation angle clearly defines the optimal position to deliver the greatest signal intensity peak for each day (Fig. 4A and Supplemental Movie).
Figure 4.

(A) Rotational analysis helps to ensure the best angle for imaging deep in vivo signals can be determined and reliably re-established for longitudinal studies.
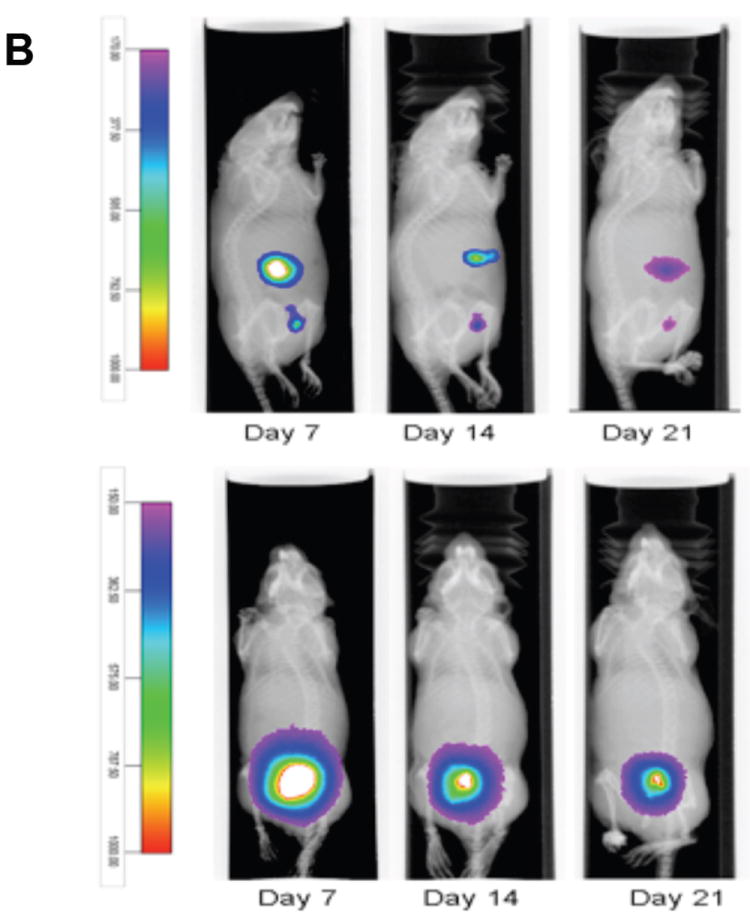
(B) Imaging individual animals longitudinally reduces the number of cohorts necessary and increases statistical accuracy.
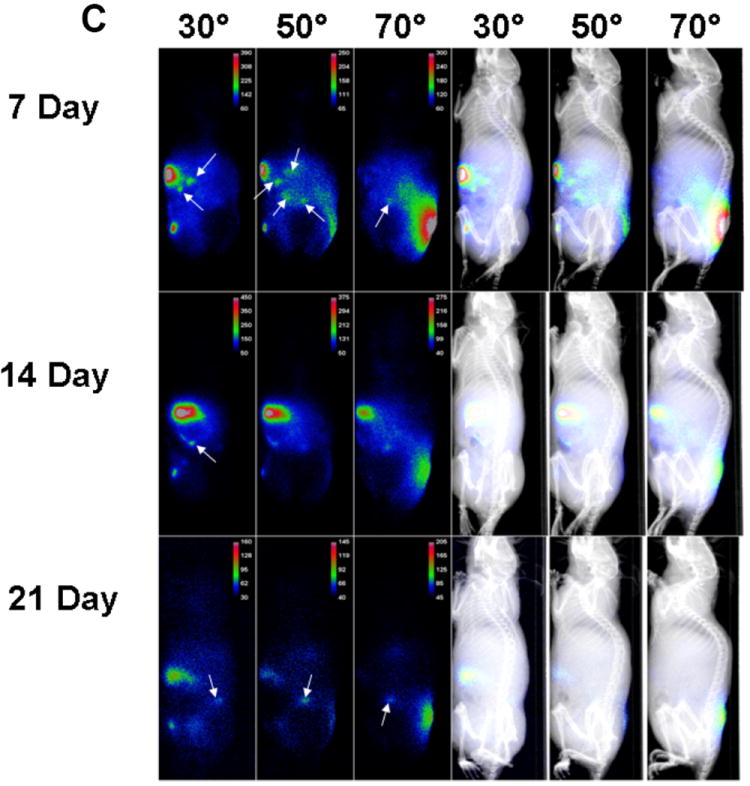
(C) White arrows indicate NIRF masses (tumors). Rotation permits detection of small tumors with low-level fluorescent emissions.
(D) Visual presentation of the localization of subcutaneous and major intra-peritoneal tumors (top) and relative quantitation (bottom).
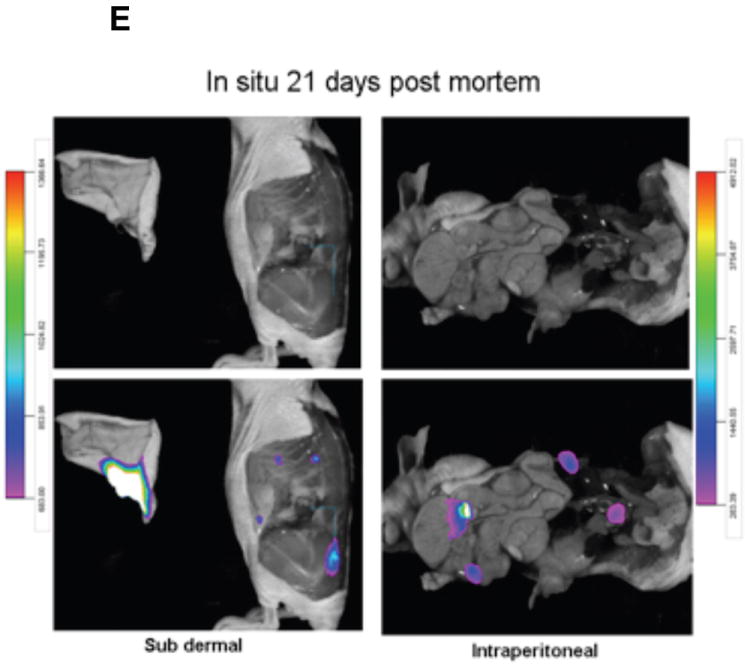
(E) Image overlay provides a useful tool for signal localization for in situ studies as well.
Using the MARS, we were able to observe the presence of tumor cells by ventral and lateral views (Fig. 4B). NIRF emissions produced reliable capture for the longitudinal quantification of the engrafted SC and two major IP tumors out to 21 days post inoculation of tumor cells (Figs. 4B and 4C). The SC tumor was shown to have greatest signal capture at an approximate 150° clockwise rotation of the mouse from a prone starting position (Fig. 4D).
Labeled tumor cells were detected infiltrating the peritoneum (Fig. 4B and 4C). IP tumors had a more narrow range of visualization because they presented with low fluorescence intensity and were located in deeper tissue (Fig. 4D). The optimal signal capture of IP tumor 1 occurred at an approximate 300° clockwise rotation, while IP tumor 2 was best imaged at approximately a 330° clockwise rotation of the mouse from a prone starting position (Fig. 4D). Very small, low-intensity satellite tumors could also be visualized within the peritoneum. These tumors had very narrow ranges of visualization of 20-40°, could not be visualized from a prone position, and would have gone undetected without multiple-angle imaging. Importantly, signals from the labeled X-SIGHT 761 Nanospheres continue to be visible through 21 days post injection (Figs. 4E (in vitro), 4B, and 4C (in vivo)), demonstrating a high capacity for signal retention.
Evaluation of the tumors demonstrates that with both the SC and IP injections, we were able to discern the discrete localization of the labeled cancer cells (Fig. 4E). Together, these data suggest that: (1) ovarian cancer stem cells can be efficiently labeled by fluorescent NIR nanoparticles, (2) this label is maintained in the complex in vivo environment, (3) the signal can be detected up to 21 days using our in vivo imaging system, and (4) a combination of the MARS and nanoparticles allows the in vivo detection of small lesions that otherwise could not be observed.
Supplementary Material
Acknowledgments
This study was supported in part by grants from NCI/NIH RO1CA127913, RO1CA118678, The Janet Burros Memorial Foundation, The Sands Family Foundation and the Discovery To Cure Research Program.
References
- 1.Jemal A, et al. Cancer statistics, 2009. CA Cancer J Clin. 2009;59:225–249. doi: 10.3322/caac.20006. [DOI] [PubMed] [Google Scholar]
- 2.Schwartz PE. Current diagnosis and treatment modalities for ovarian cancer. Cancer Treat Res. 2002;107:99–118. doi: 10.1007/978-1-4757-3587-1_4. [DOI] [PubMed] [Google Scholar]
- 3.Bast RC, Jr, Hennessy B, Mills GB. The biology of ovarian cancer: new opportunities for translation. Nat Rev Cancer. 2009;9:415–428. doi: 10.1038/nrc2644. [DOI] [PMC free article] [PubMed] [Google Scholar]
- 4.Alvero AB, et al. Molecular phenotyping of human ovarian cancer stem cells unravels the mechanisms for repair and chemoresistance. Cell Cycle. 2009;8:158–166. doi: 10.4161/cc.8.1.7533. [DOI] [PMC free article] [PubMed] [Google Scholar]
- 5.Aldo PB, et al. A novel three-dimensional in vitro system to study trophoblast-endothelium cell interactions. Am J Reprod Immunol. 2007;58:98–110. doi: 10.1111/j.1600-0897.2007.00493.x. [DOI] [PMC free article] [PubMed] [Google Scholar]
- 6.Alvero AB, et al. Stem-like Ovarian Cancer Cells can Serve as Tumor Vascular Progenitors. Stem Cells. 2009;27:2405–2413. doi: 10.1002/stem.191. [DOI] [PMC free article] [PubMed] [Google Scholar]
- 7.Feke G, et al. Harnessing multimodallity to enhance quantification and reproducivility of in vivo molecular imaging data. Nature Methods. 2008;5 [Google Scholar]
- 8.Alvero AB, et al. Stem-like ovarian cancer cells can serve as tumor vascular progenitors. Stem Cells. 2009;27:2405–2413. doi: 10.1002/stem.191. [DOI] [PMC free article] [PubMed] [Google Scholar]
Associated Data
This section collects any data citations, data availability statements, or supplementary materials included in this article.