

Abstract
Relatively little is known about the molecular basis and control of midbrain dopamine release. Using high fidelity imaging of pHluorin-tagged vesicular monoamine transporter 2 we show exocytosis is more loosely coupled to calcium entry than in fast synapses. In ventral tegmental area neurons this allows exocytosis to be efficiently controlled by a native fast calcium buffer, Calbindin-D28k, maintaining a lower vesicular release probability compared to substantia nigra neurons.
The human brain contains only ~600,000 dopamine (DA) neurons and a large fraction of these originate in the midbrain substantia nigra pars compacta (SN; nucleus A9), and ventral tegmental area (VTA; nucleus A10) which respectively modifies neuronal circuit function in the basal ganglia as well as the meso-cortical and meso-limbic pathways. Despite the clinical significance of dopaminergic modulation (1–3), relatively little is known about molecular control of dopamine release itself, especially the potential difference and molecular determinants in dopamine release characteristics between VTA and SN neurons. One unique feature of dopaminergic transmission is that it is mediated by slow GPCR-mediated signaling. In this study, we took advantage of an optical assay employing pHluorin, a variant of GFP whose fluorescence is quenched by protonation with a pKa = 7.1 (4–5), to measure exocytosis in DA neurons.
pHluorin-tagged vesicular monoamine transporter 2 (vMAT-pHluorin) (6) displays low surface fractions (6.2 ± 2.1%, N = 7) when expressed in mid-brain DA neurons, permitting measurements of single action potential (AP) responses (Fig. 1a) at fast time resolution. The size of the exocytic response is a reflection of the size of the readily-releasable pool (RRP) and vesicular release probability Pv (Supplementary Fig. 1). Pv in turn is determined by the likelihood that the calcium sensor for exocytosis will bind sufficient Ca2+ to trigger exocytosis. The relative coupling of calcium channels and sites of exocytosis is thus a key determinant of Pv. In DA nerve terminals, application of EGTA-AM leading to a ~55% drop in measured AP-triggered Ca2+ signal led to a 65% drop in exocytosis, while in more conventional fast hippocampal (HP) terminals a similar reduction in Ca2+ signal led to a more modest (~35%) drop in exocytosis (Fig. 1). Thus exocytosis in DA terminals is more loosely coupled to calcium influx than in hippocampal neurons.
Figure 1. Synaptic vesicles are loosely coupled to calcium entry in DA neurons.

(a) Difference (ΔF) images of vMAT-pHluorin responses in DA neuron boutons to a single AP stimulus (left) and NH4Cl perfusion (right), scale bar: 5 μm. (b) Average vMAT-pHluorin and vGlut-pHluorin responses to a single AP stimuli before and after EGTA-AM treatment (n = 4 trials), scale bar: 400 ms. (c) Single AP ΔF Fluo5F responses of VAMP-mCherry expressing DA and hippocampal boutons (upper, Scale bar: 400 ms) and their corresponding kinetics ( lower panels scale bar: 100 ms) before and after EGTA-AM treatment. (d) EGTA treatment preferentially suppressed phluorin responses in DA terminals (68 ± 6 %) compared to HP terminals (38 ± 5%) (p = 0.004) for similar suppression of calcium signals (p = 0.74), (56% ± 6 suppression in DA; 54% ± 4 suppression in HP).
VTA DA neurons are known to be enriched compared to SN neurons in the fastest-known (kon ~8.0 × 10⁷/M*s) endogenous calcium buffering protein, Calbindin-D28k (CB) (7–9). In dissociated DA neurons derived from VTA and SN (mixed culture), we found that CB immunoreactivity varied over a 300-fold range (Fig. 2a and b) while DA neurons extracted from more restricted VTA-enriched mid-brain dissections (Fig 2c) showed a significant enrichment in CB (p = 0.007, K-S test) (Fig. 2d). In contrast, at synapses formed between dissociated hippocampal neurons CB expression was ~85% lower than in VTA DA neurons (Supplementary Fig. 2).
Figure 2. Endogenous CB regulates Pv in DA neurons.
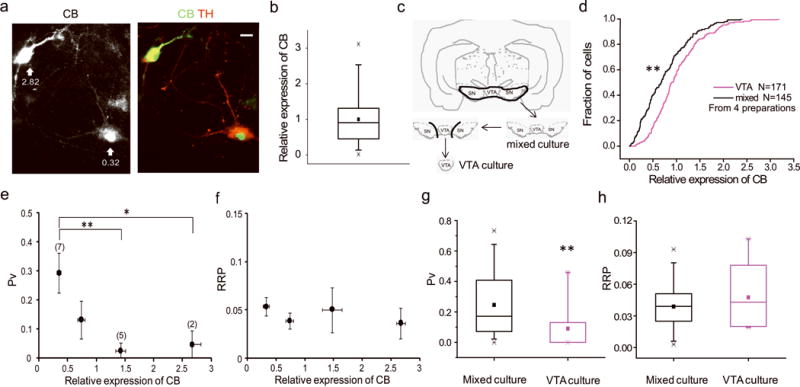
(a) Midbrain neurons were stained for CB and Tyrosine hydroxylase (TH). Numbers with arrows indicate the relative expression level of CB (methods), scale bar: 10 μm. (b) Box-whisker plot (methods) showing the distribution of CB expression in 70 (from 2 preparations) TH positive cells. (c) Cross section showing VTA-enrichment ventral midbrain dissection procedure. (d) Cumulative distribution of relative CB levels in DA cells from VTA and mixed cultures. (e, f) Pv (e) and RRP (f) values binned across CB expression level. Pv values were significantly different between 1st and 3rd (p = 0.007) and 4th (p = 0.03) bin. (g, h) Comparison of Pv (g) and RRP (h) in neurons from mixed and VTA culture. Pv was significantly lower (p = 0.008) in VTA neurons.
We previously developed protocols to estimate the size of the readily-releasable pool (RRP, expressed as a fraction of the total recycling pool) and the probability that a vesicle in the RRP will undergo exocytosis upon AP stimulation (Pv) using pHluorin-tagged SV proteins (10). Here using vMAT-pHluorin we used these approaches to measure RRP sizes and Pv in DA neurons (Supplementary Fig. 1, 3). Our experiments revealed that Pv and RRP were highly variable across DA cells with a mean value of 0.25 ± 0.04 (ranging from 0 ± 0.02 to 0.73 ± 0.01) and 0.039 ± 0.04 (ranging from 0.003 ± 0.002 to 0.083 ± 0.01, Supplementary Fig. 1), respectively. Retrospective CB immunocytochemistry for each cell in which these parameters were determined revealed a strong inverse correlation between CB abundance and Pv (Fig 2e) but no correlation with RRP (Fig. 2f): DA neurons with the lowest CB levels had an average Pv = 0.30 ± 0.07 and those with the highest CB levels had a Pv = 0.05 ± 0.05 (p = 0.03). Similarly Pv values were on average significantly lower in VTA-enriched DA neurons preparations (Pv = 0.09 ± 0.04) compared to VTA/SN cultures (Pv = 0.25 ± 0.04, p = 0.008, Fig. 2g) while RRP sizes were similar (Fig. 2h).
To confirm the veracity of the correlation of Pv with CB abundance we explicitly manipulated CB levels in VTA DA neurons using either knockdown (KD) or overexpression (Supplementary Fig. 4). In DA neurons expressing an shRNA targeting CB, expression levels were reduced to 0.13 ± 0.03 of control while neurons transfected with a cDNA encoding full length rat CB increased expression to 3.16 ± 0.55 compared to control. These expression levels were similar to the CB content of DA cells at the extreme ends of the endogenous expression level distribution (Fig. 2b). Consistent with the correlation of Pv with endogenous CB levels, CB KD neurons exhibited a ~4-fold greater single AP exocytic response compared to control while overexpression of CB reduced the single AP responses on average ~10-fold (Fig. 3a). Similarly, Pv increased substantially to 0.30 ± 0.04 in VTA CB KD neurons compared to control (0.11 ± 0.04, p = 0.006) and could be restored to near WT levels (0.14 ± 0.05, p = 0.02) by reintroduction of an shRNA-insensitive CB expression plasmid (Fig. 3b). In contrast knockdown of CB in hippocampal neurons had no significant impact on Pv (Supplementary Fig. 2). The increase in Pv by CB depletion did not result from an increase in resting calcium levels (Supplementary Fig. 5). RRP sizes were not impacted by loss of CB (p = 0.32, Fig. 3c), however overexpressing of CB frequently resulted in responses that appeared only after a long delay during the stimulus period with a much shallower slope in exocytosis preventing us from accurately extracting the RRP size and hence Pv (data not shown).
Figure 3. CB knockdown in VTA DA neurons enhanced Pv and synaptic depression during AP bursts.
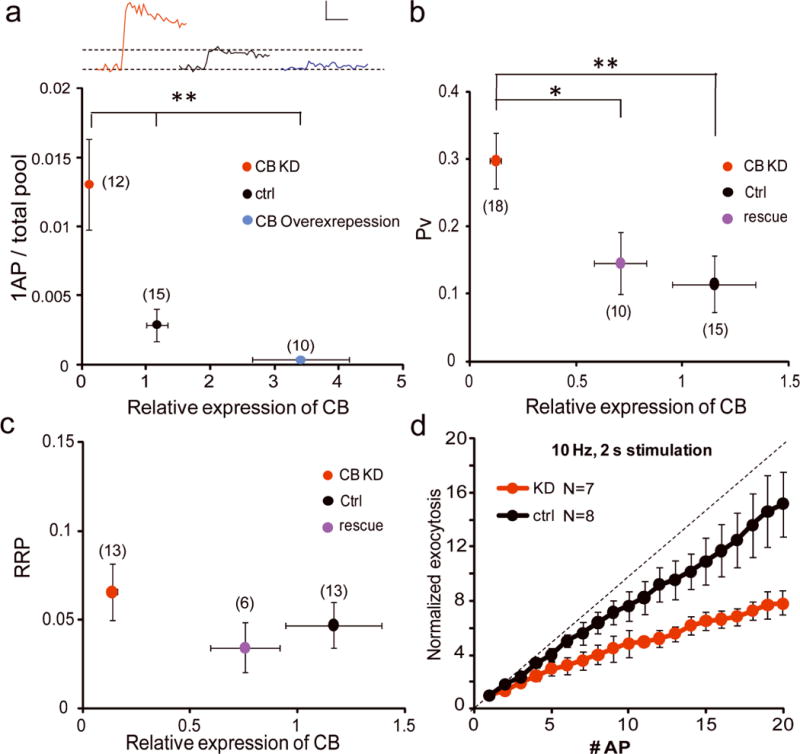
(a) Single AP responses are significantly higher and lower in CB KD and overexpression compared to control, 3-way ANOVA: p < 0.0001. Inset, representative 1 AP responses for each condition, scale: 0.5% TP, 50 ms. (b, c) Pv (b) and RRP (c) measured from control, CB KD and CB KD with rescue neurons plotted against relative expression of CB. (d) Amount of exocytosis relative to the 1st AP response plotted against AP number (straight line shows zero depression) in CB KD DA and control DA neurons.
To examine the role of CB in a more physiological regime, we challenged control VTA DA neurons and CB knockdown VTA DA neurons with 20 APs at 10 Hz. Analysis of the cumulative vMAT-pHluorin signal normalized to first stimulus response amplitude showed that in the absence of CB, exocytic responses of VTA neurons exhibited significant depression by the 2nd or 3rd AP compared to controls. By the 20th stimulus the net depression was ~2.5-fold greater in CB KD DA neurons compared to control (Fig. 3d). Similar results were obtained using 20 Hz stimulation (data not shown) and demonstrate that CB’s ability to lower release probability allows them to more faithfully provide graded synaptic outputs during brief stimulus trains in VTA neurons.
The differential physiological control conveyed by CB in VTA versus SN neurons may also be important in pathological states such as Parkinson’s disease where the death of SN DA neurons is due in part to cytosolic dopamine, oxidative stress, calcium toxicity and alpha-synuclein accumulation (11–13). Neurons with no or low expression of CB were found to be more prone to death in disease development. Therefore CB mediated calcium buffering was suggested as an important mechanism that provides protection to VTA neurons. In summary, our experiments identified an important control element that dictates exocytosis properties in VTA DA neurons, one that in the future may serve as an important therapeutic target independent of SN function.
Methods
Cell culture and immunocytochemistry
Dissociated midbrain neuronal cultures were prepared from P0–1 Sprague-Dawley rat pups to provide either a mixture of VTA and SN or an enriched VTA DA neuron population. For the latter we used a narrow section of midbrain adjacent to the midline while for the mixed cultures (VTA + SN) a wider section extending beyond the midline was dissected (Fig 2c). Dissected tissue was then prepared according to our previously published protocol (14) plated at a cell density of 130,000 cells/cm2) and grown in the medium supplemented with GDNF (10 ng/mL). Hippocampal cultures were prepared as described before (15). Following experiments all midbrain cultures were stained for the DA neuron specific marker, tyrosine hydroxylase (TH). Neurons were fixed in PFA (containing 4% paraformaldehyde (EMS, PA, USA) and 4% sucrose) for 10 min, permeabilized in 0.2% Triton, and blocked with 5% BSA for 40–60 min in 37°C. Anti-TH antibody (monoclonal, Calbiochem) was diluted at 1:1000 with 5% BSA and incubated with the cell at 37°C for 1 hr. After 5 min wash with 1 × PBS, cells where then incubated with 1:1000 dilution of Alexa Fluor® 546 secondary antibody and anti-GFP, Alexa Fluor® 488 conjugate (Invitrogen). For triple staining, mouse anti-TH (1:1000, Calbiochem) with Alexa-633 (1: 500, Invitrogen), chicken anti-GFP (1:1000, Abcam) with Alexa-488 (1: 1000, Invitrogen) and rabbit anti-Calbindin-D28k (1:1000, Millipore) with Alexa-546 (1: 1000, Invitrogen) were used. For comparison of CB immunoreactivity in VTA and hippocampal cultures, Rabbit anti-CB was taken from the same reaction tube whereas mouse anti-TH was added for VTA culture and mouse anti-MAP2 was added for hippocampal culture. Only midbrain neurons identified as TH-positive were included in the analysis in this report.
Constructs and transfection
A 29mer hairpin shRNA targeting Calbindin-D28K was engineered into the pRS vector driven by U6 promoter using the following targeting sequence: 5′-AAGCAAACAAGACCGTGGATGATACGAAA-3′. The following primers were used to generate the rescue CB construct by using QuikChange® II site-directed mutagenesis kit from Stratagene: 5′-GCTAGAGAAAGCCAACAAGACGGTGGACGATACGAAACTTG-3′, and 5′-CAAGTTTCGTATCGTCCACCGTCTTGTTGGCTTTCTCTAGC-3′. pcDNA3.1-Calbindin-D28k was a kind gift from Dr. Amy Lee at University of Iowa. YC3.60 was obtained from Atsushi Miyawaki’s group in Japan. All constructs were sequenced before transfection. At DIV 3, neurons were transfected using calcium phosphate and waited for 10 days before all experiments were conducted. 10 ng/mL GDNF was added per dish after transfection to help the growth of dopaminergic neurons.
Optical setup and imaging
For live cell imaging, cells were mounted on a custom-made laminar-flow stimulation chamber with constant perfusion (at a rate of ~0.2–0.3 mL/min) of a Tyrode’s salt solution containing (in mM) 119 NaCl, 2.5 KCl, 2 CaCl2, 2 MgCl2, 25 HEPES, 30 glucose, 10 μM 6-cyano-7-nitroquinoxaline-2,3-dione (CNQX), and 50 μM D, L-2-amino-5-phosphonovaleric acid (AP5) and buffered to pH 7.4. All chemicals were purchased from Sigma except for bafilomycin (1 μM, Calbiochem) and Magnesium Green (MgGreen) dye (20 μM, Invitrogen). Temperature was clamped at 30.0 °C at the objective throughout the experiment. Field stimulations were delivered at 10 V/cm by A310 Accupulser and A385 stimulus isolator (World Precision Instruments). 1 ms pulse was used to evoke single action potentials. Images were acquired using a highly sensitive, back-illuminated EM-CCD camera (iXon+ Model # DU-897E-BV, Andor Corp., CT, USA). Zeiss Axiovert 200 microscope was modified for laser illumination. A solid-state diode pumped 488 nm laser was shuttered using acoustic-optic tunable filters (AOTF) during non-data-acquiring periods. pHluorin fluorescence excitation and collection was through a 40X 1.3 NA Fluar Zeiss objective using 515–560 nm emission filter and 510 nm dichroic filters (Chroma) and a 1.6X Optivar. 10 Hz sampling were used for 10 Hz stimulations and 100 Hz sampling for 100 Hz stimulation (all the RRP measurements). For calcium imaging, Fluo-5F 9 μM or Magnesium Green 20 μM was loaded for 10 min and washed off for over 20 min in Tyrodes to reduce background. For calcium imaging with Fluo-5F, measurements were taken in Tyrodes containing 4 mM Ca2+. 1000 Hz sampling (0.74 or 0.72 ms exposure at frame transfer) was used at 3 pixel (equivalent to 3/4 μm) line scan to obtain enough temporal resolution for capturing the peak signal after EGTA-AM treatment. Normally, there are 1 to 2 responding boutons in the imaging field which co-localize with VAMP-mCherry. A test pulse (3 AP @ 3 Hz) was given before each experiment to make sure that single AP elicited calcium signal does not saturate the dye. MgGreen was preferred for imaging Ca2+ entry at 100 Hz, 0.2 s stimulation because of its linearity over a large range of stimulation. Signals were sampled at 100 Hz (9.74 or 9.72 ms exposure at frame transfer) with 1 μs delay so that each data point corresponds to the accumulated [Ca2+] at each stimulus. For resting calcium measurement with YC 3.60 (16), the indicator was excited by 430 nm laser with a single exciter (425/D40) and dichroic (at 460 nm). 2 emitters (480/D40 and 550/D50) were switched manually by a filter slider. YFP and CFP emissions were taken alternatively with 3 min spacing at 20 Hz, 0.5 s stimulations to monitor the viability and stability of the neuron. Immunofluorescence data was acquired using the identical optical system with exception that 532 nm and 633 nm laser sources were also used for illumination of alternate fluorescence channels.
Data analysis
Images were analyzed in ImageJ (http://rsb.info.nih.gov/ij/) using a custom-written plugin (http://rsb.info.nih.gov/ij/plugins/time-series.html). 2 μm diameter circular ROIs were placed on all varicosities that appear stable throughout all trials and responded to a maximal stimulus. To determine the readily releasable pool size, a “sliding window” method was used to find the plateau during accumulated pHluorin response (10). A plateau representing the RRP size was identified as the largest data window where the slope of ΔF v.s. AP number was not significant. If there was more than one window of the same size where this condition was met, we used the one that came first during stimulation. To determine the RRP size, we averaged the ΔF values within the identified window. To measure single AP response, 7–15 trials were given repetitively at about 30 s interval. By averaging, we were able to obtain a pHluorin response (for all the stable boutons in the field) with sufficient signal-to-noise to identify the rise of the fluorescence (ΔF) which is over 2X of the baseline noise (standard deviation). We consider a cell “no response” when ΔF is under 2X of the baseline noise of the averaged response and assign it “ΔF = 0”, and hence, Pv = 0. Calbindin-D28k staining was measured at the cell body and corrected by local background. Fluorescence intensities measurements for Calbindin-D28k staining were corrected for a small (13.8%) bleed through from the 633 nm channel used for TH staining. In Figure 2a, b, we took the immunoreactivity at the cell body for each TH positive cell after background subtraction and bleed through correction, and normalized it to the average value (taken as 1) from the whole sample obtained using the same calculation. In Figure 2d and Supplementary Figure 4, CB levels were calculated in the same way except that they were then normalized to the average CB expression in VTA DA neurons. In other figures where retrospective immunostaining was carried out to determine the relative expression of CB of the tested cell, we randomly sampled 4~8 TH positive neurons in the same and nearby fields and took that to represent the whole sample. All data presented as Mean ± S.E.M. Student t test (2-tail) was used for statistical tests unless otherwise noted. Box-whisker plot describes the following statistics: box, 25–75%; whisker, 5% and 95%; line, median; filled square, mean; star signs, min and max.
Supplementary Material
Acknowledgments
We wish to thank Robert Edwards (UCSF) for generously providing VMAT-pHluorin, Amy Lee (University of Iowa) for providing pcDNA3.1-Calbindin-D28k, Atsushi Miyawaki (Riken) for providing CY3.60 and members of the Ryan lab for helpful discussions. This work was supported by funds from NIDA (DA0101540) and NIMH (MH085783).
Footnotes
Author contributions
P-Y Pan and TA Ryan designed the experiments; P-Y Pan performed the experiments; P-Y Pan and TA Ryan analyzed the data and wrote the paper.
References
- 1.Grace AA. Gating of information flow within the limbic system and the pathophysiology of schizophrenia. Brain Res Brain Res Rev. 2000;31:330–341. doi: 10.1016/s0165-0173(99)00049-1. [DOI] [PubMed] [Google Scholar]
- 2.Hornykiewicz O. Biochemical aspects of Parkinson’s disease. Neurology. 1998;51:S2–S9. doi: 10.1212/wnl.51.2_suppl_2.s2. [DOI] [PubMed] [Google Scholar]
- 3.Cicchetti F, Prensa L, Wu Y, Parent A. Chemical anatomy of striatal interneurons in normal individuals and in patients with Huntington’s disease. Brain Res Brain Res Rev. 2000;34:80–101. doi: 10.1016/s0165-0173(00)00039-4. [DOI] [PubMed] [Google Scholar]
- 4.Sankaranarayanan SG, De Angelis DA, Rothman JE, Ryan TA. The use of pHluorins for optical measurements of presynaptic activity. Biophys J. 2000;79:2199–208. doi: 10.1016/S0006-3495(00)76468-X. [DOI] [PMC free article] [PubMed] [Google Scholar]
- 5.Sankaranarayanan S, Ryan TA. Real-time measurements of vesicle-SNARE recycling in synapses of the central nervous system. Nat Cell Biol. 2000;2:197–204. doi: 10.1038/35008615. [DOI] [PubMed] [Google Scholar]
- 6.Onoa B, Li H, Gagnon-Bartsch JA, Elias LA, Edwards RH. Vesicular monoamine and glutamate transporters select distinct synaptic vesicle recycling pathways. J Neurosci. 2010;30:7917–7927. doi: 10.1523/JNEUROSCI.5298-09.2010. [DOI] [PMC free article] [PubMed] [Google Scholar]
- 7.Liang CL, Sinton CM, Sonsalla PK, German DC. Midbrain dopaminergic neurons in the mouse that contain calbindin-D28k exhibit reduced vulnerability to MPTP-induced neurodegeneration. Neurodegeneration. 1996;5:313–318. doi: 10.1006/neur.1996.0042. [DOI] [PubMed] [Google Scholar]
- 8.Schwaller B. Cytosolic Ca2+ buffers. Cold Spring Harb Perspect Biol. 2010;2:a004051. doi: 10.1101/cshperspect.a004051. [DOI] [PMC free article] [PubMed] [Google Scholar]
- 9.Faas GC, Raghavachari S, Lisman JE, Mody I. Calmodulin as a direct detector of Ca2+ signals. Nat Neurosci. 2011;14:301–304. doi: 10.1038/nn.2746. [DOI] [PMC free article] [PubMed] [Google Scholar]
- 10.Ariel P, Ryan TA. Optical mapping of release properties in synapses. Front Neural Circuits. 2010;4:18. doi: 10.3389/fncir.2010.00018. [DOI] [PMC free article] [PubMed] [Google Scholar]
- 11.Conway KA, Rochet JC, Bieganski RM, Lansbury PT., Jr Kinetic stabilization of the alpha-synuclein protofibril by a dopamine-alpha-synuclein adduct. Science. 2001;294:1346–1349. doi: 10.1126/science.1063522. [DOI] [PubMed] [Google Scholar]
- 12.Nedergaard S, Flatman JA, Engberg I. Nifedipine- and omega-conotoxin-sensitive Ca2+ conductances in guinea-pig substantia nigra pars compacta neurones. J Physiol. 1993;466:727–747. [PMC free article] [PubMed] [Google Scholar]
- 13.Sulzer D. Multiple hit hypotheses for dopamine neuron loss in Parkinson’s disease. Trends Neurosci. 2007;30:244–250. doi: 10.1016/j.tins.2007.03.009. [DOI] [PubMed] [Google Scholar]
- 14.Mani M, Ryan TA. Live Imaging of Synaptic Vesicle Release and Retrieval in Dopaminergic Neurons. Front Neural Circuits. 2009;3:3. doi: 10.3389/neuro.04.003.2009. [DOI] [PMC free article] [PubMed] [Google Scholar]
- 15.Kim SH, Ryan TA. CDK5 serves as a major control point in neurotransmitter release. Neuron. 2010;67:797–809. doi: 10.1016/j.neuron.2010.08.003. [DOI] [PMC free article] [PubMed] [Google Scholar]
- 16.Nagai T, Yamada S, Tominaga T, Ichikawa M, Miyawaki A. Expanded dynamic range of fluorescent indicators for Ca(2+) by circularly permuted yellow fluorescent proteins. Proc Natl Acad Sci U S A. 2004;101:10554–10559. doi: 10.1073/pnas.0400417101. [DOI] [PMC free article] [PubMed] [Google Scholar]
Associated Data
This section collects any data citations, data availability statements, or supplementary materials included in this article.