

Abstract
Background
Studies incorporating direct comparisons across all phases of bipolar (BP) disorder are needed to elucidate the pathophysiology of bipolar disorder. However, functional neuroimaging studies that differentiate bipolar mood states from each other and from healthy subjects are few and have yielded inconsistent findings.
Methods
One hundred five unmedicated adults were recruited: 30 with current bipolar depression (BPD), 30 with current bipolar hypomania or mania (BPM), 15 bipolar euthymic (BPE), and 30 healthy control subjects (HC). All subjects were diagnosed with DSM-IV BP (type I or II) using a structured clinical interview. Groups were age- and gender-ratio matched. In 3T functional magnetic resonance imaging experiments, subjects completed a negative facial emotion matching task.
Results
Bipolar euthymic and BPD groups exhibited increased amygdala activation compared with HCs in response to the negative faces; however, in the BPM group, this increase was not seen. Conversely, both BPE and BPM groups had increased activation in the insula relative to HCs, but in the BPD group, this effect was not seen. All three BP groups exhibited increased activation of the putamen compared with HCs. In the cortical areas, the BPM group exhibited decreased left lateral orbitofrontal cortex activation compared with both BPEs and HCs, increased dorsal anterior cingulate cortex activation compared with the BPD group, and increased dorsolateral prefrontal cortical activation compared with all other groups.
Conclusions
Both state- and trait-related abnormalities in corticolimbic activation were seen in response to the negative facial emotion processing in a large sample of unmedicated adults across BP mood states.
Keywords: Bipolar disorder, depression, emotion processing, euthymia, fMRI, mania, MRI, neuroimaging
To optimize treatments for the various phases of bipolar (BP) disorder, there is a need to differentiate the pathophysiology between mood states. Among functional neuroimaging studies in which the depressed phase of BP illness has been characterized using negative emotional (fearful, sad, angry) processing tasks, findings have consistently shown increased amygdala (1,2) and ventral prefrontal cortical activation (2) and decreased activation of dorsal cortical regions such as the dorsolateral prefrontal cortex (DLPFC) (2). Specifically, studies have reported: 1) increased subcortical, orbitofrontal, and ventral cortical responses to sad faces in euthymic and depressed BP adult and adolescent subjects (3-5); 2) reduction in DLPFC activation (6); and 3) an increase in amygdala activation in response to fearful facial affect (6). More recently, functional connectivity was found to be abnormally increased between the amygdala and orbitofrontal cortex (OFC) when collected during a sad facial emotion processing task (7). Thus, individuals with bipolar depression have been shown to demonstrate hyperactivation in limbic structures during negative emotion processing, likely arising from aberrant cortical homeostatic mechanisms.
Functional neuroimaging studies of BP mania have been less consistent and have shown several patterns of activation across cortical and limbic regions in response to tasks involving negative emotional stimuli, when compared with healthy or euthymic individuals. Increases in activation have been seen in ventrolateral PFC (8), caudate (9), posterior insula (10), and fusiform gyrus (11) in response to negative emotional stimuli. Conversely, patterns of decreased cortical activation have been reported in dorsal and ventral PFC (6,12), bilateral OFC (10,13), inferior frontal gyrus (14), and right frontopolar cortex (14). Activations in the anterior cingulate cortex (ACC) subregions during mania are less clear, with reports of attenuation (10), normal activation (15), and increased activation (2,9,14) relative to euthymics and/or control subjects. Studies also highlight the amygdala as a key region in the processing of emotionally salient stimuli. However, amygdala activation patterns are unclear in mania. Decreased (10,12,16), as well as increased (17), activation of the amygdala have been reported during negative facial emotion processing in mania.
Individuals in the euthymic or remitted phase of bipolar disorder have been studied less often with functional neuroimaging methods, particularly in the context of negative emotional stimuli. Hassel et al. (18) found decreased left DLPFC activity and elevated striatal activation in response to fearful faces in euthymic participants versus control subjects. Similarly, during fearful face processing, ventral ACC activation was significantly lower in a remitted group compared with control subjects (19). Compared with control subjects, euthymic participants showed hyperactivation in inferior PFC regions but no difference in amygdala activations during a fearful and angry facial emotion processing task (20). Thus, preliminary work suggests that dysfunctional dorsal and ventral cortical systems implicated in appraisal, encoding, and regulation of emotion may represent a mechanistic failure seen in BP disorder, even in the absence of an acute mood episode.
Fewer studies have directly compared activation patterns across mood states. In one such study, medicated BP participants in all mood states showed reduced activation in the bilateral OFC on a passively viewed emotional masking task (21). In this study, activation in euthymic and manic participants was significantly reduced compared with that of both control subjects and depressed groups in the bilateral amygdala and right temporal pole (21). In the right DLPFC, all groups showed an increased level of activation compared with the manic group (21). Using a nonaffective Stroop task, Blumberg et al. (13) showed a distinct area of decreased ventral PFC activation in BP participants compared with healthy subjects that appeared to be independent of mood state. Manic patients showed decreased right ventral PFC activation, whereas depressed patients showed increased activation, compared with euthymic patients (13). Overall, it appears that a number of imaging studies in BP disorder have implicated prefrontal cortex and amygdala in aberrant facial processing. While fewer studies have assessed striatal, thalamic, and insular regions, there is some evidence, as discussed above, that these regions play a role in emotional processing and facial emotion matching. Thus, these brain structures form the basis for the a priori regions of interest selected for the image analyses.
Despite these research advances, interpretation of the findings in terms of pathophysiology of BP disorder is limited by the potential confounding effects of medications, small numbers of participants, and, in some cases, the inadequate identification of the phase of illness (22). It remains unclear whether increased amygdala activity and decreased cortical activation in response to emotional facial expressions are trait markers of BP disorder or whether abnormal amygdala and cortical activity differentiate the different mood states. To address this question, we present data examining neural activity during emotional face processing collected from a sample of unmedicated bipolar depressed (BPD), bipolar manic (BPM), bipolar euthymic (BPE), and healthy control (HC) subjects, all closely matched for age and gender. We hypothesized that differences between groups would occur in the cortical and limbic areas activated by the face task. We further hypothesized that BPD and BPM subjects would exhibit increased limbic and decreased cortical activation compared with HC subjects, while in BPE, the abnormalities would also be present but in an attenuated form.
Methods and Materials
Participants
Bipolar subjects medication-free for at least 2 weeks and healthy control subjects closely matched for age and gender were recruited from the outpatient psychiatry clinic at Indiana University Hospital and by advertisement to the community. Demographically matched healthy control subjects (n = 30) were recruited via advertisements. All subjects took part in the study after signing an informed consent form approved by the Institutional Review Board at the Indiana University School of Medicine. Both patients and healthy control subjects were paid $75 for screening and $75 for a magnetic resonance imaging (MRI) scan. All subjects underwent a detailed structured diagnostic interview: the Diagnostic Interview for Genetic Studies (5) and/or the Mini-International Neuropsychiatric Interview, as well as a clinical interview by a psychiatrist (A.A.) to determine the appropriate DSM-IV Text Revision (DSM-IV-TR) diagnoses. Subjects were also rated on the 17-item Hamilton Depression Rating Scale (HDRS) (23) and Young Mania Rating Scale (YMRS) (24) at the time of the baseline scan.
Inclusion criteria for noncontrol participants were that they satisfy DSM-IV-TR criteria for BP disorder either in the 1) hypomanic or manic phase and have YMRS >10, HDRS <18; 2) depressed phase and have HDRS >15, YMRS <12; or 3) current euthymic mood state (HDRS <10 and YMRS <10). Participants whose HDRS and YMRS scores were consistent with both mania/hypomania and depression (e.g., mixed state) were excluded. Exclusion criteria for participants included the following: lifetime diagnosis of schizophrenia or schizoaffective disorder; a current primary anxiety disorder; use of psychotropic medications in the past 3 weeks; fluoxetine use over the past 4 weeks; acute suicidal or homicidal ideation or behavior; recent (<1 week) or current inpatient hospitalization; meeting DSM-IV-TR criteria for substance dependence within the past year, except nicotine; positive urinary toxicology screening at baseline; use of alcohol in the past 1 week; serious medical or neurological illness; current pregnancy or breast feeding; and metallic implants or other contraindications to MRI.
Healthy subjects (18 – 60 years) had no personal or family history of psychiatric illness or alcohol or substance abuse/dependence. Additional exclusion criteria were use of any centrally acting medications; use of alcohol in the past 1 week; serious medical or neurological illness; age less than 18 years of age; pregnant or breast feeding; and metallic implants or other contraindication to MRI.
Imaging Paradigm
All participants participated in a 3-minute emotion-matching task developed by Hariri et al. (25). This task focuses the subject’s attention on the negative facial emotion (angry or scared) depicted and reliably activates the amygdala and limbic regions (25). Pictures were obtained from the NimStim set of facial expressions (26). Each trial consists of a presentation of three faces, all depicting a negative emotion, in which the subject is asked to match the emotion of the top picture with the emotion seen in one of the two bottom pictures (Figure 1A). In the control task (Figure 1B), oval shapes are used instead of faces. Five trials are presented in each 22.5-second-long block. Three face presentation blocks interspersed with four shape blocks were presented. Subjects’ task performance (accuracy, response times) were recorded and used as covariates in the imaging analysis.
Figure 1.
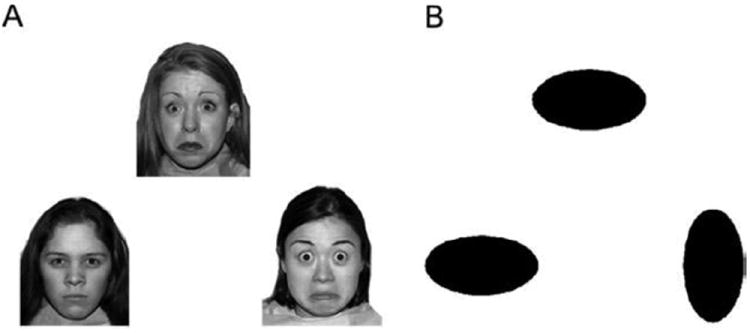
(A) Angry/worried faces (26) and (B) shapes used as experimental and control stimuli, respectively, for the functional magnetic resonance imaging task.
Imaging Protocol
Subjects were trained on the task on a personal computer outside the scanner before being taken to the imaging suite. After a short scout imaging scan to survey head position and center the field of view, a high-resolution three-dimensional magnetization prepared rapid acquisition gradient-echo scan was collected.
During functional activation scans, the blood oxygen level-dependent response was acquired using a T2*-weighted gradient echo-planar imaging sequence (129 measurements, repetition/echo time 2250/29 milliseconds, 39 slices to cover the whole brain, field of view 220 × 220 mm; 2.5 × 2.5 × 3.5 mm3 voxels). A prospective motion correction algorithm (3D-PACE; Siemens, Munich, Germany) provided a dynamic, real-time adjustment for detected head motion. An integrated parallel acquisition technique reduction factor of 2 was implemented with a generalized auto-calibrating partially parallel acquisition to improve spatial resolution, to reduce geometric distortion, and shorten scan time.
Data Analyses
Behavioral Analysis
To examine potential performance differences between diagnostic groups, accuracy scores and reaction times (all items and correct items) were compared via one-way analysis of variance (ANOVA) tests. Post hoc tests on significantly different results were planned via Tukey’s honestly significant difference test.
Functional Neuroimaging Data Analysis
Imaging data were preprocessed and analyzed with standard procedures using Statistical Parametric Mapping software, version 5 (SPM5; http://www.fil.ion.ucl.ac.uk/spm5). No subject included had head movement exceeding either 4° of displacement or rotation in any direction. The six standard motion parameters were also used as covariates in the analysis to account for any residual motion confounds.
Images were aligned, co-registered, and normalized to Montreal Neurological Institute space and subsequently smoothed at 6 mm full width at half maximum. For within-group activation maps, the preprocessed images for each subject were entered into an SPM5 first-level fixed effect general linear model. Using a hemodynamic response function and high-pass filtering, individual subject activation maps for the negative faces versus shapes contrast were obtained. A mask was made by combining the anatomic regions of interest of a priori hypothesized regions (ACC, OFC, DLPFC, insula, amygdala, hippocampus, parahippocampus, thalamus, pallidum, putamen, and caudate) obtained from the SPM5 toolbox. Next, activation maps for each group were obtained using a one-sample t test at significance levels of p = .01 (false discovery rate corrected) level (k = 20) to determine within-group activation in the a priori regions of interest for the faces versus shapes contrast.
For differences between groups, the first-level contrast images for each subject were entered into the second-level random-effects analysis using group as an independent factor and the face versus shapes response as the dependent variable. Even though the groups were closely matched, age, gender, ethnicity, performance accuracy, and response time were used as covariates in the analysis to account for any residual variability due to these factors. The model was also run without these covariates. The full-factorial model F-test map was first examined for main effect of group. The a priori regions of interest mask was used to detect activation in hypothesized regions (p < .01 [uncorrected], k = 10 voxels to reduce false-positive results, and peak voxel significance p < .005). To detect non a priori regions of activation threshold, Monte Carlo simulation for whole-brain voxelwise analysis determined that a cluster size of 108 voxels at p = .01 corresponded to a p = .05 (corrected) clusterwise significance level.
Face versus shape contrast mean value was extracted from each of the clusters significant for the main effect. Using SPSS (version 19; IBM, Chicago, Illinois), the contrast values for each cluster were then entered in a one-way ANOVA, and subsequently, a post hoc analysis with a least significant difference correction was conducted for pairwise comparison of the different groups. Bivariate Pearson correlations were also examined between blood oxygen level-dependent regional activation and symptom severity scores, age, and illness duration for aggregated BP participants. Levine’s test for inequality of variance was used to examine the variance of each group’s region of interest data.
Results
A total of 121 subjects were eligible for full participation according to screening criteria. Two BP subjects were excluded because of change in mood symptoms from screening day to scan day, so that they did not meet eligibility criteria for duration of symptoms for any of the BP groups. Four BP subjects were excluded due to problems in image acquisition. Six healthy subjects and four bipolar subjects were not used because of lack of a close match in one of the other three groups. Therefore, 105 subjects were included with a total of 30 BPM, 30 BPD, 15 BPE, and 30 HC participants. Table 1 summarizes the participants’ demographic and clinical characteristics. There were no significant differences between BP groups on illness characteristics aside from HDRS and YMRS scores. Per recruitment criteria, the BPD group had significantly higher scores on the HDRS and the BPM group had higher scores on the YMRS. There were no other significant differences among the three BP groups in terms of demographic and illness characteristics. Although subjects were unmedicated, most had been treated for BP disorder with medication in the past. Detailed history taken over several hours using a structured interview revealed that many of these patients had experienced numerous mood episodes, particularly when hypomanic episodes were also taken into account. It is possible that the number of mood episodes in these individuals was high because of their extended unmedicated status.
Table 1.
Clinical and Demographic Information by Group
| Measure | BPD (n = 30) | BPE (n = 15) | BPM (n = 30) | HC (n = 30) | ANOVA |
|---|---|---|---|---|---|
| Mean (SD) | Mean (SD) | Mean (SD) | Mean (SD) | ||
| Age (Years) | 35 (11) | 31 (11) | 34 (11) | 32 (10) | ns |
| Age at First Episode (Years) | 14 (6) | 15 (4) | 14 (5) | ns | |
| Hamilton Depression Rating Scale Score (17-Item) | 20 (4) | 7 (4) | 6 (3) | .001 | |
| Young Mania Rating Scale Score | 3 (3) | 2 (3) | 16 (3) | .001 |
| Median (Range) | Median (Range) | Median (Range) | ANOVA | ||
|
| |||||
| Period Off Medication Before Scan (Months) | 12 (1–108) | 12 (2–384) | 30 (1–360) | ns | |
| Number of Prior Mood Episodes (Depression) | 15 (2–186) | 13 (0–100) | 15 (2–102) | ns | |
| Number of Prior Mood Episodes (Mania) | 24 (1–310) | 28 (1–122) | 75 (3–447) | ns | |
| Time Since Last Manic Episode (Months) | 4 (1-36) | 2 (1–384) | 3 (1–60) | ns | |
| Time Since Last Depressive Episode (Months) | 6 (1-26) | 2 (1-19) | 3 (.25–108) | ns | |
| Duration of Current Episode (Weeks) | 4 (1.4–32) | 3 (2–1536) | 1 (1-8) | ns | |
| n (%) | n (%) | n (%) | n (%) | χ2 | |
|
| |||||
| Female | 18 (60%) | 10 (67%) | 19 (63%) | 19 (63) | ns |
| Caucasian | 26 (87%) | 13 (87%) | 28 (93%) | 27 (90) | ns |
| Trauma History | 14 (47%) | 9 (60%) | 15 (50%) | ns | |
| History of Suicide Attempt | 13 (43%) | 6 (40%) | 15 (50%) | ns | |
| History of Psychosis | 9 (30%) | 5 (33%) | 8 (27%) | ns | |
| Bipolar I | 12 (40%) | 10 (67%) | 15 (50%) | ns | |
| Bipolar II | 18 (60%) | 5 (33%) | 15 (50%) | ||
| History of Alcohol Abuse | 16 (53%) | 5 (33%) | 10 (33%) | ns | |
| History of Drug Abuse | 14 (47%) | 7 (47%) | 15 (50%) | ns | |
ANOVA, analysis of variance; BPD, bipolar depressed; BPE, bipolar euthymic; BPM, bipolar manic; HC, healthy control; ns, nonsignificant; SD, standard deviation.
The euthymic group had a relatively brief period of euthymia relative to other neuroimaging samples, which may be attributed to their lack of medication treatment. Though a 2-week off-medication inclusion criterion was used, only one subject was off medication for less than 4 weeks at the time of screening (one BPD subject off valproate and aripiprazole for 3 weeks).
Facial Emotion Labeling Accuracy and Reaction Time
All participants performed the task with a high level of accuracy. There were no group differences on reaction time or accuracy (Table 2).
Table 2.
Accuracy Across Conditions (Active [Faces] and Control [Shapes]) and RT Across Conditions for All Trials and for All Correct Trials
| BPD | BPE | BPM | HC | F-Value | Significance | |
|---|---|---|---|---|---|---|
| Accuracy | ||||||
| Control | 98% (3%) | 97% (3%) | 93% (19%) | 98% (5%) | 1.65 | .183 |
| Active | 81% (12%) | 81% (16%) | 76% (17%) | 84% (10%) | 1.766 | .159 |
| RT – All | ||||||
| Control | 1011.69 (173.99) | 1007.71 (249.30) | 988.10 (201.16) | 959.99 (189.59) | .39 | .76 |
| Active | 2114.78 (427.60) | 2005.39 (371.81) | 2141.66 (386.66) | 2077.24 (294.06) | .495 | .687 |
| RT – Correct | ||||||
| Control | 1011.69 (173.99) | 1007.71 (249.30) | 991.66 (203.47) | 959.99 (189.59) | .387 | .763 |
| Active | 2120.27 (431.17) | 2054.65 (391.59) | 2215.85 (438.39) | 2089.17 (315.11) | .756 | .521 |
BPD, bipolar depressed; BPE, bipolar euthymic; BPM, bipolar manic; HC, healthy control; RT, reaction time.
Image Analyses
Within-Group Brain Activation
All groups had bilateral activation of the amygdala, striatum (putamen and caudate), thalamus, and insula, as well as the DLPFC, medial PFC, and OFC for the face versus shapes contrast built into the general linear model (p < .01, false discovery rate corrected), as would be expected on this task (25). A deactivation (blue color) of the so-called default mode areas (27) in the ACC and posterior cingulate cortex was also seen in all groups for the face versus shapes contrast. Within-group activations are presented in Figure 2 and Table 3.
Figure 2.
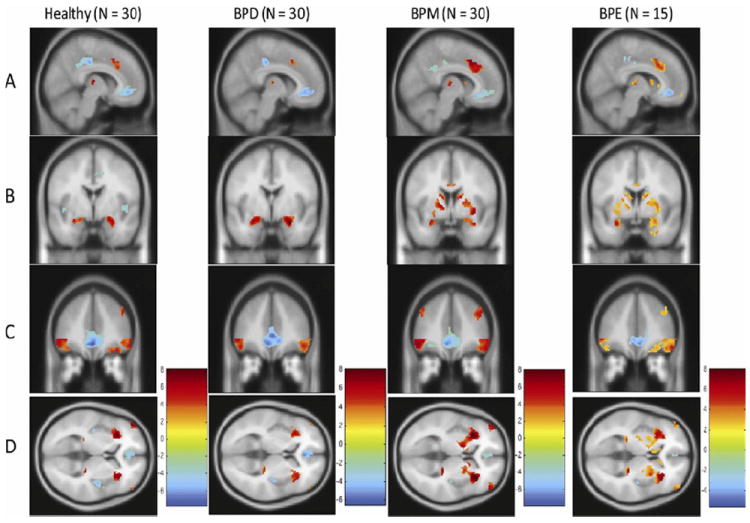
Within-group activation in a priori regions for the shapes versus faces condition in the four groups; healthy, bipolar depressed (BPD), bipolar manic (BPM), and bipolar euthymic (BPE). Group differences are seen following regions, by row, with nearest slice coordinates: (A) dorsal anterior cingulate cortex (x = 8); (B) amygdala and putamen (y = 2); (C) dorsolateral prefrontal cortex and orbitofrontal cortex (y = 40); (D) insula (z = 4). Activation maps are depicted at p = .01 false discovery rate corrected, threshold ≥20 for all groups except for BPE group, where the map is depicted at p = .05, false discovery rate corrected threshold because of fewer number of subjects in the BPE group.
Table 3.
Significant Activation Within Each Group During the Face Versus Shapes Contrast
| Region | Brodmann Area | t Value (Voxel-Level) | Cluster Size | Z Score (Voxel-Level) | MNI Coordinates
|
||
|---|---|---|---|---|---|---|---|
| x | y | z | |||||
| HC (n = 30) | |||||||
| Left insula | 13 | 9.64 | 1398 | Inf | −30 | 24 | −2 |
| Right thalamus | 8.67 | 60 | 7.43 | 12 | −16 | 10 | |
| Left parahippocampal gyrus | 36 | 8.52 | 98 | 7.33 | −22 | −28 | −4 |
| Right insula | 13 | 8.48 | 1658 | 7.31 | 34 | 24 | −2 |
| Right parahippocampal gyrus | 36 | 8.14 | 410 | 7.08 | 24 | −24 | −6 |
| Right dorsal ACC | 32 | 5.65 | 155 | 5.24 | 6 | 18 | 44 |
| Left amygdala | 5.30 | 167 | 4.95 | −28 | −4 | −16 | |
| Right superior frontal gyrus | 9 | 5.29 | 59 | 4.94 | 44 | 38 | 34 |
| Left thalamus | 4.90 | 42 | 4.62 | −10 | −18 | 8 | |
| Left inferior frontal gyrus | 47 | 4.13 | 36 | 3.96 | −24 | 22 | −24 |
| BPD (n = 30) | |||||||
| Right amygdala | 8.44 | 491 | 7.28 | 20 | −6 | −16 | |
| Right insula | 13 | 8.15 | 1074 | 7.09 | 34 | 24 | −2 |
| Left insula | 13 | 7.54 | 1124 | 6.66 | −32 | 24 | −2 |
| Left amygdala | 6.54 | 221 | 5.93 | −22 | −4 | −16 | |
| Left parahippocampal gyrus | 36 | 6.14 | 61 | 5.63 | −18 | −30 | −4 |
| Right thalamus | 6.14 | 39 | 5.62 | 10 | −16 | 10 | |
| Left thalamus | 6.11 | 51 | 5.60 | −10 | −18 | 8 | |
| Right dorsal ACC | 32 | 5.75 | 64 | 5.32 | 6 | 18 | 44 |
| Right inferior gyrus | 47 | 3.83 | 25 | 3.68 | 50 | 46 | 14 |
| BPM (n = 30) | |||||||
| Right insula | 13 | 13.20 | 2474 | Inf | 34 | 22 | −2 |
| Left insula | 13 | 11.12 | 2232 | Inf | −32 | 24 | −2 |
| Right parahippocampal gyrus | 36 | 9.78 | 632 | Inf | 22 | −28 | −4 |
| Right dorsal ACC | 32 | 8.93 | 634 | 7.60 | 10 | 20 | 44 |
| Left thalamus | 8.18 | 79 | 7.11 | −10 | −18 | 8 | |
| Right thalamus | 7.31 | 70 | 6.50 | 10 | −16 | 8 | |
| Left parahippocampal gyrus | 36 | 6.90 | 72 | 6.20 | −18 | −30 | −4 |
| Left superior frontal gyrus | 9 | 5.73 | 95 | 5.30 | −42 | 34 | 38 |
| Right caudate | 4.82 | 81 | 4.55 | 14 | 10 | 8 | |
| Left anterior cingulate | 33 | 4.33 | 45 | 4.12 | −4 | 8 | 26 |
| Right middle frontal gyrus | 3.61 | 21 | 3.49 | 26 | 46 | −16 | |
| BPE (n = 5) | |||||||
| Right amygdala | 9.14 | 3673 | 7.72 | 18 | −6 | −14 | |
| Left insula | 13 | 8.65 | 2333 | 7.42 | −32 | 24 | −4 |
| Left parahippocampal gyrus | 36 | 6.70 | 130 | 6.06 | −18 | −30 | −4 |
| Right thalamus | 6.63 | 71 | 6.0 | 12 | −16 | 10 | |
| Left thalamus | 5.11 | 80 | 4.79 | −12 | −22 | 14 | |
| Right dorsal ACC | 32 | 5.10 | 483 | 4.78 | 6 | 20 | 36 |
| Left middle frontal gyrus | 9 | 4.29 | 32 | 4.09 | −42 | 34 | 40 |
| Right caudate | 4.11 | 82 | 3.94 | 14 | 8 | 10 | |
| Left putamen | 3.76 | 60 | 3.63 | −28 | −18 | 8 | |
| Right cingulate gyrus | 33 | 3.31 | 28 | 3.21 | 4 | 2 | 28 |
| Right medial frontal gyrus | 11 | 3.31 | 26 | 3.21 | 6 | 60 | −12 |
| Right caudate | 2.95 | 22 | 2.88 | 8 | 22 | 4 | |
ACC, anterior cingulate cortex; BPD, bipolar depressed; BPE, bipolar euthymic; BPM, bipolar manic; HC, healthy control; Inf, infinity; MNI, Montreal Neurological Institute.
Between-Group Differences on Brain Activation
A main effect of group was significant for the following a priori identified regions of interest: bilateral insula and dorsal ACC, right amygdala, putamen, and lateral OFC (k = 10; peak voxelwise p ≤ .005, uncorrected). Nearly identical main effect findings were also found when covariates of interest were not included in the analysis, except that the putamen and right insula regions were no longer significant. Post hoc analysis for pairwise differences (Figure 3) revealed that all three BP groups had greater activation of the right putamen than control subjects. Both BPE and BPD had increased activation of the right amygdala compared with HCs, but this effect was not seen in the BPM group. Both BPM and BPE had greater activation of the bilateral insula compared with HCs. Compared with control subjects, the BPM group had greater activation of the bilateral dorsal ACC and the left DLPFC cluster but decreased activation of the right OFC. Levine’s test for inequality of variance did not detect differences in variance between the groups, indicating that ANOVA tests were valid despite sample-size discrepancies.
Figure 3.
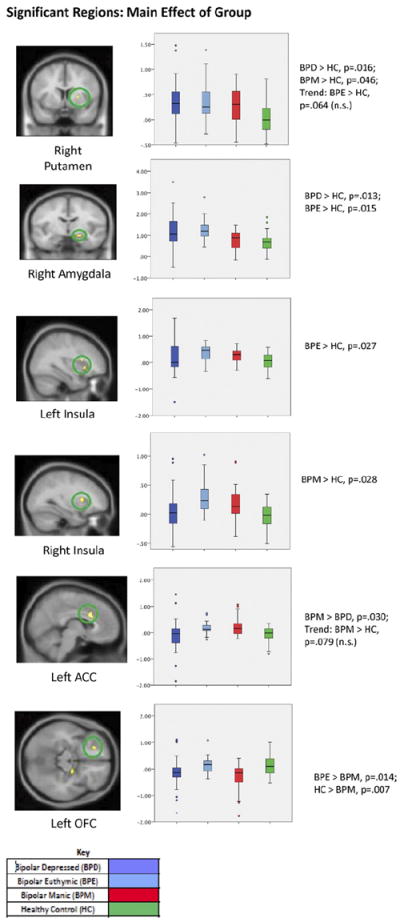
Results of four-group analysis of variance main effect for a priori identified regions (p < .01 uncorrected, k ≥ 10) and subsequent least significant difference corrected post hoc analysis. Box plots show the distribution of mean activation within each group, including the minimum, median, and maximum values. Error bars show the standard deviation, and data points outside the box are outliers. The y axis represents the mean T value of extracted activation, statistically corrected for age, gender, race, task accuracy, and reaction time, ranging from −2 to 4. Six clusters were significant, including the right putamen (peak z = 2.87; extent = 10 voxels, Montreal Neurological Institute [MNI] coordinates (x, y, z) of peak = 24, 6, 4); the right amygdala (Brodmann area [BA] 34; peak z = 3.03; extent = 17 voxels; MNI coordinates of peak = 20, −8, −14); the left insula (BA 13; peak z = 3.27; extent = 18 voxels; MNI coordinates of peak = −30, 14, 10); the right insula (BA 13/47; peak z = 2.84; extent = 11 voxels; MNI coordinates of peak = 34, 20, −2); the left ACC (BA 24; peak z = 3.26; extent = 52 voxels; MNI coordinates of peak = 6, 16, 28); and the left OFC (BA 11; peak z = 3.05; extent = 13 voxels; MNI coordinates of peak = −22, 36, −14). Results of between-group t tests comparing extracted clusters are shown under each graph (least significant difference corrected significance threshold, p < .05). ACC, anterior cingulate cortex; n.s., nonsignificant; OFC, orbitofrontal cortex.
For regions without an a priori hypothesis (whole-brain voxelwise analysis), main effect of group was significant (clusterwise significance, p < .05, corrected) only in the left superior frontal gyrus of the DLPFC for the faces versus shapes condition (Figure 4). Post hoc analysis for pairwise differences showed greater activation in the BPM group compared with BPD and HC groups (trend-level finding for BPM > BPE; Figure 4).
Figure 4.
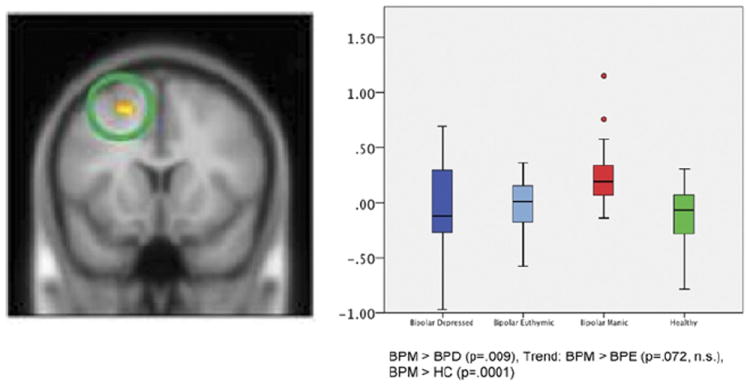
Between-group differences seen without a priori masked regions of interest. Box plots show the distribution of mean activation within each group, including the minimum, median, and maximum values. Error bars show the standard deviation, and data points outside the box are outliers. The y axis represents the mean T value of extracted activation, statistically corrected for gender and task performance, ranging from −1 to 1.5. Wholebrain voxelwise activation (p < .001, uncorrected) was seen in the left superior frontal gyrus of the dorsolateral prefrontal cortex (Brodmann area 6, peak z = 4.23, extent = 115 voxels; Montreal Neurological Institute coordinates [x, y, z] of peak: [−18, 12, 52]). Clusterwise significance is p < .05 (corrected). BPD, bipolar depressed; BPE, bipolar euthymic; BPM, bipolar manic; HC, healthy control; n.s., nonsignificant.
Relationships Between Symptom Severity Scores and Brain Activation
We restricted these analyses to brain regions with statistically significant findings. Across the collapsed BP disorder group (n = 75), significant negative correlations were found between dorsal ACC activation and depressive symptoms (HDRS score; r = −.306, p = .008) and left OFC activation and manic/hypomanic symptoms (YMRS score; r = −.267, p = .02).
Discussion
The primary aim of this study was to compare neural activation of unmedicated BPE, BPD, and BPM outpatients and HCs during a task of facial emotion processing. Both trait- and state-related effects were revealed. Abnormalities occurring in the BPE group and/or in all three BP disorder groups when compared with HCs can be inferred as being trait BP-related abnormalities. In this regard, increased activation of the limbic-striatal network—amygdala, putamen, and insula—would qualify as trait-related abnormalities. Together, these abnormalities imply an increased limbic reactivity to facial emotion matching in BP disorder, as hypothesized.
Mood state-related abnormalities can be inferred if the findings in BPM and BPD are different from the BPE group or different from each other. Using these criteria, an increased activation of the putamen was seen in all three BP disorder groups compared with HCs and, therefore, is very likely a trait effect. Structural and functional abnormalities of the striatum in BP disorder have been reported in a number of studies (28-30). The striatum is involved in motor function, as well as reward processing (31), and abnormalities in these functions are frequently seen in BP disorder. The increased activation of the striatum in all three phases of BP disorder suggests hyperactivity of the striatum as an inherent trait abnormality in BP disorder. These outcomes differ from our hypothesized expectation of BPD and BPM groups differing from BPE in limbic and cortical activation, suggesting potential impairment, even outside of a major mood episode.
On the other hand, in the insula, we found increased activation in BPM and BPE but not in BPD. These findings would suggest a somewhat blunted insula response in the BPD state. The insula has been implicated in monitoring of cognitive and autonomic responses to emotional stimuli (32-36). Decreased activation in BPD may imply impairment of insula functioning leading to abnormal cognitive and visceral responses to negative emotional stimuli in the depressed state of BP disorder.
Conversely, amygdala activation was increased in BPD and BPE but not in the BPM group. This finding suggests an exaggerated response to negative emotional stimuli in BPE and BPD but a blunted response in the BPM group, which also differs from our predictions. Indeed, studies have reported decreased amygdala activation to negative faces in BPM (10), although one study reported increased amygdala activation (17) compared with HCs. In this study, we did not see a difference in amygdala activation in BPM compared with HC. A larger sample and medication status may account for different results in our study compared with the others.
An increased activation of the dorsal ACC in BPM compared with the BPD group was also present. The dorsal ACC has been implicated in conflict resolution, particularly in situations of conflict between the emotional and cognitive aspects of a stimulus or situation (37). In the context of the present study, the increased dorsal ACC activation in BPM subjects may be related to difficulty in discriminating the negative facial affect from other emotions, as has been reported in previous studies (36,38). An increased cortical response may therefore be required by manic subjects (compared with depressed subjects) to complete the emotional matching task. The increased activation of the DLPFC, involved in higher level cortical functions including assessment of emotional stimuli, can be similarly explained, although it is counter to our predictions of decreased cortical activation. Conversely, a decreased activation of OFC was seen in BPM, as predicted. Rodent and primate studies indicate that the lateral OFC is involved in the assessment of emotional significance and reward potential of stimuli and regulates the amygdala accordingly (39-41). Abnormalities in this system can lead to an inability to assess the emotional significance of the stimuli, leading to inappropriate emotional responses and impulsive behavior (39-41). Together, the corticolimbic activation abnormalities seen in BPM suggest an impairment in initial sensory processing of negative emotional stimuli (decreased amygdala and lateral OFC activation), which probably leads to requirement of a greater cortical effort (increased dorsal ACC and DLPFC activation) to complete an emotional matching task. Thus, our data partially support the hypothesis that mood states represent a decrease in cortical and increase in limbic activation but also highlight a more complex and nuanced picture that differs across mood states/traits and cortical subregions.
Though the findings of this study are not confounded by concurrent use of medication, small sample size, or gender effects, long-term effects of past use of medications cannot be fully ruled out. To fully account for medication effects, drug-naive patients would have to be studied, which is a difficult proposition, particularly for the recruitment of subjects with BP disorder. We also limited our sample to outpatients, as we attempted to locate individuals off psychotropic medication. In the case of BP disorder, there is considerable evidence that this illness is often undertreated because of a variety of patient- and treater-related factors (42). These patients either have stopped taking their medications due to compliance or affordability issues or have not yet been diagnosed with BP disorder. A detailed history, taken over several hours using a structured interview, revealed that these individuals were significantly ill, particularly when (hypo)manic periods were also taken into account. However, it is possible that these patients were less severely ill than those that present as medicated either in the inpatient or outpatient setting. Therefore, the findings of this study should be taken as complementary to findings from investigations of more severely ill medicated subjects.
The BP group was composed of participants with both BP disorder types I and II. There were no significant differences in regard to the relative frequency of these subtypes between the three BP groups. A larger number of subjects in each phase and subtype would need to be included for any investigations of differences between types and phases. Euthymic subjects off of medication were substantially more difficult to recruit and therefore the BPE groups had a smaller sample size, although group variance did not differ for the imaging results.
The facial emotion matching task has been used widely and has been validated in several studies to reliably activate the corticolimbic regions, in particular the amygdala, involved in emotion processing (43). It is a brief, simple task requiring minimal cognitive effort (44), suitable for use in individuals impaired by a major mood episode, and task performance can be recorded. Moreover, it is one of the few functional magnetic resonance imaging tasks that has been shown to have a strong genetic relation to activation patterns (45). However, it does have several limitations. One limitation is that the control condition is comprised of shapes rather than neutral faces. Activation on this task has been attributed to face matching, as well as the emotional component (46). Second, the sad and fearful affects are used together as negative emotional tasks, and the differential activations in response to faces with these different emotions are not measured. Another limitation is that faces with different emotional intensities are not used. Milder emotional expressions, particularly for sad faces, have been reported to elicit subtle abnormalities in BPD (47), probably related to difficulties in facial emotion matching in these subjects as noted above. In the future, studies using more sophisticated facial emotion recognition tasks will need to be conducted to further delineate the differences in activation of the mood circuitry in different phases of bipolar disorder.
Conclusion
Using a facial emotion matching task, trait-related, as well as state-related, corticolimbic abnormalities in different phases of bipolar disorder were identified. Future work should integrate tasks involving affective processing with regulation and include tasks that use a full range of negative and positive human emotions.
Acknowledgments
This project was funded by the National Institute of Mental Health to AA (R01MH075025). The effort of LAH was funded by the National Institute on Drug Abuse (K12DA000357).
We acknowledge Nicholas Salupo for technical assistance.
The following does not pertain to the conduct of this study but is provided in the spirit of full disclosure. In the past 2 years, Dr. Anand has served on the advisory board of AstraZeneca, Pfizer Pharmaceuticals, Merck Pharmaceuticals, and Dey Pharmaceuticals. Dr. Anand has been a speaker for Merck Pharmaceuticals. Dr. Anand has received grant support from Astra-Zeneca and Lilly Pharmaceuticals.
Footnotes
The authors report no biomedical financial interests or potential conflicts of interest relevant to the conduct of this study.
References
- 1.Almeida JR, Versace A, Hassel S, Kupfer DJ, Phillips ML. Elevated amygdala activity to sad facial expressions: A state marker of bipolar but not unipolar depression. Biol Psychiatry. 2010;67:414–421. doi: 10.1016/j.biopsych.2009.09.027. [DOI] [PMC free article] [PubMed] [Google Scholar]
- 2.Drevets WC, Price JL, Simpson JR, Jr, Todd RD, Reich T, Vannier M, Raichle ME. Subgenual prefrontal cortex abnormalities in mood disorders. Nature. 1997;386:824–827. doi: 10.1038/386824a0. [DOI] [PubMed] [Google Scholar]
- 3.Phillips ML, Drevets WC, Rauch SL, Lane R. Neurobiology of emotion perception II: Implications for major psychiatric disorders. Biol Psychiatry. 2003;54:515–528. doi: 10.1016/s0006-3223(03)00171-9. [DOI] [PubMed] [Google Scholar]
- 4.Chang K, Adleman NE, Dienes K, Simeonova DI, Menon V, Reiss A. Anomalous prefrontal-subcortical activation in familial pediatric bipolar disorder: A functional magnetic resonance imaging investigation. Arch Gen Psychiatry. 2004;61:781–792. doi: 10.1001/archpsyc.61.8.781. [DOI] [PubMed] [Google Scholar]
- 5.Altshuler L, Bookheimer S, Townsend J, Proenza MA, Sabb F, Mintz J, Cohen MS. Regional brain changes in bipolar I depression: A functional magnetic resonance imaging study. Bipolar Disord. 2008;10:708–717. doi: 10.1111/j.1399-5618.2008.00617.x. [DOI] [PMC free article] [PubMed] [Google Scholar]
- 6.Yurgelun-Todd DA, Gruber SA, Kanayama G, Killgore WD, Baird AA, Young AD. fMRI during affect discrimination in bipolar affective disorder. Bipolar Disord. 2000;2:237–248. doi: 10.1034/j.1399-5618.2000.20304.x. [DOI] [PubMed] [Google Scholar]
- 7.Versace A, Thompson WK, Zhou D, Almeida JR, Hassel S, Klein CR, et al. Abnormal left and right amygdala-orbitofrontal cortical functional connectivity to emotional faces: State versus trait vulnerability markers of depression in bipolar disorder. Biol Psychiatry. 2010;67:422–431. doi: 10.1016/j.biopsych.2009.11.025. [DOI] [PMC free article] [PubMed] [Google Scholar]
- 8.Elliott R, Ogilvie A, Rubinsztein JS, Calderon G, Dolan RJ, Sahakian BJ. Abnormal ventral frontal response during performance of an affective go/no go task in patients with mania. Biol Psychiatry. 2004;55:1163–1170. doi: 10.1016/j.biopsych.2004.03.007. [DOI] [PubMed] [Google Scholar]
- 9.Blumberg HP, Stern E, Martinez D, Ricketts S, de Asis J, White T, et al. Increased anterior cingulate and caudate activity in bipolar mania. Biol Psychiatry. 2000;48:1045–1052. doi: 10.1016/s0006-3223(00)00962-8. [DOI] [PubMed] [Google Scholar]
- 10.Lennox BR, Jacob R, Calder AJ, Lupson V, Bullmore ET. Behavioural and neurocognitive responses to sad facial affect are attenuated in patients with mania. Psychol Med. 2004;34:795–802. doi: 10.1017/s0033291704002557. [DOI] [PubMed] [Google Scholar]
- 11.Chen CH, Lennox B, Jacob R, Calder A, Lupson V, Bisbrown-Chippendale R, et al. Explicit and implicit facial affect recognition in manic and depressed states of bipolar disorder: A functional magnetic resonance imaging study. Biol Psychiatry. 2006;59:31–39. doi: 10.1016/j.biopsych.2005.06.008. [DOI] [PubMed] [Google Scholar]
- 12.Foland LC, Altshuler LL, Bookheimer SY, Eisenberger N, Townsend J, Thompson PM. Evidence for deficient modulation of amygdala response by prefrontal cortex in bipolar mania. Psychiatry Res. 2008;162:27–37. doi: 10.1016/j.pscychresns.2007.04.007. [DOI] [PMC free article] [PubMed] [Google Scholar]
- 13.Blumberg HP, Leung HC, Skudlarski P, Lacadie CM, Fredericks CA, Harris BC, et al. A functional magnetic resonance imaging study of bipolar disorder: State- and trait-related dysfunction in ventral prefrontal cortices. Arch Gen Psychiatry. 2003;60:601–609. doi: 10.1001/archpsyc.60.6.601. [DOI] [PubMed] [Google Scholar]
- 14.Rubinsztein JS, Fletcher PC, Rogers RD, Ho LW, Aigbirhio FI, Paykel ES, et al. Decision-making in mania: A PET study. Brain. 2001;124:2550–2563. doi: 10.1093/brain/124.12.2550. [DOI] [PubMed] [Google Scholar]
- 15.Malhi GS, Lagopoulos J, Sachdev P, Mitchell PB, Ivanovski B, Parker GB. Cognitive generation of affect in hypomania: An fMRI study. Bipolar Disord. 2004;6:271–285. doi: 10.1111/j.1399-5618.2004.00123.x. [DOI] [PubMed] [Google Scholar]
- 16.Chen CH, Suckling J, Ooi C, Jacob R, Lupson V, Bullmore ET, Lennox BR. A longitudinal fMRI study of the manic and euthymic states of bipolar disorder. Bipolar Disord. 2010;12:344–347. doi: 10.1111/j.1399-5618.2010.00801.x. [DOI] [PubMed] [Google Scholar]
- 17.Altshuler L, Bookheimer S, Proenza MA, Townsend J, Sabb F, Firestine A, et al. Increased amygdala activation during mania: A functional magnetic resonance imaging study. Am J Psychiatry. 2005;162:1211–1213. doi: 10.1176/appi.ajp.162.6.1211. [DOI] [PubMed] [Google Scholar]
- 18.Hassel S, Almeida JR, Kerr N, Nau S, Ladouceur CD, Fissell K, et al. Elevated striatal and decreased dorsolateral prefrontal cortical activity in response to emotional stimuli in euthymic bipolar disorder: No associations with psychotropic medication load. Bipolar Disord. 2008;10:916–927. doi: 10.1111/j.1399-5618.2008.00641.x. [DOI] [PMC free article] [PubMed] [Google Scholar]
- 19.Shah MP, Wang F, Kalmar JH, Chepenik LG, Tie K, Pittman B, et al. Role of variation in the serotonin transporter protein gene (SLC6A4) in trait disturbances in the ventral anterior cingulate in bipolar disorder. Neuropsychopharmacology. 2009;34:1301–1310. doi: 10.1038/npp.2008.204. [DOI] [PMC free article] [PubMed] [Google Scholar]
- 20.Robinson JL, Monkul ES, Tordesillas-Gutierrez D, Franklin C, Bearden CE, Fox PT, Glahn DC. Fronto-limbic circuitry in euthymic bipolar disorder: Evidence for prefrontal hyperactivation. Psychiatry Res. 2008;164:106–113. doi: 10.1016/j.pscychresns.2007.12.004. [DOI] [PubMed] [Google Scholar]
- 21.Van der Schot A, Kahn R, Ramsey N, Nolen W, Vink M. Trait and state dependent functional impairments in bipolar disorder. Psychiatry Res. 2010;184:135–142. doi: 10.1016/j.pscychresns.2010.07.009. [DOI] [PubMed] [Google Scholar]
- 22.Strakowski SM, Delbello MP, Adler CM. The functional neuroanatomy of bipolar disorder: A review of neuroimaging findings. Mol Psychiatry. 2005;10:105–116. doi: 10.1038/sj.mp.4001585. [DOI] [PubMed] [Google Scholar]
- 23.Hamilton M. A rating scale for depression. J Neurol Neurosurg Psychiatry. 1960;23:56–62. doi: 10.1136/jnnp.23.1.56. [DOI] [PMC free article] [PubMed] [Google Scholar]
- 24.Young RC, Biggs JT, Ziegler VE, Meyer DA. A rating scale for mania: Reliability, validity and sensitivity. Br J Psychiatry. 1978;133:429–435. doi: 10.1192/bjp.133.5.429. [DOI] [PubMed] [Google Scholar]
- 25.Hariri AR, Mattay VS, Tessitore A, Kolachana B, Fera F, Goldman D, et al. Serotonin transporter genetic variation and the response of the human amygdala. Science. 2002;297:400–403. doi: 10.1126/science.1071829. [DOI] [PubMed] [Google Scholar]
- 26.Tottenham N, Tanaka JW, Leon AC, McCarry T, Nurse M, Hare TA, et al. The NimStim set of facial expressions: Judgments from untrained research participants. Psychiatry Res. 2009;168:242–249. doi: 10.1016/j.psychres.2008.05.006. [DOI] [PMC free article] [PubMed] [Google Scholar]
- 27.Raichle ME, MacLeod AM, Snyder AZ, Powers WJ, Gusnard DA, Shulman GL. A default mode of brain function. Proc Natl Acad Sci U S A. 2001;98:676–682. doi: 10.1073/pnas.98.2.676. [DOI] [PMC free article] [PubMed] [Google Scholar]
- 28.Blumberg HP, Martin A, Kaufman J, Leung HC, Skudlarski P, Lacadie C, et al. Frontostriatal abnormalities in adolescents with bipolar disorder: Preliminary observations from functional MRI. Am J Psychiatry. 2003;160:1345–1347. doi: 10.1176/appi.ajp.160.7.1345. [DOI] [PubMed] [Google Scholar]
- 29.Strakowski SM, DelBello MP, Adler C, Cecil DM, Sax KW. Neuroimaging in bipolar disorder. Bipolar Disord. 2000;2:148–164. doi: 10.1034/j.1399-5618.2000.020302.x. [DOI] [PubMed] [Google Scholar]
- 30.Marchand WR, Yurgelun-Todd D. Striatal structure and function in mood disorders: A comprehensive review. Bipolar Disord. 2010;12:764–785. doi: 10.1111/j.1399-5618.2010.00874.x. [DOI] [PubMed] [Google Scholar]
- 31.Alexander GE, Crutcher MD, DeLong MR. Basal ganglia-thalamo-cortical circuits: Parallel substrates for motor, oculomotor, “prefrontal” and “limbic” functions. Prog Brain Res. 1990;85:119–146. [PubMed] [Google Scholar]
- 32.Craig AD. How do you feel - now? The anterior insula and human awareness. Nat Rev Neurosci. 2009;10:59–70. doi: 10.1038/nrn2555. [DOI] [PubMed] [Google Scholar]
- 33.Augustine JR. Circuitry and functional aspects of the insular lobe in primates including humans. Brain Res Rev. 1996;22:229–244. doi: 10.1016/s0165-0173(96)00011-2. [DOI] [PubMed] [Google Scholar]
- 34.Elliott R, Rubinsztein JS, Sahakian BJ, Dolan RJ. Selective attention to emotional stimuli in a verbal go/no-go task: An fMRI study. Neuroreport. 2000;11:1739–1744. doi: 10.1097/00001756-200006050-00028. [DOI] [PubMed] [Google Scholar]
- 35.Wessa M, Houenou J, Paillere-Martinot M-L, Berthoz S, Artiges E, Leboyer M, Martinot JL. Fronto-striatal overactivation in euthymic bipolar patients during an emotional go/nogo task. Am J Psychiatry. 2007;164:638–646. doi: 10.1176/ajp.2007.164.4.638. [DOI] [PubMed] [Google Scholar]
- 36.George MS, Huggins T, McDermut W, Parekh PI, Rubinow D, Post RM. Abnormal facial emotion recognition in depression: Serial testing in an ultra-rapid-cycling patient. Behav Modif. 1998;22:192–204. doi: 10.1177/01454455980222007. [DOI] [PubMed] [Google Scholar]
- 37.Etkin A, Egner T, Peraza DM, Kandel ER, Hirsch J. Resolving emotional conflict: A role for the rostral anterior cingulate cortex in modulating activity in the amygdala. Neuron. 2006;51:871–882. doi: 10.1016/j.neuron.2006.07.029. [DOI] [PubMed] [Google Scholar]
- 38.Rubinow DR, Post RM. Impaired recognition of affect in facial expression in depressed patients. Biol Psychiatry. 1992;31:947–953. doi: 10.1016/0006-3223(92)90120-o. [DOI] [PubMed] [Google Scholar]
- 39.Barbas H, Saha S, Rempel-Clower N, Ghashghaei T. Serial pathways from primate prefrontal cortex to autonomic areas may influence emotional expression. BMC Neurosci. 2003;4:25. doi: 10.1186/1471-2202-4-25. [DOI] [PMC free article] [PubMed] [Google Scholar]
- 40.Ghashghaei HT, Hilgetag CC, Barbas H, Ghashghaei HT, Hilgetag CC, Barbas H. Sequence of information processing for emotions based on the anatomic dialogue between prefrontal cortex and amygdala. Neuroimage. 2007;34:905–923. doi: 10.1016/j.neuroimage.2006.09.046. [DOI] [PMC free article] [PubMed] [Google Scholar]
- 41.Ongur D, Price JL. The organization of networks within the orbital and medial prefrontal cortex of rats, monkeys and humans. Cereb Cortex. 2000;10:206–219. doi: 10.1093/cercor/10.3.206. [DOI] [PubMed] [Google Scholar]
- 42.Merikangas KR, Jin R, He J-P, Kessler RC, Lee S, Sampson NA, et al. Prevalence and correlates of bipolar spectrum disorder in the World Mental Health Survey Initiative. Arch Gen Psychiatry. 2011;68:241–251. doi: 10.1001/archgenpsychiatry.2011.12. [DOI] [PMC free article] [PubMed] [Google Scholar]
- 43.Hariri AR, Tessitore A, Mattay VS, Fera F, Weinberger DR. The amygdala response to emotional stimuli: A comparison of faces and scenes. Neuroimage. 2002;17:317–323. doi: 10.1006/nimg.2002.1179. [DOI] [PubMed] [Google Scholar]
- 44.Hariri AR, Bookheimer SY, Mazziotta JC. Modulating emotional responses: Effects of a neocortical network on the limbic system. Neuroreport. 2000;11:43–48. doi: 10.1097/00001756-200001170-00009. [DOI] [PubMed] [Google Scholar]
- 45.Hariri AR, Drabant EM, Munoz KE, Kolachana BS, Mattay VS, Egan MF, Weinberger DR. A susceptibility gene for affective disorders and the response of the human amygdala. Arch Gen Psychiatry. 2005;62:146–152. doi: 10.1001/archpsyc.62.2.146. [DOI] [PubMed] [Google Scholar]
- 46.Wright P, Liu Y. Neutral faces activate the amygdala during identity matching. Neuroimage. 2006;29:628–636. doi: 10.1016/j.neuroimage.2005.07.047. [DOI] [PubMed] [Google Scholar]
- 47.Lawrence NS, Williams AM, Surguladze S, Giampietro V, Brammer MJ, Andrew C, et al. Subcortical and ventral prefrontal cortical neural responses to facial expressions distinguish patients with bipolar disorder and major depression. Biol Psychiatry. 2004;55:578–587. doi: 10.1016/j.biopsych.2003.11.017. [DOI] [PubMed] [Google Scholar]