

Abstract
Objective
Plasma microRNAs are modulated during disease and are emerging biomarkers; they have not been characterized in HIV infection. Using our macaque/simian immunodeficiency virus (SIV) model of HIV, we sought to identify a plasma miRNA profile of acute lentiviral infection, evaluate its relationship with known cellular and viral determinants of lentivirus-associated CNS disease, and explore the potential of miRNAs to predict CNS disease.
Design
Plasma samples were obtained pre-inoculation and ten days post-inoculation from SIV-infected macaques.
Methods
Plasma miRNA expression profiles were determined by TaqMan low density array for six individuals. miRNA expression was compared with levels of cytokines, virus, and plasma platelet count. miRNA results were confirmed by single miRNA-specific assays for ten macaques. Nineteen individuals were used to validate a disease prediction test.
Results
A 45-miRNA signature of acute infection (differential expression with p<0.05 after multiple comparison correction) classified plasma as infected or not. Several differentially expressed miRNAs correlated with CNS disease-associated cytokines IL-6 and CCL2 and included predicted and/or validated regulators of the corresponding mRNAs. miRNAs tracked with viral load and platelet count, also predictors of CNS disease. At least six miRNAs were significantly differentially expressed in individuals with severe versus no CNS disease; in an unweighted expression test, they predicted CNS disease.
Conclusions
Acute-phase differential expression of plasma miRNAs predicts CNS disease and suggests that CNS damage or predisposition to disease progression begins in the earliest phase of infection. Plasma miRNAs should be investigated further as leading indicators of HIV diseases as early as acute infection.
Keywords: HIV, SIV, microRNA, biomarker, acute infection, plasma, HIV-associated neurocognitive disorders
Introduction
Despite the availability of effective antiretroviral therapy [1], HIV-associated neurocognitive disorders (HAND)—including HIV-associated dementia, minor cognitive/motor disorder, and asymptomatic neurocognitive impairment(HAND) [2-4]— are a growing burden as the HIV-infected population expands and ages. These disorders lie at an etiologic intersection of viral and pharmacologic causes, immune responses, comorbidities, and aging [5], with no established biological diagnostic or predictive tools [6]. Reported biomarkers are measured mostly in brain tissue or cerebrospinal fluid (CSF) [7]. New, less invasive metrics of HAND risk and progression could guide decisions about treatment timing and regimen [8] and open novel therapeutic avenues.
Ideal HAND biomarkers would have prognostic value even during acute infection, especially because damaging effects of early host responses may persist. The increasing prevalence of HAND despite viral suppression through ART [1] demonstrates that although retroviruses contribute directly to neuropathology [7], host responses to infection are also etiologically important. Indeed, CNS innate responses persist without active viral spread [9]. The extent to which acute phase host responses contribute to or predict the development of HIV diseases such as HAND remains incompletely understood and difficult to explore in patient cohorts. Our validated SIV/macaque model of AIDS and HIV CNS disease, which has yielded several important CNS disease biomarkers [10-13], allows longitudinal monitoring even during the first days of infection.[14, 15]. Here, we report the results of our search for microRNA (miRNA) biomarkers of HAND using this model.
miRNA signatures have emerged as promising disease biomarkers [16] and are particularly useful when found in blood, obviating the need for tissue biopsy or CSF. Plasma miRNAs are remarkably stable [17], providing a window into largely inaccessible tissue compartments such as brain [18-21]. No studies have explored plasma miRNAs as biomarkers of lentiviral disease. Research has focused on the reciprocal influence of HIV and host miRNAs in cultured cells [22, 23]; miRNA profiles in cells [24] or tissue [25, 26]; and proposed HIV-encoded miRNAs [27].
We describe a plasma miRNA signature of acute infection in which at least 45 plasma miRNAs are differentially expressed by ten days post-inoculation (dpi). This signature includes miRNAs that are involved in innate immune regulatory networks and correlate with CNS antiviral responses. Moreover, differential expression of at least six miRNAs predicts the development of CNS disease.
METHODS
Ethics statement
Animal studies were approved by the Johns Hopkins University Institutional Animal Care and Use Committee and conducted in accordance with the Weatherall Report, the Guide for the Care and Use of Laboratory Animals, and the USDA Animal Welfare Act.
Animal studies
Plasma samples were from pigtailed macaque studies (See Table, Supplemental Digital Content 1, list of macaques) involving dual-inoculation with an immunosuppressive SIV swarm and a neurotropic clone [28]. Pre-inoculation and 10 dpi plasma from three macaques each that did or did not progress to encephalitis were analyzed by array. Plasma from four additional macaques (two each with no or severe disease) were added for qPCR validation; three pre-inoculation samples per animal and a 10 dpi plasma were used. Nine additional sample sets were incorporated to assess a six-miRNAtest for CNS disease.
miRNA isolation
Total RNA was isolated from 100 ul of plasma (Ambion miRvana miRNA isolation protocol for liquids). Synthetic ath-miR159a (UUUGGAUUGAAGGGAGCUCUA, Integrated DNA Technologies, Coralville, IA), was added to normalize for processing variations and measured with several endogenous miRNAs for quality control.
RT-qPCR arrays, analysis, and data availability
Plasma RNA was amplified with TaqMan Array Human MicroRNA A+B Cards v3.0 (Applied Biosystems, ABI). Data were analyzed by HTqPCR [29], DataAssist (ABI), BRB-ArrayTools (http://linus.nci.nih.gov/BRB-ArrayTools.html) [30], and MultiExperiment Viewer (http://www.tm4.org/mev/) [31]. (See also Text, Supplemental Digital Content 2, supplemental methods). Array data were deposited with GEO (ID GSE26057, http://www.ncbi.nlm.nih.gov/geo/query/acc.cgi?token=jxilbemiuamakvc&acc=GSE26057)
Viral load and ELISAs
Viral load was measured by qPCR [32]. ELISAs for IL-6 and CCL2 were from R&D Systems (Minneapolis, MN) [32].
Individual RT-qPCR assays
TaqMan miRNA assay (ABI) reverse transcription and real-time steps followed the manufacturer's protocol (See also Text, Supplemental Digital Content 2, supplemental methods). Delta-delta Ct (ΔΔCt) analysis included normalization to ath-miR159a spike-in and comparison of each 10 dpi sample to the mean of up to three pre-infection samples.
Sequence analyses
MicroRNA sequences were obtained from miRBase [http://mirbase.org [33]]. Human/macaque genomic comparisons were performed with UCSC genome browser (http://genome.ucsc.edu).
Target predictions
A Perl program combined RNAhybrid [34], TargetScan [35], and MiRanda [36] target prediction algorithms, assigning a score to candidate macaque miRNA/3’ UTR pairs by the number of programs predicting interaction and the number of calls per UTR.
Statistical methods
Two-tailed t-tests (paired when appropriate) were done with or without Welch's correction; multiple comparison correction was by Benjamini-Hochberg method [37]. Values below 0.05 were considered significant; those below 0.1 were considered to approach significance. Assessment of PCR results was based on ΔΔCt. Viral loads were log-transformed.
Six-miRNA prediction test
An unweighted composite expression change score was generated from six miRNAs with pre- to post-infection expression changes in animals with no versus severe disease. Animal-specific miRNA expression changes were adjusted by the corresponding mean value of animals with no CNS disease. Negative scores were zeroed. Values were summed to generate a composite score.
RESULTS
~250 plasma miRNAs detected by PCR array
TaqMan low-density arrays identified differentially expressed miRNAs in plasma from six pigtailed macaques (Macaca nemestrina) prior to and at ten dpi. Almost 250 miRNAs, on average, were detected in each sample, with over 120 miRNAs detected before Ct=30 (see Figure, Supplemental Digital Content 3, Ct density curves and the effects of normalization, filtering). There was a significant decrease in the number of miRNAs detected in acutely infected plasma (average=241) compared with pre-infection plasma (average=256; Fig. 1A, “All”). A decrease was also apparent when the analysis was restricted to relatively abundant miRNAs (115 versus 130; Fig. 1A, “Ct<30”). Although these assays were designed to detect human miRNAs, 97% of miRNAs expressed in macaque brain [38], as well as most predicted macaque miRNAs [39], have 100% identity with human orthologs. We have obtained concordant miRNA PCR results with human and macaque samples [40].
Figure 1. miRNAs detected in macaque plasma distinguish infected from uninfected samples.

A. Compared with pre-infection plasma, at ten days post- infection, there was a significant decrease (p=0.015, paired t-test) in the total number of detected miRNAs (“All”). In all but one individual, the decline (p=0.026) also occurred among relatively abundant miRNAs that amplified before cycle 30 (“Ct<30”). B. Hierarchical clustering of infected (red) and uninfected (blue) samples. C. Principle component analysis identifies clusters based on infection status. The input for analyses in B. and C. was the set of all miRNAs detected by RT-qPCR array.
Robust plasma miRNA profile changes accompany acute retroviral infection
We used three complementary analyses [hierarchical clustering, principle component analysis (PCA) and random forest class prediction] to determine whether expression of miRNAs defines a signature of acute infection. Hierarchical clustering separated the samples into two distinct groups, representing pre-infection and acute SIV infection (Fig. 1B; see also Figure, Supplemental Digital Content 4, depicting the influence of normalization, filtering, and clustering method). PCA also revealed pre- and acute infection clusters (Fig. 1C). 10 dpi plasma from one animals (CT64, the only female) fell between pre-infection and acute samples in a method-dependent manner, often with greatest proximity to the pre-infection sample (See Text, Supplemental Digital Content 5, notes on gender, miRNAs, and HIV). Random forest correctly classified samples as infected or uninfected with 100% positive and negative predictive power (See Table, Supplemental Digital Content 6, random forest results and classifying miRNAs).
Differentially expressed miRNAs
To identify differentially expressed miRNAs, we used two analysis programs (HTqPCR [29] and DataAssist) and multiple normalization strategies (for details, see Supplemental Methods; Text, Supplemental Digital Content 7, summary of normalization options; and Table, Supplemental Digital Content 8, a comparison of results). 45 miRNAs were significantly differentially expressed in plasma at 10 dpi compared with pre-infection (Fig. 2: miRNAs with corrected p<0.02; se also Table, Supplemental Digital Content 9, presenting all differentially expressed miRNAs). This represents a minimum number of differentially expressed miRNAs for three reasons. First, the significance testing assumes independence of the individual tests, but some miRNAs are co-regulated. Second, alternative analyses suggested several additional candidate differentially expressed miRNAs, such as miR-21 and miR-34a. Third, quantile normalization may mask differences among highly-expressed miRNAs, e.g., miR-21.
Figure 2. miRNAs differentially expressed from pre-infection to ten days post-infection.

Quantile-normalized array data were assessed for significance, with Benjamini-Hochberg correction for multiple comparisons. Differentially expressed miRNAs with p<0.02 (paired, corrected t-test) are shown here. Abbreviations: T statistic (t), adjusted p value (adj. p), and fold change (FC). The right column depicts the normalized threshold cycles of differentially expressed miRNAs (p<0.02, paired t-test) for the six macaques before infection (circles) and during acute infection (arrowheads).
Validation of array results by qPCR
Array results were validated by individual quantitative stem-loop real-time PCR for selected differentially expressed and unchanged miRNAs. Seven differentially expressed RNAs (miRs -1274A, -1233, -190b, -660, -146a, -155, and -34a*) were drawn from HTqPCR analysis; two (-21 and -34a) were from DataAssist analysis, and the tenth was RNU48. The five unchanged miRNAs were let-7b and -130b, -186, -411, and -424. Plasma samples were from the six macaques analyzed by PCR array and four additional macaques. We included up to three pre-infection samples per animal to address the possibility of pre-infection miRNA variations. Eight of ten differentially expressed RNAs were confirmed (Fig. 3A). For miR-155, results were confirmed for the original six animals, but differential expression was not significant in the expanded group. All five miRNAs with no significant changes according to array analysis were confirmed as unchanged (Fig. 3B). A discordant outcome was found for only one miRNA, miR-190b (Fig. 3B, box).
Figure 3. Validation of array results by individual qPCR.
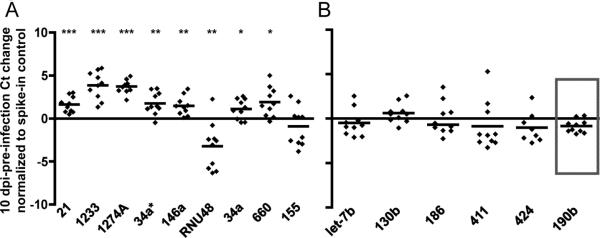
Individual quantitative PCR assays confirmed differential expression (A) or lack thereof (B) for 14 selected RNAs. The box (B) indicates a discordant result for miR-190b, which was differentially expressed according to array analysis. Significance (two-tailed, one-sample t-tests for difference from a theoretical mean of 0) is indicated as: p of 0.01 or below (*), p<0.005 (**), p<0.001 (***). qPCR results were normalized to a spiked-in synthetic control RNA.
Coregulation of differentially expressed miRNAs during acute lentiviral infection
To assess whether plasma miRNAs are related by genomic proximity or transcriptional environment, we performed all pairwise correlations of miRNAs followed by hierarchical clustering (see Figure, Supplemental Digital Content 10, dendrogram depicting related miRNAs). Several miRNAs grouped by genomic proximity. Five of six members of the miR-17-92 cluster [41] were detected. miRs -17, -19b, and -20a grouped together, as did -19a and -92a. miRs -1 and -133a are encoded antisense to the E3 ubiquitin-protein ligase MIB1 on chromosome 18 (human and macaque); their levels correlated significantly (p < 0.005). miRs -193b and -365 were also significantly correlated (p < 0.0002) and located within a 5 kB region on chromosome 16 (human) or 20 (macaque). Other miRNAs may be related by proximity to transcription factor binding sites. miRs -155 and -223, downregulated during acute infection as analyzed by array, correlated significantly (p < 0.0001). Although located on different chromosomes—21 and X (human), 3 and X (macaque)—they are encoded near C/EBPβ and POU-domain transcription factor binding sites. C/EBPβ has activating and inhibitory forms. The latter is preferentially induced by acute innate immune responses [42]. miRs -374a and -374b are encoded near similar binding sites. Their expression levels correlated (p < 0.002), and -374b clustered with miRs-155 and -223.
miRNAs correlate with innate immune responses that predict CNS disease
To investigate the link between plasma miRNAs and innate immune responses with implications for CNS disease, we calculated correlations of plasma miRNA levels with the abundance of two cytokines that predict CNS disease in our model, IL-6 and CCL2. We also wrote a program that integrates results of three miRNA target prediction algorithms to assess the potential for direct miRNA regulation of the macaque IL-6 and CCL-2 3’ UTRs. Negatively correlated miRNAs with predicted target sites are strong candidates for direct regulation of the corresponding transcript. Several miRNAs with negative correlations to CCL2 protein were predicted to interact with the CCL2 3’ UTR (Table 1). However, no miRNAs with positive correlations were predicted. For IL-6, members of the let-7 family, along with miRs -210, -26a, -30b, and -30c, have predictedbinding sites in the 3’ UTR and are negatively correlated (Table 1). Only one positively correlated miRNA has a predicted target. Importantly, human IL-6 is directly regulated by let-7 family members [43], and the human and macaque IL-6 miRNA recognition elements in the 3’ UTR are identical. Here, let-7 members have the strongest correlations with IL-6 (Figure, Supplemental Digital Content 11, let-7e and IL-6 expression).
Table 1. miRNA-cytokine correlations and target predictions.
Differentially expressed plasma miRNAs correlate (r=correlation coefficient) with CSF levels of CCL2 and IL-6 as determined by ELISA.
| CCL2: negative | CCL2: positive | IL-6: negative | IL-6: positive | ||||||||
|---|---|---|---|---|---|---|---|---|---|---|---|
| miRNA | r | TP | miRNA | r | TP | miRNA | r | TP | miRNA | r | TP |
| let-7e | -0.84 | 222 | 0.82 | let-7e | -0.77 | T | 885-5p | 0.71 | |||
| let-7d | -0.80 | 1274B | 0.81 | 409-3p | -0.74 | 1274B | 0.71 | ||||
| let-7g | -0.80 | 885-5p | 0.80 | let-7g | -0.73 | T | 1274A | 0.69 | |||
| 142-3p | -0.78 | 192 | 0.79 | let-7d | -0.67 | TMR | 532-5p | 0.68 | |||
| 30b | -0.76 | See 30c | 1303 | 0.76 | 210 | -0.66 | M | 215 | 0.67 | ||
| 26a | -0.74 | 1233 | 0.74 | 155 | -0.66 | 660 | 0.66 | ||||
| 30c | -0.73 | MM | 1274A | 0.74 | 103 | -0.66 | 192 | 0.66 | |||
| 26b | -0.66 | 1267 | 0.71 | 24-2* | -0.65 | 146a | 0.63 | ||||
| 103 | -0.64 | 215 | 0.69 | 30c | -0.59 | MMRR | 511 | 0.62 | |||
| 301 | -0.61 | 720 | 0.64 | 454 | -0.56 | 132 | 0.62 | ||||
| 150 | -0.58 | 625* | 0.61 | 191 | -0.56 | 1233 | 0.60 | R | |||
| 409-3p | -0.57 | T | 375 | 0.56 | 26a | -0.55 | T | 125b | 0.59 | ||
| 142-5p | -0.56 | MM | 660 | 0.56 | 30b | -0.54 | See 30c | 222 | 0.59 | ||
| 15b | -0.55 | 125b | 0.56 | 142-3p | -0.52 | 1303 | 0.58 | ||||
| 191 | -0.55 | 34a* | 0.55 | 331-3p | -0.51 | 378 | 0.56 | ||||
| 210 | -0.55 | 132 | 0.53 | 1267 | 0.55 | ||||||
| 331-3p | -0.54 | 146a | 0.53 | ||||||||
| 374a | -0.50 | T | 1260 | 0.51 | |||||||
miRNA target algorithms TargetScan (T), miRanda/microRNA.org (M), and RNAHybrid (R) predict target sites (TP) in the 3’ UTR of macaque CCL2 and IL-6 for negatively correlated miRNAs. Repeated letters in the ‘TP’ column denote multiple predicted target sites in a single UTR.
miRNAs correlate with viral load and platelets
We next sought miRNAs that correlate with two additional biomarkers of lentiviral CNS disease: CSF viral load [28] and plasma platelet count [13]. Several plasma miRNAs correlated positively with viral load (see Table, Supplemental Digital Content 12, showing miRNAs correlated with viral load). These miRNAs may be upregulated by the virus or antiviral responses, target the transcripts of antiviral proteins, or directly enhance virus production. We did not find plasma miRNAs with strong negative correlations with virus. In contrast, many miRNAs were found to correlate positively or negatively with platelet count (see Table, Supplemental Digital Content 13, platelet-miRNA correlations).
miRNAs associated with CNS disease severity
RT-qPCR assays also showed that at least six miRNAs— -125b, -21, -34a, -1233, -130b, and -146a—were differentially upregulated in animals that developed severe versus no CNS disease (Fig. 4A). Change in expression was significant for -125b, -21, -34a, and -1233 and approached significance for -130b and -146a. For comparison, there were no significantly different changes for miRs -34a* (the hairpin partner of miR-34a), -155, -1274A, and let-7b.
Figure 4. A subset of miRNA changes during acute infection are associated with CNS disease outcome.
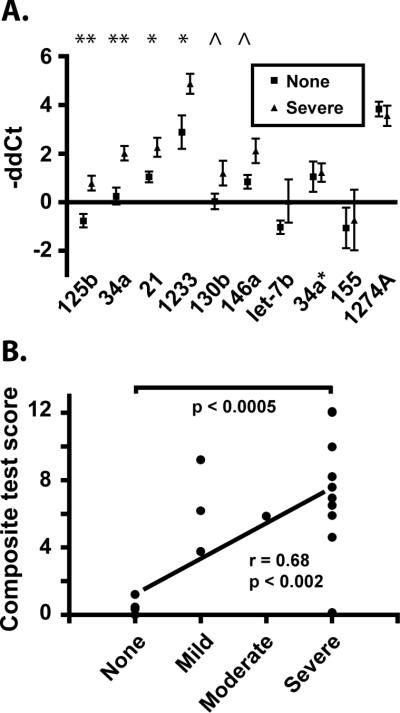
A. RT-qPCR results (-ΔΔCt, with normalization to ath-miR159a spike-in control) from pre-infection to 10 dpi for samples from all ten animals used in the validation of array results were re-analyzed after grouping by known CNS disease outcome: ‘none’ or ‘severe’ pathology. Significance is indicated by ** (p<0.01); * (p<0.05); and ^ (p<0.1). P values were determined by Student's t-test; error bars are standard error of the mean. B. An unweighted composite expression score based on the sum of expression changes of miRNAs -125b, -34a, -21, -1233, -130b, and -146a was calculated for each animal. Expression score means for the group with no apparent CNS disease and the group of all animals with CNS disease were significantly different, as determined by an unpaired, two-tailed t-test with Welch's correction. Values of 1, 2, 3, and 4 were assigned to none, mild, moderate, and severe CNS disease, respectively, for calculation of the correlation coefficient (r).
A six-miRNA expression test predicts CNS disease
A robust predictive tool for HAND or its constituent disorders is likely to consist of multiple components [44]. Therefore, we combined results for the six validated, upregulated miRNAs into an unweighted composite test of expression change. Samples from nine additional animals were added to the analysis, for a total of 19. 13 of 14 animals that developed CNS disease scored higher than all five no-disease controls (Figure 4B; p<0.0005). With values of 0, 1, 2, 3, and 4 assigned to none, mild, moderate, and severe CNS disease, respectively, composite expression scores correlated with outcome severity ( r=0.68, p<0.002). However, omitting the no disease samples, the severity/score correlation was not significant (see also Figure, Supplemental Digital Content 14, graph of individual components of the prediction tool, stressing the necessity of a multi-component predictive tool). Increased expression of these six miRNAs thus associates with CNS disease development.
DISCUSSION
We demonstrate for the first time that acute retroviral infection is accompanied by changes in circulating host miRNA levels, defining a signature that successfully classifies plasma as infected or uninfected. Further, we propose the first circulating miRNA biomarkers for lentivirus-associated CNS disease: six plasma miRNAs, as components of a composite test, predict development of CNS disease in our macaque/SIV model. The conservation of primate miRNAs [38, 39] and the similarities of immunologic and virologic parameters in our model and HIV infection [15, 45, 46] suggest implications for human disease, justifying intensified investigation of plasma miRNAs as biomarkers for HIV-associated diseases.
miRNAs are not simply incidental biomarkers; they can also illuminate disease pathogenesis and accelerate the search for therapeutics. Our results show that let-7 family members, direct regulators of IL-6 [43], inversely correlate with this known predictor of CNS disease in the macaque model. In addition, at the height of IL-10 production [15], miR-146a is upregulated and miR-155 downregulated, mirroring recent results in mouse and human [47, 48]. miRNAs may be important targets for immunotherapy of retrovirus-associated conditions.
miRNAs also correlate with platelet count, another validated predictor of lentiviral CNS disease in macaque and human. Platelets contain an abundance of functional miRNAs [49-52], which play an important regulatory role because only post-transcriptional regulation is possible in these anucleate cell fragments. Platelet decline during retroviral disease can be caused by progenitor deficiency, abnormal activation, immunological destruction, and exposure to high levels of cytokines [53, 54], but reasons for the ties between platelet decline and CNS disease remain unclear. Our data suggest that miRNAs may provide insight into the underlying molecular events, and that platelets are an important source of plasma miRNAs.
The plasma miRNA signature of acute infection likely reflects both virus-specific and general inflammation-associated responses. A subset of signature miRNAs correlate with virus levels. miR-221, reduced in 10 dpi plasma, is similarly suppressed in HIV-transfected cells [55]. In contrast, miR-146a upregulation may be a general response, modulating potentially damaging inflammation. Although several studies have examined plasma miRNA profiles during chronic viral infection (e.g., [56, 57]), comparison with acute infections is needed to pinpoint retrovirus-specific responses within our results.
Curiously, no miRNAs had significant negative correlations with viremia, as one might expect of miRNAs with direct anti-HIV properties, including miR-29 family members [58, 59] and those that inhibit HIV replication through the viral UTR, e.g., in resting CD4+ T lymphocytes [22]. This finding should not, however, be interpreted as inconsistent with antiviral roles for miRNAs. There is no reason to assume that cells with miRNA-mediated virus resistance would specifically export protective miRNAs. Because these cells are only a fraction of those contributing miRNA to the blood, their miRNAs may not be released in amounts sufficient to cause significant change in plasma levels. Furthermore, antiviral miRNAs could be an intrinsic host defense: rising concentrations of viral RNA would shift the balance of miRNA targets, making virus regulation more favorable stoichiometrically or kinetically even without miRNA expression changes.
In contrast, the miRNAs described here are important in the developing, normal, and diseased brain, including miRs -132 (Fragile X [60], Alzheimer's [61]); -155 (Down syndrome [62, 63]); the let-7 family (neuronal differentiation [64], synaptic development [65], opioid receptor regulation [66]);-18a (glucocorticoid receptor/stress [67]); and -103, -191, -30b/c, and -495, which decrease in plasma by 10dpi and regulate the neuroprotective factor BDNF [68]. miRs -155, -26a, and -34a are associated with Interferon beta [40, 69], the most important Type I interferon in brain [70]. Of the six CNS disease-predictive miRNAs (-21, -34a, -125b, -130b, and -146a), at least five are expressed in brain [38, 71]. miR-21 is upregulated by excitotoxic processes, targeting the neuroprotective transcription factor MEF2C in HAND [72]; expression changes are reported in glioblastoma [73] and brain trauma [21]]. miR-34a is involved in neuronal apoptosis and was targeted for knock-down in a murine Alzheimer's Disease (AD) model [74]. miR-125b is implicated in Down Syndrome [63, 75] Fragile X [60], and AD[62]. Also AD-associated [76], miR-146a is upregulated in HIV encephalitis [77] and is tied to Rett syndrome [78] and epilepsy [79]. miR-130b expression marks glioma progression [71].
It is also noteworthy that miR-125b targets p53 [80], whereas miR-34a is stimulated by p53 [81, 82], targets SIRT1 [82], and contributes to replicative senescence [83] and aging in primate brain [84]. Upregulation of miRs -125b and -34a suggests that aging-related regulatory processes are engaged in an escalating conflict during acute infection. The outcome of this arms race could affect long-term predisposition to lentivirus-associated neurologic disease and premature aging.
How and why would plasma biomarkers reflect processes in the CNS? Possible answers are not necessarily mutually exclusive. First, many but not all [14] host responses to infection are shared by periphery and CNS [15, 85]. A second link is the blood-brain barrier (qua “relay station”): plasma or brain miRNAs and cytokines influence barrier signaling or physically cross it. The endothelium is an important source of CNS cytokines [86], and release of miRNAs into circulation would couple plasma miRNAs and CNS cytokines by reciprocal regulation in a common compartment. Further research is needed to show if and how plasma miRNAs move from blood to brain; that brain-derived factors affect peripheral miRNA synthesis ; and that the blood-brain barrier endothelium is an important source of plasma miRNAs.
Third, miRNAs within the CNS may be exported. The physical disruption of brain trauma, in which plasma miRNA profiles change substantially [19], presents an obvious mechanism for miRNA transfer, and vascularization explains miRNA-containing glioblastoma vesicles in blood [18]. However, changes in plasma miRNA during therapy for mental disorders [20] suggest an export process. We posit that miRNAs are released from brain cells, perhaps for signaling purposes [87], and enter circulation through regions with minimal blood-brain barrier (e.g., choroid plexus, hypothalamus) or collect in CSF. CSF is renewed several times each day, its contents filtered into the blood. Concentration in CSF and plasma half-life of theoretical CSF-derived miRNA-containing protein complexes [88], lipoprotein particles [89], or microvesicles would determine the relative concentrations of CSF and plasma miRNAs. Longitudinal CSF and brain tissue profiling, including measurements of acute phase samples, is uniquely possible with the SIV-macaque model and will elucidate links between brain, CSF, and blood miRNAs. It will show how early these miRNAs (and their targets) are affected in brain, and the effect of miRNA regulatory networks on CNS outcomes.
We note that expression change in the individual macaque, not absolute miRNA levels at one time point, was predictive of disease. Ongoing work will establish whether single time-point levels suffice at later stages of infection or whether a pre-infection baseline is a universal requirement. However, this finding has implications for the sensitivity of miRNA testing in general. miRNA biomarkers have been proposed for many diseases and miRNA-based diagnostics are currently in development. Samples from individual patients, stored prior to infection or disease, would provide ideal controls, increasing sensitivity and multiplying the potential applications of miRNA profiling. It may thus be worthwhile to examine the feasibility of banking plasma samples from healthy individuals.
In summary, our observations suggest that physiological changes during acute retroviral infection predict and/or contribute to the pathogenesis of incompletely understood HIV-associated disorders such as HAND and HIV-associated premature aging. Human samples should be studied to confirm that miRNAs, including those reported here, are associated with human disease. Further human and animal studies are needed to determine the extent to which plasma miRNAs affect disease processes, and whether altering their expression therapeutically will influence disease progression. As demonstrated by miR-122 and Hepatitis C virus, for which a miRNA-targeting treatment is effective in non-human primates [90] and has entered Phase II trials, miRNA biomarkers provide clues to disease pathogenesis and furnish novel therapeutic targets. These are urgently needed as the prevalence of HAND continues to rise.
Supplementary Material
Acknowledgements
Funding was provided by the National Institutes of Health (MH070306 to JEC), and by the Johns Hopkins Brain Science Institute. Medical editor Michael Linde contributed to the editing of this manuscript. We thank Joseph L. Mankowski, M. Christine Zink, and Lucio Gama for advice; Suzanne Queen and Brandon Bullock for expert technical assistance; Gerald Vandergrift (Life Technologies) and the JHU DNA Analysis Facility for microarray guidance; and all members of the Molecular and Comparative Pathobiology Retrovirus Laboratory for helpful discussion. Author contributions: study conception and design (KWW and JEC); data acquisition (KWW and SLS); contribution of analysis tools (JL); analysis and interpretation (KWW, SLS, JEC); drafting and/or revision of manuscript (KWW, SLS, JEC); obtained funding (JEC).
Footnotes
- 1st Annual Workshop on HIV and Aging (Baltimore, MD, September, 2010)
- Keystone Symposium on microRNAs and Disease (Banff, AB, February, 2011)
- 18th Conference on Retroviruses and Opportunistic Infections (Boston, MA, 2011)
Publisher's Disclaimer: This is a PDF file of an unedited manuscript that has been accepted for publication. As a service to our customers we are providing this early version of the manuscript. The manuscript will undergo copyediting, typesetting, and review of the resulting proof before it is published in its final citable form. Please note that during the production process errors may be discovered which could affect the content, and all legal disclaimers that apply to the journal pertain.
References
- 1.Simioni S, Cavassini M, Annoni JM, Rimbault Abraham A, Bourquin I, Schiffer V, et al. Cognitive dysfunction in HIV patients despite long-standing suppression of viremia. AIDS. 2010;24:1243–50. doi: 10.1097/QAD.0b013e3283354a7b. [DOI] [PubMed] [Google Scholar]
- 2.Rockstroh J, Guaraldi G, Deray G. HIV and the body: a review of multidisciplinary management. HIV Med. 2010;11(Suppl 2):1–8. doi: 10.1111/j.1468-1293.2010.00859.x. [DOI] [PubMed] [Google Scholar]
- 3.Antinori A, Arendt G, Becker JT, Brew BJ, Byrd DA, Cherner M, et al. Updated research nosology for HIV-associated neurocognitive disorders. Neurology. 2007;69:1789–99. doi: 10.1212/01.WNL.0000287431.88658.8b. [DOI] [PMC free article] [PubMed] [Google Scholar]
- 4.Robertson KR, Smurzynski M, Parsons TD, Wu K, Bosch RJ, Wu J, et al. The prevalence and incidence of neurocognitive impairment in the HAART era. AIDS. 2007;21:1915–21. doi: 10.1097/QAD.0b013e32828e4e27. [DOI] [PubMed] [Google Scholar]
- 5.McArthur JC, Steiner J, Sacktor N, Nath A. Human immunodeficiency virus-associated neurocognitive disorders: Mind the gap. Ann Neurol. 2010;67:699–714. doi: 10.1002/ana.22053. [DOI] [PubMed] [Google Scholar]
- 6.Kaul M. HIV-1 associated dementia: update on pathological mechanisms and therapeutic approaches. Curr Opin Neurol. 2009;22:315–20. doi: 10.1097/WCO.0b013e328329cf3c. [DOI] [PMC free article] [PubMed] [Google Scholar]
- 7.Letendre SL, Ellis RJ, Ances BM, McCutchan JA. Neurologic complications of HIV disease and their treatment. Top HIV Med. 2010;18:45–55. [PMC free article] [PubMed] [Google Scholar]
- 8.Letendre S, Marquie-Beck J, Capparelli E, Best B, Clifford D, Collier AC, et al. Validation of the CNS Penetration-Effectiveness rank for quantifying antiretroviral penetration into the central nervous system. Arch Neurol. 2008;65:65–70. doi: 10.1001/archneurol.2007.31. [DOI] [PMC free article] [PubMed] [Google Scholar]
- 9.Zink MC, Brice AK, Kelly KM, Queen SE, Gama L, Li M, et al. Simian immunodeficiency virus-infected macaques treated with highly active antiretroviral therapy have reduced central nervous system viral replication and inflammation but persistence of viral DNA. J Infect Dis. 2010;202:161–70. doi: 10.1086/653213. [DOI] [PMC free article] [PubMed] [Google Scholar]
- 10.Mankowski JL, Queen SE, Clements JE, Zink MC. Cerebrospinal fluid markers that predict SIV CNS disease. J Neuroimmunol. 2004;157:66–70. doi: 10.1016/j.jneuroim.2004.08.031. [DOI] [PubMed] [Google Scholar]
- 11.Zink MC, Coleman GD, Mankowski JL, Adams RJ, Tarwater PM, Fox K, et al. Increased macrophage chemoattractant protein-1 in cerebrospinal fluid precedes and predicts simian immunodeficiency virus encephalitis. J Infect Dis. 2001;184:1015–21. doi: 10.1086/323478. [DOI] [PubMed] [Google Scholar]
- 12.Wachtman LM, Skolasky RL, Tarwater PM, Esposito D, Schifitto G, Marder K, et al. Platelet decline: an avenue for investigation into the pathogenesis of human immunodeficiency virus -associated dementia. Arch Neurol. 2007;64:1264–72. doi: 10.1001/archneur.64.9.1264. [DOI] [PubMed] [Google Scholar]
- 13.Wachtman LM, Tarwater PM, Queen SE, Adams RJ, Mankowski JL. Platelet decline: an early predictive hematologic marker of simian immunodeficiency virus central nervous system disease. J Neurovirol. 2006;12:25–33. doi: 10.1080/13550280500516484. [DOI] [PubMed] [Google Scholar]
- 14.Alammar L, Gama L, Clements JE. Simian Immunodeficiency Virus Infection in the Brain and Lung Leads to Differential Type I IFN Signaling during Acute Infection. J Immunol. 2011;186:4008–18. doi: 10.4049/jimmunol.1003757. [DOI] [PMC free article] [PubMed] [Google Scholar]
- 15.Witwer KW, Gama L, Li M, Bartizal CM, Queen SE, Varrone JJ, et al. Coordinated regulation of SIV replication and immune responses in the CNS. PLoS One. 2009;4:e8129. doi: 10.1371/journal.pone.0008129. [DOI] [PMC free article] [PubMed] [Google Scholar]
- 16.Edwards JK, Pasqualini R, Arap W, Calin GA. MicroRNAs and ultraconserved genes as diagnostic markers and therapeutic targets in cancer and cardiovascular diseases. J Cardiovasc Transl Res. 2010;3:271–9. doi: 10.1007/s12265-010-9179-5. [DOI] [PubMed] [Google Scholar]
- 17.Cortez MA, Calin GA. MicroRNA identification in plasma and serum: a new tool to diagnose and monitor diseases. Expert Opin Biol Ther. 2009;9:703–11. doi: 10.1517/14712590902932889. [DOI] [PubMed] [Google Scholar]
- 18.Skog J, Wurdinger T, van Rijn S, Meijer DH, Gainche L, Sena-Esteves M, et al. Glioblastoma microvesicles transport RNA and proteins that promote tumour growth and provide diagnostic biomarkers. Nat Cell Biol. 2008;10:1470–6. doi: 10.1038/ncb1800. [DOI] [PMC free article] [PubMed] [Google Scholar]
- 19.Redell JB, Moore AN, Ward Iii NH, Hergenroeder GW, Dash PK. Human traumatic brain injury alters plasma microRNA levels. J Neurotrauma. 2010;27:2147–56. doi: 10.1089/neu.2010.1481. [DOI] [PMC free article] [PubMed] [Google Scholar]
- 20.Rong H, Liu TB, Yang KJ, Yang HC, Wu DH, Liao CP, et al. MicroRNA-134 plasma levels before and after treatment for bipolar mania. J Psychiatr Res. 2010;45:92–5. doi: 10.1016/j.jpsychires.2010.04.028. [DOI] [PubMed] [Google Scholar]
- 21.Lei P, Li Y, Chen X, Yang S, Zhang J. Microarray based analysis of microRNA expression in rat cerebral cortex after traumatic brain injury. Brain Res. 2009;1284:191–201. doi: 10.1016/j.brainres.2009.05.074. [DOI] [PubMed] [Google Scholar]
- 22.Huang J, Wang F, Argyris E, Chen K, Liang Z, Tian H, et al. Cellular microRNAs contribute to HIV-1 latency in resting primary CD4+ T lymphocytes. Nat Med. 2007;13:1241–7. doi: 10.1038/nm1639. [DOI] [PubMed] [Google Scholar]
- 23.Triboulet R, Mari B, Lin YL, Chable-Bessia C, Bennasser Y, Lebrigand K, et al. Suppression of microRNA-silencing pathway by HIV-1 during virus replication. Science. 2007;315:1579–82. doi: 10.1126/science.1136319. [DOI] [PubMed] [Google Scholar]
- 24.Houzet L, Yeung ML, de Lame V, Desai D, Smith SM, Jeang KT. MicroRNA profile changes in human immunodeficiency virus type 1 (HIV-1) seropositive individuals. Retrovirology. 2008;5:118. doi: 10.1186/1742-4690-5-118. [DOI] [PMC free article] [PubMed] [Google Scholar]
- 25.Tatro ET, Scott ER, Nguyen TB, Salaria S, Banerjee S, Moore DJ, et al. Evidence for Alteration of Gene Regulatory Networks through MicroRNAs of the HIV-infected brain: novel analysis of retrospective cases. PLoS One. 2010;5:e10337. doi: 10.1371/journal.pone.0010337. [DOI] [PMC free article] [PubMed] [Google Scholar]
- 26.Noorbakhsh F, Ramachandran R, Barsby N, Ellestad KK, LeBlanc A, Dickie P, et al. MicroRNA profiling reveals new aspects of HIV neurodegeneration: caspase-6 regulates astrocyte survival. Faseb J. 2010;24:1799–812. doi: 10.1096/fj.09-147819. [DOI] [PubMed] [Google Scholar]
- 27.Narayanan A, Kehn-Hall K, Bailey C, Kashanchi F. Analysis of the roles of HIV-derived microRNAs. Expert Opin Biol Ther. 2011;11:17–29. doi: 10.1517/14712598.2011.540564. [DOI] [PubMed] [Google Scholar]
- 28.Zink MC, Suryanarayana K, Mankowski JL, Shen A, Piatak M, Jr., Spelman JP, et al. High viral load in the cerebrospinal fluid and brain correlates with severity of simian immunodeficiency virus encephalitis. J Virol. 1999;73:10480–8. doi: 10.1128/jvi.73.12.10480-10488.1999. [DOI] [PMC free article] [PubMed] [Google Scholar]
- 29.Dvinge H, Bertone P. HTqPCR: high-throughput analysis and visualization of quantitative real-time PCR data in R. Bioinformatics. 2009;25:3325–6. doi: 10.1093/bioinformatics/btp578. [DOI] [PMC free article] [PubMed] [Google Scholar]
- 30.Simon R, Lam A, Li MC, Ngan M, Menenzes S, Zhao Y. Analysis of Gene Expression Data Using BRB-Array Tools. Cancer Inform. 2007;3:11–7. [PMC free article] [PubMed] [Google Scholar]
- 31.Saeed AI, Bhagabati NK, Braisted JC, Liang W, Sharov V, Howe EA, et al. TM4 microarray software suite. Methods Enzymol. 2006;411:134–93. doi: 10.1016/S0076-6879(06)11009-5. [DOI] [PubMed] [Google Scholar]
- 32.Barber SA, Herbst DS, Bullock BT, Gama L, Clements JE. Innate immune responses and control of acute simian immunodeficiency virus replication in the central nervous system. J Neurovirol. 2004;10(Suppl 1):15–20. doi: 10.1080/753312747. [DOI] [PubMed] [Google Scholar]
- 33.Griffiths-Jones S, Grocock RJ, van Dongen S, Bateman A, Enright AJ. miRBase: microRNA sequences, targets and gene nomenclature. Nucleic Acids Res. 2006;34:D140–4. doi: 10.1093/nar/gkj112. [DOI] [PMC free article] [PubMed] [Google Scholar]
- 34.Rehmsmeier M, Steffen P, Hochsmann M, Giegerich R. Fast and effective prediction of microRNA/target duplexes. RNA. 2004;10:1507–17. doi: 10.1261/rna.5248604. [DOI] [PMC free article] [PubMed] [Google Scholar]
- 35.Lewis BP, Burge CB, Bartel DP. Conserved seed pairing, often flanked by adenosines, indicates that thousands of human genes are microRNA targets. Cell. 2005;120:15–20. doi: 10.1016/j.cell.2004.12.035. [DOI] [PubMed] [Google Scholar]
- 36.John B, Enright AJ, Aravin A, Tuschl T, Sander C, Marks DS. Human MicroRNA targets. PLoS Biol. 2004;2:e363. doi: 10.1371/journal.pbio.0020363. [DOI] [PMC free article] [PubMed] [Google Scholar]
- 37.Benjamini Y, Hochberg Y. Controlling the false discovery rate: a practical and powerful approach to multiple testing. Journal of the Royal Statistical Society. 1995;57:289–300. [Google Scholar]
- 38.Shao NY, Hu HY, Yan Z, Xu Y, Hu H, Menzel C, et al. Comprehensive survey of human brain microRNA by deep sequencing. BMC Genomics. 2010;11:409. doi: 10.1186/1471-2164-11-409. [DOI] [PMC free article] [PubMed] [Google Scholar]
- 39.Brameier M. Genome-wide comparative analysis of microRNAs in three non-human primates. BMC Res Notes. 2010;3:64. doi: 10.1186/1756-0500-3-64. [DOI] [PMC free article] [PubMed] [Google Scholar]
- 40.Witwer KW, Sisk JM, Gama L, Clements JE. MicroRNA regulation of IFN-beta protein expression: rapid and sensitive modulation of the innate immune response. J Immunol. 2010;184:2369–76. doi: 10.4049/jimmunol.0902712. [DOI] [PMC free article] [PubMed] [Google Scholar]
- 41.Mendell JT. miRiad roles for the miR-17-92 cluster in development and disease. Cell. 2008;133:217–22. doi: 10.1016/j.cell.2008.04.001. [DOI] [PMC free article] [PubMed] [Google Scholar]
- 42.Dudaronek JM, Barber SA, Clements JE. CUGBP1 is required for IFNbeta-mediated induction of dominant-negative CEBPbeta and suppression of SIV replication in macrophages. J Immunol. 2007;179:7262–9. doi: 10.4049/jimmunol.179.11.7262. [DOI] [PubMed] [Google Scholar]
- 43.Iliopoulos D, Hirsch HA, Struhl K. An epigenetic switch involving NF-kappaB, Lin28, Let-7 MicroRNA, and IL6 links inflammation to cell transformation. Cell. 2009;139:693–706. doi: 10.1016/j.cell.2009.10.014. [DOI] [PMC free article] [PubMed] [Google Scholar]
- 44.McGuire D. CSF biomarkers in HIV dementia: through a glass darkly. Neurology. 2009;73:1942–4. doi: 10.1212/WNL.0b013e3181c51a92. [DOI] [PubMed] [Google Scholar]
- 45.Clements JE, Gama L, Graham DR, Mankowski JL, Zink MC. A simian immunodeficiency virus macaque model of highly active antiretroviral treatment: viral latency in the periphery and the central nervous system. Curr Opin HIV AIDS. 2011;6:37–42. doi: 10.1097/COH.0b013e3283412413. [DOI] [PMC free article] [PubMed] [Google Scholar]
- 46.Clements JE, Mankowski JL, Gama L, Zink MC. The accelerated simian immunodeficiency virus macaque model of human immunodeficiency virus-associated neurological disease: from mechanism to treatment. J Neurovirol. 2008;14:309–17. doi: 10.1080/13550280802132832. [DOI] [PMC free article] [PubMed] [Google Scholar]
- 47.McCoy CE, Sheedy FJ, Qualls JE, Doyle SL, Quinn SR, Murray PJ, et al. IL-10 inhibits miR-155 induction by toll-like receptors. J Biol Chem. 2010;285:20492–8. doi: 10.1074/jbc.M110.102111. [DOI] [PMC free article] [PubMed] [Google Scholar]
- 48.Monk CE, Hutvagner G, Arthur JS. Regulation of miRNA transcription in macrophages in response to Candida albicans. PLoS One. 2010;5:e13669. doi: 10.1371/journal.pone.0013669. [DOI] [PMC free article] [PubMed] [Google Scholar]
- 49.Landry P, Plante I, Ouellet DL, Perron MP, Rousseau G, Provost P. Existence of a microRNA pathway in anucleate platelets. Nat Struct Mol Biol. 2009;16:961–6. doi: 10.1038/nsmb.1651. [DOI] [PMC free article] [PubMed] [Google Scholar]
- 50.Bruchova H, Yoon D, Agarwal AM, Mendell J, Prchal JT. Regulated expression of microRNAs in normal and polycythemia vera erythropoiesis. Exp Hematol. 2007;35:1657–67. doi: 10.1016/j.exphem.2007.08.021. [DOI] [PMC free article] [PubMed] [Google Scholar]
- 51.Kannan M, Atreya C. Differential profiling of human red blood cells during storage for 52 selected microRNAs. Transfusion. 2010;50:1581–8. doi: 10.1111/j.1537-2995.2010.02585.x. [DOI] [PubMed] [Google Scholar]
- 52.Nagalla S, Shaw C, Kong X, Kondkar AA, Edelstein LC, Ma L, et al. Platelet microRNA-mRNA co-expression profiles correlate with platelet reactivity. Blood. 2011 doi: 10.1182/blood-2010-09-299719. Epub ahead of print. [DOI] [PMC free article] [PubMed] [Google Scholar]
- 53.Flaujac C, Boukour S, Cramer-Borde E. Platelets and viruses: an ambivalent relationship. Cell Mol Life Sci. 2010;67:545–56. doi: 10.1007/s00018-009-0209-x. [DOI] [PMC free article] [PubMed] [Google Scholar]
- 54.White MJ, Kile BT. Apoptotic processes in megakaryocytes and platelets. Semin Hematol. 2010;47:227–34. doi: 10.1053/j.seminhematol.2010.03.006. [DOI] [PubMed] [Google Scholar]
- 55.Yeung ML, Bennasser Y, Myers TG, Jiang G, Benkirane M, Jeang KT. Changes in microRNA expression profiles in HIV-1-transfected human cells. Retrovirology. 2005;2:81. doi: 10.1186/1742-4690-2-81. [DOI] [PMC free article] [PubMed] [Google Scholar]
- 56.Li LM, Hu ZB, Zhou ZX, Chen X, Liu FY, Zhang JF, et al. Serum microRNA Profiles Serve as Novel Biomarkers for HBV Infection and Diagnosis of HBV-Positive Hepatocarcinoma. Cancer Res. 2010;70:9798–807. doi: 10.1158/0008-5472.CAN-10-1001. [DOI] [PubMed] [Google Scholar]
- 57.Ji F, Yang B, Peng X, Ding H, You H, Tien P. Circulating microRNAs in hepatitis B virus-infected patients. J Viral Hepat. 2011;18:e242–51. doi: 10.1111/j.1365-2893.2011.01443.x. [DOI] [PubMed] [Google Scholar]
- 58.Ahluwalia JK, Khan SZ, Soni K, Rawat P, Gupta A, Hariharan M, et al. Human cellular microRNA hsa-miR-29a interferes with viral nef protein expression and HIV-1 replication. Retrovirology. 2008;5:117. doi: 10.1186/1742-4690-5-117. [DOI] [PMC free article] [PubMed] [Google Scholar]
- 59.Nathans R, Chu CY, Serquina AK, Lu CC, Cao H, Rana TM. Cellular microRNA and P bodies modulate host-HIV-1 interactions. Mol Cell. 2009;34:696–709. doi: 10.1016/j.molcel.2009.06.003. [DOI] [PMC free article] [PubMed] [Google Scholar]
- 60.Edbauer D, Neilson JR, Foster KA, Wang CF, Seeburg DP, Batterton MN, et al. Regulation of synaptic structure and function by FMRP-associated microRNAs miR-125b and miR-132. Neuron. 2010;65:373–84. doi: 10.1016/j.neuron.2010.01.005. [DOI] [PMC free article] [PubMed] [Google Scholar]
- 61.Lukiw WJ. Micro-RNA speciation in fetal, adult and Alzheimer's disease hippocampus. Neuroreport. 2007;18:297–300. doi: 10.1097/WNR.0b013e3280148e8b. [DOI] [PubMed] [Google Scholar]
- 62.Pogue AI, Cui JG, Li YY, Zhao Y, Culicchia F, Lukiw WJ. Micro RNA-125b (miRNA-125b) function in astrogliosis and glial cell proliferation. Neurosci Lett. 2010;476:18–22. doi: 10.1016/j.neulet.2010.03.054. [DOI] [PubMed] [Google Scholar]
- 63.Kuhn DE, Nuovo GJ, Martin MM, Malana GE, Pleister AP, Jiang J, et al. Human chromosome 21-derived miRNAs are overexpressed in down syndrome brains and hearts. Biochem Biophys Res Commun. 2008;370:473–7. doi: 10.1016/j.bbrc.2008.03.120. [DOI] [PMC free article] [PubMed] [Google Scholar] [Retracted]
- 64.Sempere LF, Freemantle S, Pitha-Rowe I, Moss E, Dmitrovsky E, Ambros V. Expression profiling of mammalian microRNAs uncovers a subset of brain-expressed microRNAs with possible roles in murine and human neuronal differentiation. Genome Biol. 2004;5:R13. doi: 10.1186/gb-2004-5-3-r13. [DOI] [PMC free article] [PubMed] [Google Scholar]
- 65.Corbin R, Olsson-Carter K, Slack F. The role of microRNAs in synaptic development and function. BMB Rep. 2009;42:131–5. doi: 10.5483/bmbrep.2009.42.3.131. [DOI] [PMC free article] [PubMed] [Google Scholar]
- 66.He Y, Yang C, Kirkmire CM, Wang ZJ. Regulation of opioid tolerance by let-7 family microRNA targeting the mu opioid receptor. J Neurosci. 2010;30:10251–8. doi: 10.1523/JNEUROSCI.2419-10.2010. [DOI] [PMC free article] [PubMed] [Google Scholar]
- 67.Uchida S, Nishida A, Hara K, Kamemoto T, Suetsugi M, Fujimoto M, et al. Characterization of the vulnerability to repeated stress in Fischer 344 rats: possible involvement of microRNA-mediated down-regulation of the glucocorticoid receptor. Eur J Neurosci. 2008;27:2250–61. doi: 10.1111/j.1460-9568.2008.06218.x. [DOI] [PubMed] [Google Scholar]
- 68.Mellios N, Huang HS, Grigorenko A, Rogaev E, Akbarian S. A set of differentially expressed miRNAs, including miR-30a-5p, act as post-transcriptional inhibitors of BDNF in prefrontal cortex. Hum Mol Genet. 2008;17:3030–42. doi: 10.1093/hmg/ddn201. [DOI] [PMC free article] [PubMed] [Google Scholar]
- 69.O'Connell RM, Taganov KD, Boldin MP, Cheng G, Baltimore D. MicroRNA-155 is induced during the macrophage inflammatory response. Proc Natl Acad Sci U S A. 2007;104:1604–9. doi: 10.1073/pnas.0610731104. [DOI] [PMC free article] [PubMed] [Google Scholar]
- 70.Griffin DE. Immune responses to RNA-virus infections of the CNS. Nat Rev Immunol. 2003;3:493–502. doi: 10.1038/nri1105. [DOI] [PMC free article] [PubMed] [Google Scholar]
- 71.Malzkorn B, Wolter M, Liesenberg F, Grzendowski M, Stuhler K, Meyer HE, et al. Identification and functional characterization of microRNAs involved in the malignant progression of gliomas. Brain Pathol. 2010;20:539–50. doi: 10.1111/j.1750-3639.2009.00328.x. [DOI] [PMC free article] [PubMed] [Google Scholar]
- 72.Yelamanchili SV, Datta Chaudhuri A, Chen L-N, Xiong H, Fox HS. MicroRNA-21 dysregulates the expression of MEF2C in neurons in monkey and human SIV/HIV neurological disease. Cell Death and Disease. 2010;1:e77. doi: 10.1038/cddis.2010.56. [DOI] [PMC free article] [PubMed] [Google Scholar]
- 73.Chan JA, Krichevsky AM, Kosik KS. MicroRNA-21 is an antiapoptotic factor in human glioblastoma cells. Cancer Res. 2005;65:6029–33. doi: 10.1158/0008-5472.CAN-05-0137. [DOI] [PubMed] [Google Scholar]
- 74.Wang X, Liu P, Zhu H, Xu Y, Ma C, Dai X, et al. miR-34a, a microRNA up-regulated in a double transgenic mouse model of Alzheimer's disease, inhibits bcl2 translation. Brain Res Bull. 2009;80:268–73. doi: 10.1016/j.brainresbull.2009.08.006. [DOI] [PubMed] [Google Scholar]
- 75.Kuhn DE, Nuovo GJ, Terry AV, Jr., Martin MM, Malana GE, Sansom SE, et al. Chromosome 21-derived microRNAs provide an etiological basis for aberrant protein expression in human Down syndrome brains. J Biol Chem. 2010;285:1529–43. doi: 10.1074/jbc.M109.033407. [DOI] [PMC free article] [PubMed] [Google Scholar] [Retracted]
- 76.Cui JG, Li YY, Zhao Y, Bhattacharjee S, Lukiw WJ. Differential regulation of interleukin-1-receptor-associated kinase-1 (IRAK-1) and IRAK-2 by micro RNA-146a and NF-{kappa}B in stressed human astroglial cells and in Alzheimer's disease. J Biol Chem. 2010 doi: 10.1074/jbc.M110.178848. [DOI] [PMC free article] [PubMed] [Google Scholar]
- 77.Rom S, Rom I, Passiatore G, Pacifici M, Radhakrishnan S, Del Valle L, et al. CCL8/MCP-2 is a target for mir-146a in HIV-1-infected human microglial cells. Faseb J. 2010;24:2292–300. doi: 10.1096/fj.09-143503. [DOI] [PMC free article] [PubMed] [Google Scholar]
- 78.Urdinguio RG, Fernandez AF, Lopez-Nieva P, Rossi S, Huertas D, Kulis M, et al. Disrupted microRNA expression caused by Mecp2 loss in a mouse model of Rett syndrome. Epigenetics. 2010;5 doi: 10.4161/epi.5.7.13055. Epub ahead of print. [DOI] [PMC free article] [PubMed] [Google Scholar]
- 79.Aronica E, Fluiter K, Iyer A, Zurolo E, Vreijling J, van Vliet EA, et al. Expression pattern of miR-146a, an inflammation-associated microRNA, in experimental and human temporal lobe epilepsy. Eur J Neurosci. 2010;31:1100–7. doi: 10.1111/j.1460-9568.2010.07122.x. [DOI] [PubMed] [Google Scholar]
- 80.Le MT, Teh C, Shyh-Chang N, Xie H, Zhou B, Korzh V, et al. MicroRNA-125b is a novel negative regulator of p53. Genes Dev. 2009;23:862–76. doi: 10.1101/gad.1767609. [DOI] [PMC free article] [PubMed] [Google Scholar]
- 81.Chang TC, Wentzel EA, Kent OA, Ramachandran K, Mullendore M, Lee KH, et al. Transactivation of miR-34a by p53 broadly influences gene expression and promotes apoptosis. Mol Cell. 2007;26:745–52. doi: 10.1016/j.molcel.2007.05.010. [DOI] [PMC free article] [PubMed] [Google Scholar]
- 82.Yamakuchi M, Ferlito M, Lowenstein CJ. miR-34a repression of SIRT1 regulates apoptosis. Proc Natl Acad Sci U S A. 2008;105:13421–6. doi: 10.1073/pnas.0801613105. [DOI] [PMC free article] [PubMed] [Google Scholar]
- 83.Fujita K, Mondal AM, Horikawa I, Nguyen GH, Kumamoto K, Sohn JJ, et al. p53 isoforms Delta133p53 and p53beta are endogenous regulators of replicative cellular senescence. Nat Cell Biol. 2009;11:1135–42. doi: 10.1038/ncb1928. [DOI] [PMC free article] [PubMed] [Google Scholar]
- 84.Somel M, Guo S, Fu N, Yan Z, Hu HY, Xu Y, et al. MicroRNA, mRNA, and protein expression link development and aging in human and macaque brain. Genome Res. 2010;20:1207–18. doi: 10.1101/gr.106849.110. [DOI] [PMC free article] [PubMed] [Google Scholar]
- 85.Kaul M, Lipton SA. Mechanisms of neuroimmunity and neurodegeneration associated with HIV-1 infection and AIDS. J Neuroimmune Pharmacol. 2006;1:138–51. doi: 10.1007/s11481-006-9011-9. [DOI] [PubMed] [Google Scholar]
- 86.Langford D, Masliah E. Crosstalk between components of the blood brain barrier and cells of the CNS in microglial activation in AIDS. Brain Pathol. 2001;11:306–12. doi: 10.1111/j.1750-3639.2001.tb00401.x. [DOI] [PMC free article] [PubMed] [Google Scholar]
- 87.Camussi G, Deregibus MC, Bruno S, Cantaluppi V, Biancone L. Exosomes/microvesicles as a mechanism of cell-to-cell communication. Kidney Int. 2010;78:838–48. doi: 10.1038/ki.2010.278. [DOI] [PubMed] [Google Scholar]
- 88.Arroyo JD, Chevillet JR, Kroh EM, Ruf IK, Pritchard CC, Gibson DF, et al. Argonaute2 complexes carry a population of circulating microRNAs independent of vesicles in human plasma. Proc Natl Acad Sci U S A. 2011;108:5003–8. doi: 10.1073/pnas.1019055108. [DOI] [PMC free article] [PubMed] [Google Scholar]
- 89.Vickers KC, Palmisano BT, Shoucri BM, Shamburek RD, Remaley AT. MicroRNAs are transported in plasma and delivered to recipient cells by high-density lipoproteins. Nat Cell Biol. 2011;13:423–33. doi: 10.1038/ncb2210. [DOI] [PMC free article] [PubMed] [Google Scholar]
- 90.Lanford RE, Hildebrandt-Eriksen ES, Petri A, Persson R, Lindow M, Munk ME, et al. Therapeutic silencing of microRNA-122 in primates with chronic hepatitis C virus infection. Science. 2010;327:198–201. doi: 10.1126/science.1178178. [DOI] [PMC free article] [PubMed] [Google Scholar]
Associated Data
This section collects any data citations, data availability statements, or supplementary materials included in this article.