

Abstract
Purpose: Functional magnetic resonance imaging (fMRI)-based resting functional connectivity is well suited for measuring slow correlated activity throughout brain networks. Epilepsy involves chronic changes in normal brain networks, and recent work demonstrated enhanced resting fMRI connectivity between the hemispheres in childhood absence epilepsy. An animal model of this phenomenon would be very valuable for investigating fundamental mechanisms and testing therapeutic interventions. Methods: We used fMRI-based resting functional connectivity for studying brain networks involved in absence epilepsy. Wistar Albino Glaxo rats from Rijswijk (WAG/Rij) exhibit spontaneous episodes of staring and unresponsiveness accompanied by spike-wave discharges (SWD) resembling human absence seizures in behavior and electroencephalography (EEG). Simultaneous EEG–fMRI data in epileptic WAG/Rij rats in comparison to non-epileptic Wistar controls were acquired at 9.4 T. Regions showing cortical fMRI increases during SWDs were used to define reference regions for connectivity analysis to investigate whether chronic seizure activity is associated with changes in network resting functional connectivity. Key findings: We observed high degrees of cortical-cortical correlations in all WAG/Rij rats at rest (when no SWD were present), but not in non-epileptic controls. Strongest connectivity was seen between regions most intensely involved in seizures, mainly in the bilateral somatosensory and adjacent cortices. Group statistics revealed that resting interhemispheric cortical-cortical correlations were significantly higher in WAG/Rij rats compared to non-epileptic controls. Significance: These findings suggest that activity-dependent plasticity may lead to long-term changes in epileptic networks even at rest. The results show a marked difference between the epileptic and non-epileptic animals in cortical-cortical connectivity, indicating that this may be a useful interictal biomarker associated with the epileptic state.
Keywords: Resting functional connectivity, spike-wave seizure, fMRI, cortex, thalamus
Introduction
Absence seizures are brief staring spells, which occur most commonly in children and are accompanied by large amplitude 3–4 Hz spike–wave discharges (SWD) on electroencephalography (EEG). SWD–associated blood oxygenation level–dependent (BOLD) fMRI changes are bilateral and symmetric in children (Archer et al., 2003; Salek-Haddadi et al., 2003; Gotman et al., 2005; Hamandi et al., 2006; Berman et al., 2010) as well as in animal models (Tenney et al., 2003; Nersesyan et al., 2004a; Mishra et al., 2011b). Absence epilepsy is increasingly recognized as a disorder characterized by impaired function both during and between seizures (Blumenfeld, 2005; Hughes, 2009). Evidence from animal models indicates that this bilateral synchrony during SWD is mediated by the corpus callosum (Musgrave and Gloor, 1980; Vergnes et al., 1989; Chahboune et al., 2009).
Brain networks exhibit long and short range synchronous activity at multiple time scales (Sporns, 2009). Slow, < 0.1 Hz, synchronous fluctuations in hemodynamic signals occur at rest without stimulation (Golanov et al., 1994; Biswal et al., 1995). FMRI based resting functional connectivity is well suited for measuring slow correlated activity throughout the brain. Resting functional connectivity analysis has identified brain networks related to sensory, motor, attention, or other functions in humans (Biswal et al., 1995; Lowe et al., 1998; Cordes et al., 2001; Raichle et al., 2001) and also in animal models (Vincent et al., 2007; Pawela et al., 2008; Zhao et al., 2008; Wu et al., 2009). Resting functional connectivity has been studied in several human disease states including Alzheimer’s disease, multiple sclerosis, depression, and others (Li et al., 2002; Lowe et al., 2002; Greicius, 2008), as well as in partial epilepsy (Waites et al., 2006; Bettus et al., 2009; Pereira et al., 2010) and generalized epilepsy (Bai et al., 2011; Zhang et al., 2011). We recently found in human patients with typical childhood absence epilepsy that there is abnormally increased resting connectivity between the two hemispheres even when seizures are not occurring (Bai et al., 2011). In the interictal period, this increased bihemispheric synchrony was most evident in cortical areas intensely involved in seizures during the ictal period.
In the present study, we performed functional MR imaging in epileptic and non–epileptic control rat brain with the hypothesis that the bilateral synchronous nature of absence epilepsy pathophysiology leads to abnormally enhanced resting functional connectivity between the two hemispheres in specific brain regions involved in the disorder. The availability of an animal model with abnormal connectivity similar to humans would be highly valuable for experimental testing of therapeutic interventions in preventing chronic changes in generalized epilepsy. To examine this hypothesis, we first analyzed simultaneous EEG–fMRI of SWDs to identify brain regions involved in SWDs. We then used these regions of interest (ROIs) to compare resting functional connectivity between the hemispheres in the Wistar Albino Glaxo rats from Rijswijk (WAG/Rij) rat absence epilepsy model (Coenen and Van Luijtelaar, 1987; Coenen and Van Luijtelaar, 2003) with non–epileptic Wistar control rats.
Materials and Methods
All experimental procedures were in full compliance with Yale University Institutional Animal Care and Use protocols approved in agreement with the National Institutes of Health. Data from eleven female WAG/Rij (Harlan, Indianapolis, IN) aged 7.3 ± 1.2 months [mean ± standard deviation (SD); range, 5.9–9.5 months] with an average weight of 222 ± 1 g (mean ± SD) and five Wistar non–epileptic control female rats (Charles River Laboratories, Raleigh, NC) aged 7.3 ± 0.1 months (mean ± SD, range, 7–7.5 months) with an average weight of 300 ± 5.6 g (mean ± SD) were included in this study.
Animal preparation
Animal preparation and anesthesia has been described in detail previously (Mishra et al., 2011b). Briefly, anesthesia was induced using 1.5% halothane and later switched to intravenous (i.v.) fentanyl (40 μg/Kg) and intraperitoneal (i.p.) haloperidol (1 mg/Kg). To prevent any movements during the fMRI experiments and to facilitate artificial breathing, rats were paralyzed by i.v. injections of 0.5 mg/kg D-tubocurarine chloride every 2 hours, tracheotomized and artificially ventilated. Level of anesthesia was assessed by heart rate, blood pressure, and continuous EEG monitoring. Anesthesia was maintained by injection of a similar dose of fentanyl and haloperidol every 45 minutes. One femoral vein was cannulated and an i.p. line was placed for the injections of anesthetics. A femoral artery was cannulated for continuous arterial blood pressure monitoring and periodic blood sampling for measurements of blood gases and pH. All physiological values (blood gases, mean arterial blood pressure [MABP], and pH) were maintained within physiological range throughout the experiments in both groups, by adjusting respiration and level of anesthesia throughout the experiments. The body temperature of the rat was monitored with a rectal probe and kept constant at 370C using a water heating pad.
MRI experiments were acquired in experimental runs lasting for 30 min, with one to three runs obtained per experiment. Under these conditions epileptic animals typically have multiple episodes of spontaneous SWDs as described in our previous studies (Nersesyan et al., 2004b; Nersesyan et al., 2004a; Mishra et al., 2011b) as well as epochs lasting up to a few minutes without SWDs.
EEG–fMRI experiments
Data from the WAG/Rij rats were analyzed separately for experimental runs (and animals) with vs. without SWD. Of the eleven WAG/Rij rats, six had SWD during EEG–fMRI (7 runs). For this group (WAG/Rij Group I), we used only those experiments where WAG/Rij rats had SWDs and part of the time they also had no SWDs (resting state) in the same experimental run. Experiments without epochs of resting fMRI data lasting at least 180 seconds were excluded from the analysis. Experimental runs from WAG/Rij rats without any SWD were analyzed as a separate group (WAG/Rij Group II), and were obtained from one rat (2 runs) who also had SWD in other runs, as well as five WAG/Rij rats without any SWD (9 runs; total of 11 runs from WAG/Rij without SWD). Data were also obtained from five Wistar non–epileptic control rats (12 runs). Wistar control rats did not have any SWD during fMRI experiments.
During MRI recordings, the rat was positioned prone in a specially designed plastic holder with the head fixed and bregma positioned at the center of the surface coil. The animals were then inserted into the magnet with its head positioned at the isocenter of the magnet. EEG signals were acquired simultaneously with fMRI as described in detail previously (Mishra et al., 2011b). Briefly, EEG signals were recorded using a pair of 1-mm-diameter carbon-filament electrodes (WPI), placed between the scalp and the upper surface of the skull in the frontal and occipital areas. EEG signals were amplified and filtered (1–30 Hz) using a model 79D Data Recording System (Grass Instruments), digitized and recorded (sampling rate, 1000 Hz) using a CED Micro 1401 and Spike 2 software (Cambridge Electronics Design).
All fMRI experiments were acquired on a 9.4 T Bruker horizontal bore (16 cm internal diameter) spectrometer (Bruker Avance, Billerica, MA), equipped with passively shielded shim/gradient coils (47.5 G/cm) operating at 400.5 MHz for protons. The transceiver system consisted of a proton resonator radio frequency surface coil (15.18 mm diameter) for transmission of radio frequency pulses and receiving. The system was shimmed before each experiment using global manual shimming to optimize the homogeneity of the static magnetic field.
Anatomical images for each animals were acquired with the fast low angle shot sequence, 11 interlaced slices in the coronal plane with repetition time (TR), 500 ms; echo time (TE), 6 ms; flip angle, 40–55°; field of view (FOV), 25 × 25 mm; matrix size, 256 × 256; in–plane resolution, 98 × 98 μm; and slice thickness, 1000 μm, without gap. BOLD fMRI data were obtained in the same planes as anatomical images. All data were acquired using single–shot spin echo, echo planar imaging (SE–EPI) with the following parameters: TR, 1000 ms; TE, 25 ms; excitation flip angle, 90°; inversion flip angle, 180°; FOV, 25 × 25 mm; matrix size, 64 × 64; in–plane resolution, 390 × 390 μm; and slice thickness, 1000 μm without gap. All 30 SE–EPI BOLD fMRI experimental runs were acquired with 11 slices. Eighteen of 30 experimental runs were acquired on WAG/Rij rats (n = 11) whereas, 12 experimental runs were acquired on Wistar control rats (n = 5). Images in 25 of these experimental runs were acquired every 6 s over 1800 s (NR = 300 images); images in 5 experimental runs were acquired every 3 s (over 1800 s for 3 runs with NR = 600 images; over 1350 s for 2 runs with NR = 450 images). Twenty–four dummy scans occurred before the receiver was turned on and were not included in the data. Dummy scans were used to ensure that the proton spin system was in a steady state before data were collected.
EEG analysis
All EEG signals acquired during fMRI experiments were first processed using Spike 2 software, and methods were used to reduce magnetic field–induced artifacts similar to those described previously (Englot et al., 2008; Mishra et al., 2011b). All EEG data acquired during fMRI experiments were marked for individual SWD onset and offset time in Spike 2 software manually using scripts provided by CED (Cambridge, UK). SWDs were defined as large–amplitude (more than two times the baseline EEG peak-to-peak amplitude) rhythmic 5–8 Hz discharges with typical spike–wave morphology lasting > 1.0 s (Coenen and Van Luijtelaar, 1987; Blumenfeld et al., 2008; Mishra et al., 2011b). The SWD onset and offset time marks were used for all subsequent analyses of fMRI data. Overall mean SWD duration for all experiments was 1.91 ± 0.42 s (mean ± SD, standard deviation; N = 240 SWDs total). Epochs of resting fMRI were defined as periods lasting at least 180 s without SWD (even with duration < 1s) seen on EEG. To further ensure that resting state epochs were not contaminated by SWD-induced fMRI changes, we discarded fMRI data from 40 seconds before until 60 seconds after any SWD adjacent to the selected resting fMRI epochs we used. While human studies have shown prolonged fMRI changes after SWD (Moeller et al., 2008; Bai et al., 2010), in the WAG/Rij rat the fMRI signal returns to baseline within ~10 seconds of SWD end (e.g. see Mishra et. al., 2011b, Fig 3) so that 60 seconds should be a reasonable safety margin in this model.
Figure 3.
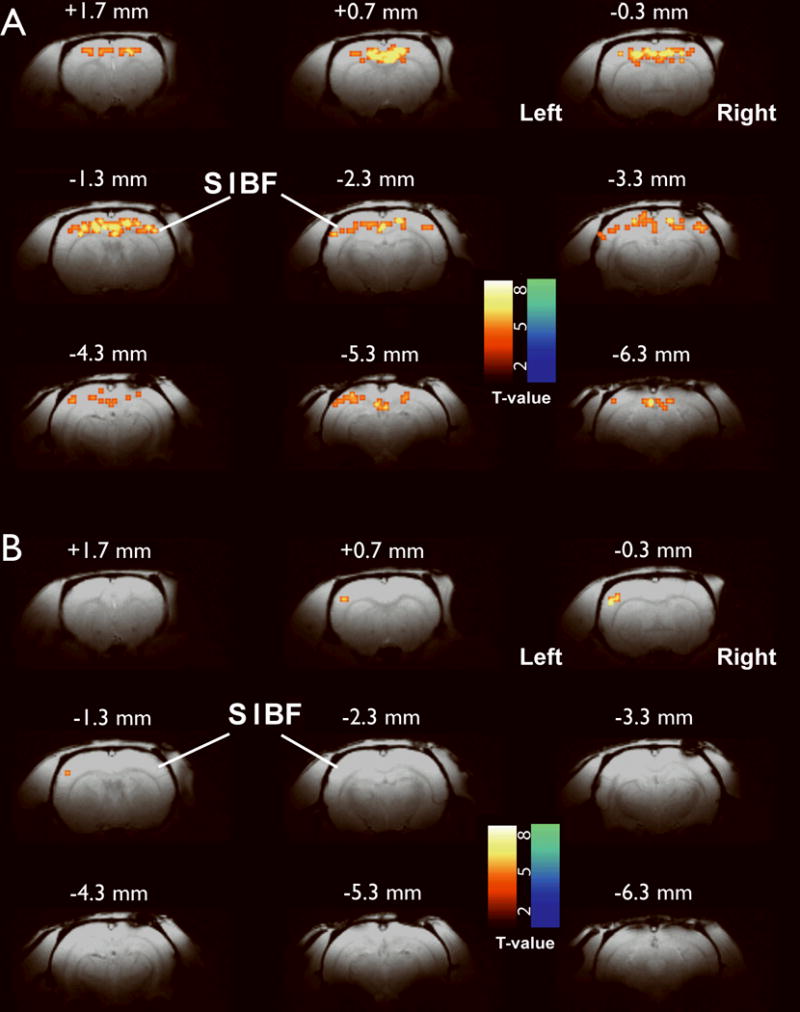
Resting functional connectivity differences in epileptic WAG/Rij rats and Wistar control rats. Left cortex reference region of interest (see Supporting Fig. 1) versus whole brain. (A) WAG/Rij rats (n = 6 rats, 7 experimental runs) show increased connectivity in contralateral somatosensory and adjacent cortices. (B) Wistar control rats (n = 5 rats, 12 experimental runs) show only localized connectivity in the ipsilateral (left) somatosensory cortex. Increases are in warm colors and decreases are in cold colors. Very similar results were obtained using the right cortex ROI as reference (see Supporting Information, Figure S2).
To facilitate mapping of fMRI data, SWD onset time was used as ‘time 0’ for binning and analyzing time-series data across multiple SWDs. Temporally aligning the onset time of multiple SWDs allowed mean changes to be determined in specific time bins after SWD onset.
Analysis of SWD fMRI data
FMRI images were processed for SWD-related changes using an in–house program running on a MATLAB platform (The MathWorks, Inc., Natick, MA) as described previously (Mishra et al., 2011b). Briefly, all fMRI series were first screened for movement to ensure that all runs exhibited movement of less than 20% of a pixel in either the X or Y direction. Analysis was then performed using 2 s time bins, temporally aligning all SWD episodes by setting SWD onset as time 0. Baseline was obtained for each SWD episode using any images acquired during the 6.5s interval preceding each SWD, with the additional requirement that no images were included in baseline if a preceding SWD event continued or ended within 3 s of image onset. If more than one image occurred during the baseline interval for any given SWD these were averaged to obtain a single baseline image. BOLD fMRI t-maps were calculated using a paired t-test where each pair consisted of one baseline image (defined above) and one seizure image acquired in the time bin 2–4 s after seizure onset, because this time bin showed maximum changes in fMRI signals. T-maps were obtained across multiple SWD episodes (n = 240 SWD in 6 WAG/Rij rats) and displayed using threshold t > 2. Based on our prior experience with this model and the signal-to-noise ratio of our data acquisition system, this threshold is reasonably conservative and provides physiologically interpretable results. These experimental runs are the same experiments in WAG/Rij rats where we had both seizure and resting state in the same animals (WAG/Rij Group I, see above). The group t-map was superimposed onto high–resolution anatomical images and regional changes were identified based on a standard rat atlas (Paxinos and Watson, 1998).
Resting fMRI correlation analysis
Two regions of interest (ROI) for resting functional connectivity analysis were constructed based on group t maps of SWD–related changes (Fig. 1) using a growing region approach (MatLab 7.1, MathWorks, Natick, MA). For each hemisphere of the brain, a region was identified by selecting a voxel near the largest cortical (face somatosensory cortex) group t-map increase, and neighboring voxels were then added within the same hemisphere exceeding a t-value threshold > 2. The two ROIs obtained in this manner are shown in Supporting Fig. 1. We then identified epochs of at least 180 s on the EEG without SWDs (resting data) in the epileptic WAG/Rij rats (WAG/Rij Group I) and analyzed resting fMRI during these time periods. We analyzed all epochs of resting data in each run.
Figure 1.
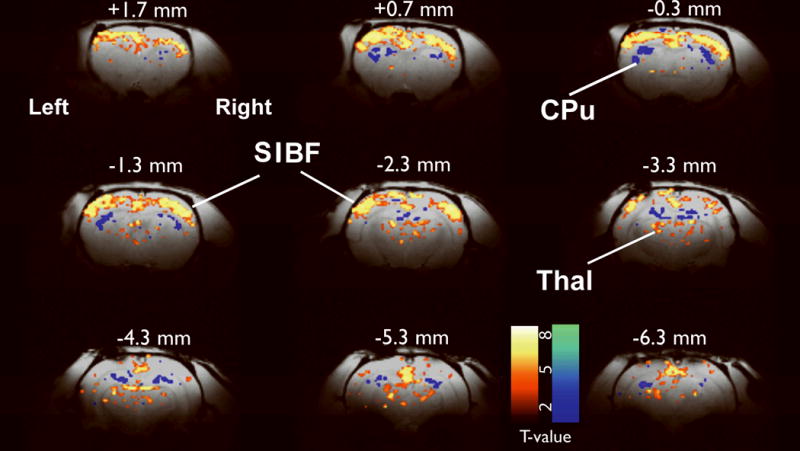
Mapping fMRI changes during spike–wave seizures. Prominent increases were seen in bilateral somatosensory cortex (S1BF), with additional increases seen in several other areas including thalamus (Thal). Decreases were most prominent in the caudate–putamen (CPu). Simultaneous EEG was used to identify images obtained 2–4 s after SWD onset for comparison with baseline images and calculation of t-maps (threshold t > 2) as reported previously (Mishra et al., 2011b). Results are displayed on high-resolution anatomical images. Slices are shown from anterior to posterior, with approximate coordinates relative to bregma (Paxinos and Watson, 1998). Color bars indicate t values for fMRI increases (warm colors) and decreases (cold colors). N = 240 SWD in 5 rats.
The fMRI time–varying signals of interest for resting functional connectivity analysis are typically slow, so we applied a 0.08 Hz low–pass filter to the fMRI data as described previously (Biswal et al., 1995; Hampson et al., 2006; Lu et al., 2007; Zhao et al., 2008). Analysis was restricted to voxels within the brain boundary. Image coregistration was performed using automated point based registration in Bioimage Suite (http://www.bioimagesuite.org/). We coregistered all animal’s images to one image set from within the WAG/Rij rat group. Nine of the 11 matching (centrally located) slices were used after co–registration for final analysis at the group level.
An ROI-based connectivity approach was used for resting functional connectivity analysis (Biswal et al., 1995; Lowe et al., 1998; Lu et al., 2007; Zhao et al., 2008; Bai et al., 2011; Killory et al., 2011) using in-house software written by one of the authors (XB) in MATLAB 7.1. For each experimental run from each WAG/Rij rat, a reference time course for each ROI was calculated by averaging the time courses of all voxels within this ROI during the epochs of resting data (defined above). We then calculated the Pearson’s correlation coefficients between the reference time course for each ROI and all voxels within the brain. The correlation (r) maps were then converted to z score maps by Fisher’s z transform, using the transform equation z(r) = 0.5ln [(1 + r)/(1 − r)] (Jenkins and Watts, 1968). To normalize for differences in number of resting images in different experimental runs, each z score was divided by the square root of variance, calculated as 1/√ (n – 3), where n is the degrees of freedom defined as the number of image acquisitions (used for analysis) within each run. For one WAG/Rij rat two experimental runs were obtained, so the z score maps for the two runs were averaged. Thus for the 6 WAG/Rij rats with SWD (WAG/Rij Group I) this resulted in a total of 6 z-score maps, with the 2 ROIs yielding a total of 12 z-score maps.
To compare the WAG/Rij data to Wistar controls, we matched the duration and timing within the run of each WAG/Rij epoch to identical times across all Wistar control runs. We thus obtained time-matched data from the Wistar controls, again yielding 6 z-score maps with 2 ROIs resulting in a total of 12 control z-score maps. The same analysis was also performed on the 6 WAG/Rij rats who had runs without any SWD (WAG/Rij Group II).
We next performed two types of connectivity analysis on the group data (Bai et al., 2011). First we examined connectivity between each ROI and all other brain regions by constructing t maps in the WAG/Rij and Wistar control groups. This approach allowed us to examine connectivity between the mean fMRI timecourse in a single reference ROI (defined above) and the whole brain on a voxel-by-voxel basis. To accomplish this, the individual z-score maps of each group for each reference ROI were entered into a second-level, one sample t test (P < 0.01 uncorrected; cluster extent threshold = 3 voxels) in SPM 2 (www.fil.ion.ucl.ac.uk/spm/spm2.html) on a MATLAB 7.1 platform. Second, we calculated connectivity between each ROI and its corresponding ROI in the contralateral hemisphere. For this analysis, we computed the between-hemisphere connectivity as the average z-score in the ROI contralateral to the reference ROI for each subject. In this approach, if the left ROI was used as the reference, this yielded a single timecourse for the left ROI and a set of z-scores for the corresponding right ROI which were averaged to calculate one connectivity value. When the right ROI was used as the reference, the z-scores for each voxel in the left ROI were averaged. Thus each interhemispheric pair of corresponding ROIs yielded two connectivity values, which were generally similar but not identical. For group statistical analyses, we then performed one-way analysis of variance followed by Tukey’s Honestly Significant Difference (HSD) (Kirk, 1995) method for post-hoc pairwise comparisons (significance threshold p < 0.05) to assess group differences in WAG/Rij versus nonepileptic Wistar control rats. HSD is the most conservative approach for post-hoc pair-wise comparisons with ANOVA.
Results
BOLD fMRI signal changes in SWD epilepsy
BOLD fMRI mapping during a total of 240 SWDs (in 6 rats) showed both increases and decreases in multiple cortical and subcortical regions (Fig. 1). As reported previously (Nersesyan et al., 2004a; David et al., 2008; Mishra et al., 2011b), we found intense bilateral increased BOLD fMRI signals in face somatosensory cortex (S1BF). We also saw increases in other cortical regions adjacent to somatosensory cortex, in the thalamus, anterior and posterior cingulate, as well as prominent bilateral decreases in the BOLD fMRI signal in caudate–putamen (CPu) (Fig. 1). Analysis of baseline versus baseline BOLD fMRI images did not show significant changes in any brain region (data not shown).
Increased connectivity between the hemispheres in WAG/Rij epileptic rats at rest
We found significantly increased resting connectivity in the epileptic rats (WAG/Rij Group I) between cortical regions most intensely involved in seizures in the left and right hemispheres. Left and right mean fMRI signal time courses in reference regions at rest when SWDs are not occurring in WAG/Rij rats (Fig. 2A) showed high correlation between the left and right regions. In contrast, non–epileptic Wistar control rats (Fig. 2B) showed less interhemispheric correlation. We performed group analyses using these reference regions by correlating them both with the whole brain (Fig 3) and more specifically with the contralateral reference region (Fig. 4). First, to determine which regions overall are most correlated at rest with the regions most intensely involved by seizures, we correlated each cortical SWD reference region with the time course of all other voxels in the brain at rest, when no SWD were present. In the WAG/Rij Group I data, bilateral cortical areas including somatosensory and adjacent cortices, where seizures are most intense, showed high degrees of resting functional connectivity with the left cortical reference region (Fig. 3A). Very similar results were obtained using the right cortical seizure region as reference (Fig S2). In contrast, much less correlation with the reference region was observed when the same anatomical region was analyzed in non–epileptic Wistar control rats (Fig. 3B). In reviewing maps from individual animals (data not shown), we observed similar high degrees of cortical–cortical correlations between the hemispheres in 100 % or 6 of 6 WAG/Rij Group I rats studied compared to 0% or 0 of 5 non–epileptic Wistar controls, suggesting this is a robust measure which may ultimately be useful for testing individual subjects. Basal ganglia interestingly did not show high positive or negative correlations with the reference regions at rest (Fig. 3), despite strong negative fMRI signals during SWDs (Fig. 1).
Figure 2.
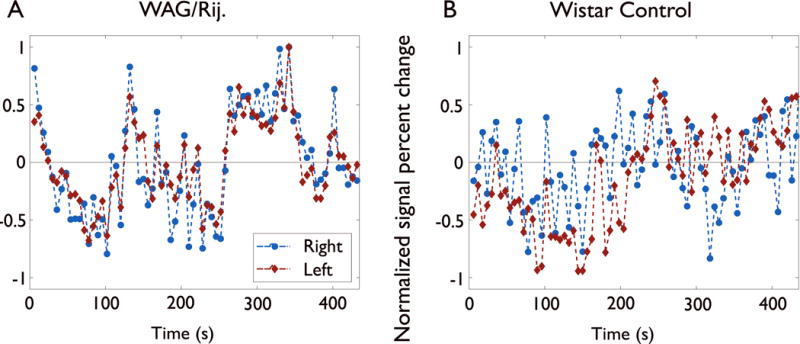
Examples of left and right mean fMRI signal time courses in reference regions (Supporting Fig. 1) at rest when SWDs are not occurring. WAG/Rij rat (A) shows high correlation between slow (< 0.1 Hz) changes in left and right reference regions. Non–epileptic Wistar control rat (B) shows less interhemispheric correlation in left and right reference regions.
Figure 4.
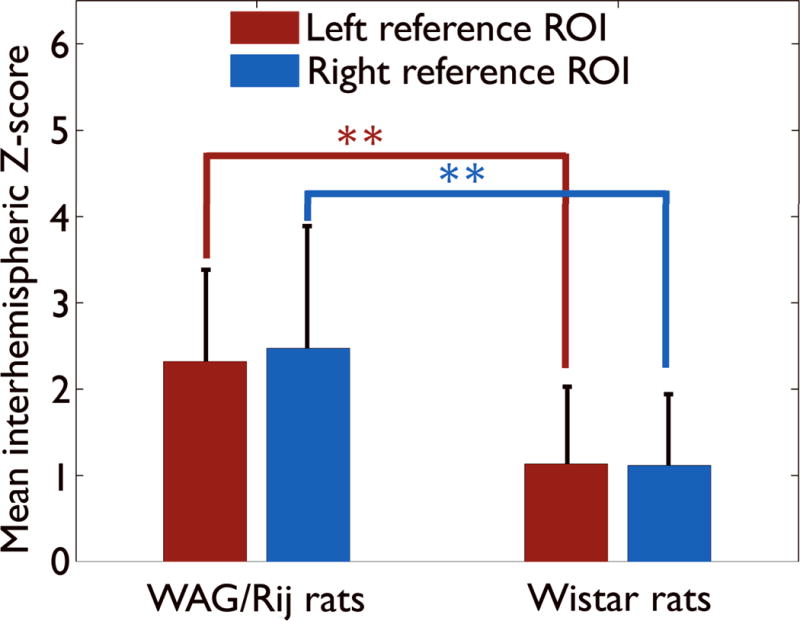
Interhemispheric resting state cortical connectivity. Increased interhemispheric resting cortical connectivity in WAG/Rij rats (mean ± standard deviation of z–scores, from left and right brain regions, 2.31 ± 1.06 and 2.47 ± 1.41, respectively) compared to non–epileptic Wistar controls (1.13 ± 0.23 and 1.11 ± 0.18). Epileptic WAG/Rij: n = 6 rats, 7 experiments. Wistar controls: n = 5 rats, 12 experiments. (** p = 0.01, one-way ANOVA followed by Tukey’s HSD method for post-hoc pairwise comparisons). Results were very similar using either the left ROI time course as reference (red) and calculating mean z-score for all voxels in the right ROI, or using the right ROI time course as reference (blue).
As another approach to obtain group statistics comparing WAG/Rij and control animals, we analyzed specific region–to–region connectivity between the left and right cortical reference functions (Fig. 4). Resting interhemispheric cortical–cortical correlations (Fig. 4) were significantly higher in Group I WAG/Rij rat data at rest (when no SWDs were present) compared to Wistars (p < 0.01). Interhemispheric resting cortical connectivity in WAG/Rij rats was increased in left reference region to right cortex, (mean ± SD of z–score, 2.31 ± 1.06) and right reference region to left cortex (mean ± SD of z–score, 2.47 ± 1.41) compared to left reference region to right cortex (mean ± SD of z–score, 1.13 ± 0.23) and right reference region to left cortex (mean ± SD of z–score, 1.11 ± 0.18) in non–epileptic Wistar controls.
For comparison, we also performed resting connectivity analysis in runs from WAG/Rij rats without any SWD (WAG/Rij Group II). Connectivity values were intermediate between the WAG/Rij Group I and Wistar control data, and also showed greater variability (larger group SD). For WAG/Rij Group II runs without any SWD (n = 6 rats, 11 runs) means z-score for left reference region to right cortex was 1.62 ± 0.42 (mean ± SD) and for right reference region to left cortex it was 1.27 ± 0.44. Neither was significantly different from WAG/Rij Group I or from controls.
Discussion
Our results show increased correlation in low frequency BOLD fMRI fluctuations in the seizure onset regions between hemispheres of WAG/Rij rat genetic model of absence epilepsy. While most prior studies of brain disorders showed decreased connectivity (Auer, 2008), it is reasonable to expect increased between-hemisphere connectivity in regions involved in absence epilepsy because it emerges from bilateral abnormal enhanced excitability. We recently reported abnormal increased connectivity between the hemispheres in patients with childhood absence epilepsy in seizure-related regions (lateral orbitofrontal cortex), even when seizures were not occurring (Bai et al., 2011). These findings provide further evidence for bilateral network abnormalities in this disorder which may contribute to abnormal synchrony and excitability during the interictal period. Absence epilepsy shows widespread, bilaterally symmetric BOLD fMRI changes during seizures in animal models (Tenney et al., 2003; Nersesyan et al., 2004a; Mishra et al., 2011b) as well as in children with absence epilepsy (Salek-Haddadi et al., 2003; Laufs et al., 2006; Moeller et al., 2008; Bai et al., 2010). Although our findings support the concept of abnormal bilateral network synchrony during ictal (Musgrave and Gloor, 1980; Vergnes et al., 1989) as well as in the interictal period, and preferentially involving the regions most intensely involved in seizures, we do not know what causes these increased interhemispheric correlations in WAG/Rij rat model of absence epilepsy. One could speculate that the abnormally enhanced interhemispheric connectivity leads to functional changes in cortico–cortical connections in the regions of seizure discharges we observed and it could represent a preseizure or subthreshold excitatory phenomenon not detectable on EEG. Of note, we did not see significantly enhanced resting interhemispheric connectivity in WAG/Rij rats during runs in which no SWD occurred (WAG/Rij Group II). One possibility is that the putative subthreshold activity not detectable on EEG is enhanced during the interictal period in temporal proximity to SWD activity, which occurred in the WAG/Rij Group I but not Group II data. Another possibility is that the five WAG/Rij Group II animals who had no SWD activity in any runs simply had a less severe epileptic phenotype and less connectivity at all times. To distinguish these possibilities future work should more firmly establish the severity of the phenotype in each animal through chronic EEG recordings at other times from the EEG–fMRI. Abnormal connectivity could be a consequence of recurrent SWD or may caused by some other aspect of the underlying disorder. However, chronic seizures cause network dysfunction that could contribute to some of the long–term attentional and other psychosocial problems seen in the generalized epilepsies (Wirrell et al., 1997; Camfield and Camfield, 2002). Abnormally increased resting functional connectivity may also reflect chronic, abnormal, anatomo–functional integration resulting from anatomical abnormalities or plasticity (Luo et al., 2011). It will be useful to test if the regions of abnormal cortical connectivity are capable of driving one another. This can be tested by performing cortical stimulation experiments to see if one drives another or some other brain structure is responsible for driving bilateral cortex at the same time. In human brain, correlations in low-frequency BOLD fluctuations are considered to reflect cortico–cortical connections (Lowe et al., 2000). Thus enhanced connectivity could be a specific characteristic of absence epilepsy, which involves dissemination of bilateral slow–wave discharges and seizures, which might also lead to partial attention impairment and loss of consciousness during seizures (Killory et al., 2011).
Resting functional connectivity approaches offers a number of advantages in studying interictal changes in absence epilepsy. The relatively slow time scale of neurovascular events measured by resting fMRI connectivity provides a window into disease mechanisms over the longer time scale of the interictal period. In contrast to EEG, fMRI allows for detection of whole brain signals simultaneously. Other neuroimaging techniques used in investigating interictal changes in generalized epilepsy are fluoro-2-deoxy-D-glucose PET (Hikima et al., 2004; Ciumas et al., 2010), magnetic resonance spectroscopy (Helms et al., 2006), and voxel-based morphometry in MRI (Caplan et al., 2009). These techniques have been useful in investigating interictal changes in idiopathic generalized epilepsy. Similar to above mentioned methods, the resting functional connectivity could potentially serve as a useful biomarker for absence epilepsy during the interictal period and this may have advantage for detecting abnormal network function.
If early and prolonged treatment is to be administered to prevent epileptogenesis in children with absence seizure, it will be crucial to detect beneficial effects of treatment without needing to wait until adulthood. Therefore, safe and non–invasive methods are needed to monitor whether biological changes associated with epileptogenesis (Blumenfeld et al., 2008; Chahboune et al., 2009; Mishra et al., 2011a) are effectively blocked by early treatment. Neuroimaging can detect brain biological changes noninvasively, and animal models such as the WAG/Rij rat are ideal for initial testing of neuroimaging biomarkers of epileptogenesis. One possible concern is that this study was performed under anesthesia, while fMRI in children to monitor therapy would be done in the awake state. Use of fentanyl and haloperidol anesthesia greatly enhances our ability to obtain stable and reliable MRI measurements in the rodent model, without blocking SWD. Previous studies demonstrate that SWD under fentanyl and haloperidol anesthesia (Pinault et al., 1998; Nersesyan et al., 2004a) are similar to the awake state (Meeren et al., 2002; Blumenfeld et al., 2008; Chahboune et al., 2009) in terms of spatial and temporal distribution of seizures. However, anesthesia depth is known to modulate resting functional connectivity (Lu et al., 2007). It should be noted that anesthesia tends to reduce resting functional connectivity, but in our study, we observed very significantly increased connectivity in the epileptic animals despite anesthesia. The large increase in connectivity we observed in the somatosensory and adjacent cortices of epileptic animals compared to our controls, and compared to the lower values observed by others (Lu et al., 2007) in normal animals in this region, suggest that the differences between groups are unlikely to be caused entirely by anesthesia. Another potential limitation of the current model is that unlike human patients, the rat cortex shows mainly fMRI increases in relation to SWD (Nersesyan et al., 2004a; Tenney et al., 2004; Mishra et al., 2011b). fMRI decreases in the rat model were confined mostly to the basal ganglia, which did not show significant connectivity to other seizure regions.
Conclusions
Even when seizures are not occurring, the regions in which seizures are most intense show markedly increased resting functional connectivity in epileptic WAG/Rij rats compared to Wistar control rats. This finding can be a promising biomarker for monitoring SWD epileptogenesis. Our findings can also be useful in monitoring treatment effects in absence epilepsy and help understand brain plasticity in this disease.
Supplementary Material
Acknowledgments
This work was supported by NIH R01 NS049307 (HB), Epilepsy Foundation Postdoctoral Research and Training Award ID: 123505 (AMM), P30 NS052519 (FH), and by the Betsy and Jonathan Blattmachr family. We thank Dr. Bei Wang and Xiaoxian Ma for their technical assistance in animal preparation, the engineering staff of the Magnetic Resonance Research Center including Peter Brown and Scott McIntyre and Quantitative Neuroscience with Magnetic Resonance (http://qnmr.yale.edu) for hardware maintenance and radio frequency probe construction.
Footnotes
Disclosure
We confirm that we have read the Journal’s position on issues involved in ethical publication and affirm that this report is consistent with those guidelines. None of the authors has any conflict of interest to disclose.
References
- Archer JS, Abbott DF, Waites AB, Jackson GD. fMRI “deactivation” of the posterior cingulate during generalized spike and wave. Neuroimage. 2003;20:1915–1922. doi: 10.1016/s1053-8119(03)00294-5. [DOI] [PubMed] [Google Scholar]
- Auer DP. Spontaneous low-frequency blood oxygenation level-dependent fluctuations and functional connectivity analysis of the ‘resting’ brain. Magnetic resonance imaging. 2008;26:1055–1064. doi: 10.1016/j.mri.2008.05.008. [DOI] [PubMed] [Google Scholar]
- Bai X, Vestal M, Berman R, Negishi M, Spann M, Vega C, Desalvo M, Novotny EJ, Constable RT, Blumenfeld H. Dynamic time course of typical childhood absence seizures: EEG, behavior, and functional magnetic resonance imaging. J Neurosci. 2010;30:5884–5893. doi: 10.1523/JNEUROSCI.5101-09.2010. [DOI] [PMC free article] [PubMed] [Google Scholar]
- Bai X, Guo J, Killory B, Vestal M, Berman R, Negishi M, Danielson N, Novotny EJ, Constable RT, Blumenfeld H. Resting functional connectivity between the hemispheres in childhood absence epilepsy. Neurology. 2011;76:1960–1967. doi: 10.1212/WNL.0b013e31821e54de. [DOI] [PMC free article] [PubMed] [Google Scholar]
- Berman R, Negishi M, Vestal M, Spann M, Chung MH, Bai X, Purcaro M, Motelow JE, Danielson N, Dix-Cooper L, Enev M, Novotny EJ, Constable RT, Blumenfeld H. Simultaneous EEG, fMRI, and behavior in typical childhood absence seizures. Epilepsia. 2010;51:2011–2022. doi: 10.1111/j.1528-1167.2010.02652.x. [DOI] [PMC free article] [PubMed] [Google Scholar]
- Bettus G, Guedj E, Joyeux F, Confort-Gouny S, Soulier E, Laguitton V, Cozzone PJ, Chauvel P, Ranjeva JP, Bartolomei F, Guye M. Decreased basal fMRI functional connectivity in epileptogenic networks and contralateral compensatory mechanisms. Human brain mapping. 2009;30:1580–1591. doi: 10.1002/hbm.20625. [DOI] [PMC free article] [PubMed] [Google Scholar]
- Biswal B, Yetkin FZ, Haughton VM, Hyde JS. Functional connectivity in the motor cortex of resting human brain using echo-planar MRI. Magn Reson Med. 1995;34:537–541. doi: 10.1002/mrm.1910340409. [DOI] [PubMed] [Google Scholar]
- Blumenfeld H. Consciousness and epilepsy: why are patients with absence seizures absent? Prog Brain Res. 2005;150:271–286. doi: 10.1016/S0079-6123(05)50020-7. [DOI] [PMC free article] [PubMed] [Google Scholar]
- Blumenfeld H, Klein JP, Schridde U, Vestal M, Rice T, Khera DS, Bashyal C, Giblin K, Paul-Laughinghouse C, Wang F, Phadke A, Mission J, Agarwal RK, Englot DJ, Motelow J, Nersesyan H, Waxman SG, Levin AR. Early treatment suppresses the development of spike-wave epilepsy in a rat model. Epilepsia. 2008;49:400–409. doi: 10.1111/j.1528-1167.2007.01458.x. [DOI] [PMC free article] [PubMed] [Google Scholar]
- Camfield P, Camfield C. Epileptic syndromes in childhood: clinical features, outcomes, and treatment. Epilepsia. 2002;43(Suppl 3):27–32. doi: 10.1046/j.1528-1157.43.s.3.3.x. [DOI] [PubMed] [Google Scholar]
- Caplan R, Levitt J, Siddarth P, Wu KN, Gurbani S, Sankar R, Shields WD. Frontal and temporal volumes in Childhood Absence Epilepsy. Epilepsia. 2009;50:2466–2472. doi: 10.1111/j.1528-1167.2009.02198.x. [DOI] [PubMed] [Google Scholar]
- Chahboune H, Mishra AM, DeSalvo MN, Staib LH, Purcaro M, Scheinost D, Papademetris X, Fyson SJ, Lorincz ML, Crunelli V, Hyder F, Blumenfeld H. DTI abnormalities in anterior corpus callosum of rats with spike-wave epilepsy. Neuro Image. 2009;47:459–466. doi: 10.1016/j.neuroimage.2009.04.060. [DOI] [PMC free article] [PubMed] [Google Scholar]
- Ciumas C, Wahlin TB, Espino C, Savic I. The dopamine system in idiopathic generalized epilepsies: identification of syndrome-related changes. Neuroimage. 2010;51:606–615. doi: 10.1016/j.neuroimage.2010.02.051. [DOI] [PubMed] [Google Scholar]
- Coenen AM, Van Luijtelaar EL. The WAG/Rij rat model for absence epilepsy: age and sex factors. Epilepsy Research. 1987;1:297–301. doi: 10.1016/0920-1211(87)90005-2. [DOI] [PubMed] [Google Scholar]
- Coenen AM, Van Luijtelaar EL. Genetic Animal Models for Absence Epilepsy: A Review of the WAG/Rij Strain of Rats. Behav Genet. 2003;33:635–655. doi: 10.1023/a:1026179013847. [DOI] [PubMed] [Google Scholar]
- Cordes D, Haughton VM, Arfanakis K, Carew JD, Turski PA, Moritz CH, Quigley MA, Meyerand ME. Frequencies contributing to functional connectivity in the cerebral cortex in “resting-state” data. Ajnr. 2001;22:1326–1333. [PMC free article] [PubMed] [Google Scholar]
- David O, Guillemain I, Saillet S, Reyt S, Deransart C, Segebarth C, Depaulis A. Identifying neural drivers with functional MRI: an electrophysiological validation. PLoS biology. 2008;6:2683–2697. doi: 10.1371/journal.pbio.0060315. [DOI] [PMC free article] [PubMed] [Google Scholar]
- Englot DJ, Mishra AM, Mansuripur PK, Herman P, Hyder F, Blumenfeld H. Remote effects of focal hippocampal seizures on the rat neocortex. J Neurosci. 2008;28:9066–9081. doi: 10.1523/JNEUROSCI.2014-08.2008. [DOI] [PMC free article] [PubMed] [Google Scholar]
- Golanov EV, Yamamoto S, Reis DJ. Spontaneous waves of cerebral blood flow associated with a pattern of electrocortical activity. The American journal of physiology. 1994;266:R204–214. doi: 10.1152/ajpregu.1994.266.1.R204. [DOI] [PubMed] [Google Scholar]
- Gotman J, Grova C, Bagshaw A, Kobayashi E, Aghakhani Y, Dubeau F. Generalized epileptic discharges show thalamocortical activation and suspension of the default state of the brain. Proceedings of the National Academy of Sciences of the United States of America. 2005;102:15236–15240. doi: 10.1073/pnas.0504935102. [DOI] [PMC free article] [PubMed] [Google Scholar]
- Greicius M. Resting-state functional connectivity in neuropsychiatric disorders. Current opinion in neurology. 2008;21:424–430. doi: 10.1097/WCO.0b013e328306f2c5. [DOI] [PubMed] [Google Scholar]
- Hamandi K, Salek-Haddadi A, Laufs H, Liston A, Friston K, Fish DR, Duncan JS, Lemieux L. EEG–fMRI of idiopathic and secondarily generalized epilepsies. Neuroimage. 2006;31:1700–1710. doi: 10.1016/j.neuroimage.2006.02.016. [DOI] [PubMed] [Google Scholar]
- Hampson M, Driesen NR, Skudlarski P, Gore JC, Constable RT. Brain connectivity related to working memory performance. J Neurosci. 2006;26:13338–13343. doi: 10.1523/JNEUROSCI.3408-06.2006. [DOI] [PMC free article] [PubMed] [Google Scholar]
- Helms G, Ciumas C, Kyaga S, Savic I. Increased thalamus levels of glutamate and glutamine (Glx) in patients with idiopathic generalised epilepsy. Journal of neurology, neurosurgery, and psychiatry. 2006;77:489–494. doi: 10.1136/jnnp.2005.074682. [DOI] [PMC free article] [PubMed] [Google Scholar]
- Hikima A, Mochizuki H, Oriuchi N, Endo K, Morikawa A. Semiquantitative analysis of interictal glucose metabolism between generalized epilepsy and localization related epilepsy. Annals of nuclear medicine. 2004;18:579–584. doi: 10.1007/BF02984579. [DOI] [PubMed] [Google Scholar]
- Hughes JR. Absence seizures: a review of recent reports with new concepts. Epilepsy Behav. 2009;15:404–412. doi: 10.1016/j.yebeh.2009.06.007. [DOI] [PubMed] [Google Scholar]
- Jenkins GM, Watts DG. Spectral analysis and its applications. Holden-Day, Publ; 1968. [Google Scholar]
- Killory BD, Bai X, Negishi M, Vega C, Spann MN, Vestal M, Guo J, Berman R, Danielson N, Trejo J, Shisler D, Novotny EJ, Jr, Constable RT, Blumenfeld H. Impaired attention and network connectivity in childhood absence epilepsy. Neuroimage. 2011;56:2209–2217. doi: 10.1016/j.neuroimage.2011.03.036. [DOI] [PMC free article] [PubMed] [Google Scholar]
- Kirk RE. Experimental Design: Procedures for the Behavioral Sciences. 3. California: Brooks/Cole, Pacific Grove; 1995. [Google Scholar]
- Laufs H, Lengler U, Hamandi K, Kleinschmidt A, Krakow K. Linking generalized spike-and-wave discharges and resting state brain activity by using EEG/fMRI in a patient with absence seizures. Epilepsia. 2006;47:444–448. doi: 10.1111/j.1528-1167.2006.00443.x. [DOI] [PubMed] [Google Scholar]
- Li SJ, Li Z, Wu G, Zhang MJ, Franczak M, Antuono PG. Alzheimer Disease: evaluation of a functional MR imaging index as a marker. Radiology. 2002;225:253–259. doi: 10.1148/radiol.2251011301. [DOI] [PubMed] [Google Scholar]
- Lowe MJ, Mock BJ, Sorenson JA. Functional connectivity in single and multislice echoplanar imaging using resting-state fluctuations. Neuroimage. 1998;7:119–132. doi: 10.1006/nimg.1997.0315. [DOI] [PubMed] [Google Scholar]
- Lowe MJ, Dzemidzic M, Lurito JT, Mathews VP, Phillips MD. Correlations in low-frequency BOLD fluctuations reflect cortico-cortical connections. Neuroimage. 2000;12:582–587. doi: 10.1006/nimg.2000.0654. [DOI] [PubMed] [Google Scholar]
- Lowe MJ, Phillips MD, Lurito JT, Mattson D, Dzemidzic M, Mathews VP. Multiple sclerosis: low-frequency temporal blood oxygen level-dependent fluctuations indicate reduced functional connectivity initial results. Radiology. 2002;224:184–192. doi: 10.1148/radiol.2241011005. [DOI] [PubMed] [Google Scholar]
- Lu H, Zuo Y, Gu H, Waltz JA, Zhan W, Scholl CA, Rea W, Yang Y, Stein EA. Synchronized delta oscillations correlate with the resting-state functional MRI signal. Proceedings of the National Academy of Sciences of the United States of America. 2007;104:18265–18269. doi: 10.1073/pnas.0705791104. [DOI] [PMC free article] [PubMed] [Google Scholar]
- Luo C, Li Q, Lai Y, Xia Y, Qin Y, Liao W, Li S, Zhou D, Yao D, Gong Q. Altered functional connectivity in default mode network in absence epilepsy: a resting-state fMRI study. Human brain mapping. 2011;32:438–449. doi: 10.1002/hbm.21034. [DOI] [PMC free article] [PubMed] [Google Scholar]
- Meeren HK, Pijn JP, Van Luijtelaar EL, Coenen AM, Lopes da Silva FH. Cortical focus drives widespread corticothalamic networks during spontaneous absence seizures in rats. Journal of Neuroscience. 2002;22:1480–1495. doi: 10.1523/JNEUROSCI.22-04-01480.2002. [DOI] [PMC free article] [PubMed] [Google Scholar]
- Mishra AM, Bai H, Gribizis A, Blumenfeld H. Neuroimaging biomarkers of epileptogenesis. Neuroscience letters. 2011a;497:194–204. doi: 10.1016/j.neulet.2011.01.076. [DOI] [PMC free article] [PubMed] [Google Scholar]
- Mishra AM, Ellens DJ, Schridde U, Motelow JE, Purcaro MJ, DeSalvo MN, Enev M, Sanganahalli BG, Hyder F, Blumenfeld H. Where fMRI and electrophysiology agree to disagree: corticothalamic and striatal activity patterns in the WAG/Rij rat. J Neurosci. 2011b;31:15053–15064. doi: 10.1523/JNEUROSCI.0101-11.2011. [DOI] [PMC free article] [PubMed] [Google Scholar]
- Moeller F, Siebner HR, Wolff S, Muhle H, Boor R, Granert O, Jansen O, Stephani U, Siniatchkin M. Changes in activity of striato-thalamo-cortical network precede generalized spike wave discharges. Neuroimage. 2008;39:1839–1849. doi: 10.1016/j.neuroimage.2007.10.058. [DOI] [PubMed] [Google Scholar]
- Musgrave J, Gloor P. The role of the corpus callosum in bilateral interhemispheric synchrony of spike and wave discharge in feline generalized penicillin epilepsy. Epilepsia. 1980;21:369–378. doi: 10.1111/j.1528-1157.1980.tb04084.x. [DOI] [PubMed] [Google Scholar]
- Nersesyan H, Hyder F, Rothman D, Blumenfeld H. Dynamic fMRI and EEG recordings during spike-wave seizures and generalized tonic-clonic seizures in WAG/Rij rats. J Cereb Blood Flow Metab. 2004a;24:589–599. doi: 10.1097/01.WCB.0000117688.98763.23. [DOI] [PubMed] [Google Scholar]
- Nersesyan H, Herman P, Erdogan E, Hyder F, Blumenfeld H. Relative changes in cerebral blood flow and neuronal activity in local microdomains during generalized seizures. J Cereb Blood Flow Metab. 2004b;24:1057–1068. doi: 10.1097/01.WCB.0000131669.02027.3E. [DOI] [PubMed] [Google Scholar]
- Pawela CP, Biswal BB, Cho YR, Kao DS, Li R, Jones SR, Schulte ML, Matloub HS, Hudetz AG, Hyde JS. Resting-state functional connectivity of the rat brain. Magn Reson Med. 2008;59:1021–1029. doi: 10.1002/mrm.21524. [DOI] [PMC free article] [PubMed] [Google Scholar]
- Paxinos G, Watson C. The rat brain in stereotaxic coordinates. 4. San Diego: Academic Press; 1998. [DOI] [PubMed] [Google Scholar]
- Pereira FR, Alessio A, Sercheli MS, Pedro T, Bilevicius E, Rondina JM, Ozelo HF, Castellano G, Covolan RJ, Damasceno BP, Cendes F. Asymmetrical hippocampal connectivity in mesial temporal lobe epilepsy: evidence from resting state fMRI. BMC neuroscience. 2010;11:66. doi: 10.1186/1471-2202-11-66. [DOI] [PMC free article] [PubMed] [Google Scholar]
- Pinault D, Leresche N, Charpier S, Deniau JM, Marescaux C, Vergnes M, Crunelli V. Intracellular recordings in thalamic neurones during spontaneous spike and wave discharges in rats with absence epilepsy. Journal of Physiology. 1998;509:449–456. doi: 10.1111/j.1469-7793.1998.449bn.x. [DOI] [PMC free article] [PubMed] [Google Scholar]
- Raichle ME, MacLeod AM, Snyder AZ, Powers WJ, Gusnard DA, Shulman GL. A default mode of brain function. Proceedings of the National Academy of Sciences of the United States of America. 2001;98:676–682. doi: 10.1073/pnas.98.2.676. [DOI] [PMC free article] [PubMed] [Google Scholar]
- Salek-Haddadi A, Lemieux L, Merschhemke M, Friston KJ, Duncan JS, Fish DR. Functional magnetic resonance imaging of human absence seizures. Annals of Neurology. 2003;53:663–667. doi: 10.1002/ana.10586. [DOI] [PubMed] [Google Scholar]
- Sporns O. From complex networks to intelligent systems. In: al BSe, editor. Creating Brain-Like Intelligence. Heidelberg: Springer-Verlag Berlin; 2009. pp. 15–30. [Google Scholar]
- Tenney JR, Duong TQ, King JA, Ferris CF. FMRI of brain activation in a genetic rat model of absence seizures. Epilepsia. 2004;45:576–582. doi: 10.1111/j.0013-9580.2004.39303.x. [DOI] [PMC free article] [PubMed] [Google Scholar]
- Tenney JR, Duong TQ, King JA, Ludwig R, Ferris CF. Corticothalamic modulation during absence seizures in rats: a functional MRI assessment. Epilepsia. 2003;44:1133–1140. doi: 10.1046/j.1528-1157.2003.61002.x. [DOI] [PMC free article] [PubMed] [Google Scholar]
- Vergnes M, Marescaux C, Lannes B, Depaulis A, Micheletti G, Warter JM. Interhemispheric desynchronization of spontaneous spike-wave discharges by corpus callosum transection in rats with petit mal-like epilepsy. Epilepsy Res. 1989;4:8–13. doi: 10.1016/0920-1211(89)90052-1. [DOI] [PubMed] [Google Scholar]
- Vincent JL, Patel GH, Fox MD, Snyder AZ, Baker JT, Van Essen DC, Zempel JM, Snyder LH, Corbetta M, Raichle ME. Intrinsic functional architecture in the anaesthetized monkey brain. Nature. 2007;447:83–86. doi: 10.1038/nature05758. [DOI] [PubMed] [Google Scholar]
- Waites A, Briellmann R, Saling M, Abbott D, Jackson G. Functional connectivity networks are disrupted in left temporal lobe epilepsy. Ann Neurol. 2006;59:335–343. doi: 10.1002/ana.20733. [DOI] [PubMed] [Google Scholar]
- Wirrell EC, Camfield CS, Camfield PR, Dooley JM, Gordon KE, Smith B. Long-term psychosocial outcome in typical absence epilepsy. Sometimes a wolf in sheeps’ clothing. Archives of Pediatrics & Adolescent Medicine. 1997;151:152–158. doi: 10.1001/archpedi.1997.02170390042008. [DOI] [PubMed] [Google Scholar]
- Wu CW, Gu H, Lu H, Stein EA, Chen JH, Yang Y. Mapping functional connectivity based on synchronized CMRO2 fluctuations during the resting state. Neuroimage. 2009;45:694–701. doi: 10.1016/j.neuroimage.2008.12.066. [DOI] [PMC free article] [PubMed] [Google Scholar]
- Zhang Z, Liao W, Chen H, Mantini D, Ding JR, Xu Q, Wang Z, Yuan C, Chen G, Jiao Q, Lu G. Altered functional-structural coupling of large-scale brain networks in idiopathic generalized epilepsy. Brain. 2011;134:2912–2928. doi: 10.1093/brain/awr223. [DOI] [PubMed] [Google Scholar]
- Zhao F, Zhao T, Zhou L, Wu Q, Hu X. BOLD study of stimulation-induced neural activity and resting-state connectivity in medetomidine-sedated rat. Neuroimage. 2008;39:248–260. doi: 10.1016/j.neuroimage.2007.07.063. [DOI] [PMC free article] [PubMed] [Google Scholar]
Associated Data
This section collects any data citations, data availability statements, or supplementary materials included in this article.